Australia and the Global Economy – The Terms of Trade Boom
Download the complete Explainer 268KBAustralia is a relatively open, trade-exposed economy. This means that changes in other countries’ demand for our goods and services can have significant implications for our economy. For example, an increase in global demand for Australia's exports, if not matched by an increase in supply, will result in an increase in the price of those exports.
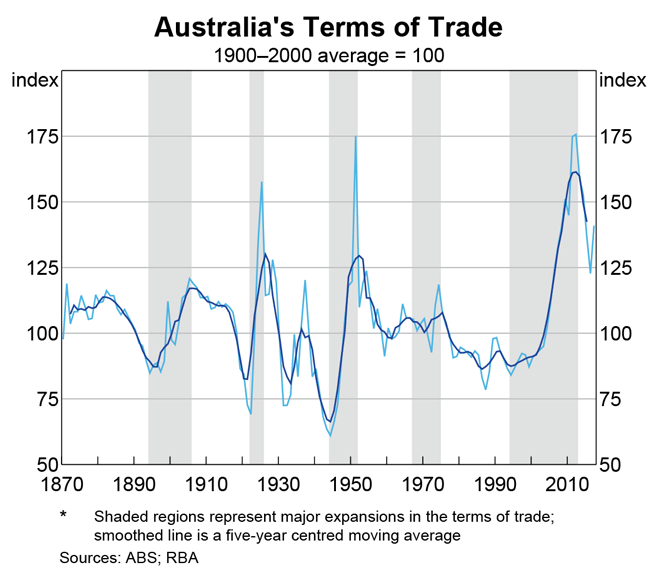
The ratio of export prices to import prices is called the terms of trade. This Explainer outlines the effects of the 2005–11 terms of trade boom on the Australian economy.
What Caused the Terms of Trade Boom?
The terms of trade boom was driven by very large increases in the prices of some of Australia's commodity exports. Australia has plentiful supplies of natural resources, including the second largest accessible reserves of iron ore in the world, the fifth largest reserves of coal and significant gas resources. For a long time, commodities have made up a sizeable share of our exports.
From the mid 2000s, the prices for commodities used to produce steel and generate energy – including iron ore, coal and natural gas – rose sharply. This was because global demand for these commodities increased significantly and supply was unable to keep up. The increase in global demand owed to a large increase in demand for steel and energy, driven by rapid urbanisation and industrialisation in China and some other emerging economies. Urbanisation (the movement of people from rural areas to towns and cities) and industrialisation (the development of manufacturing industries) requires investment in new housing, factories and transport infrastructure – all of which use steel in their construction.
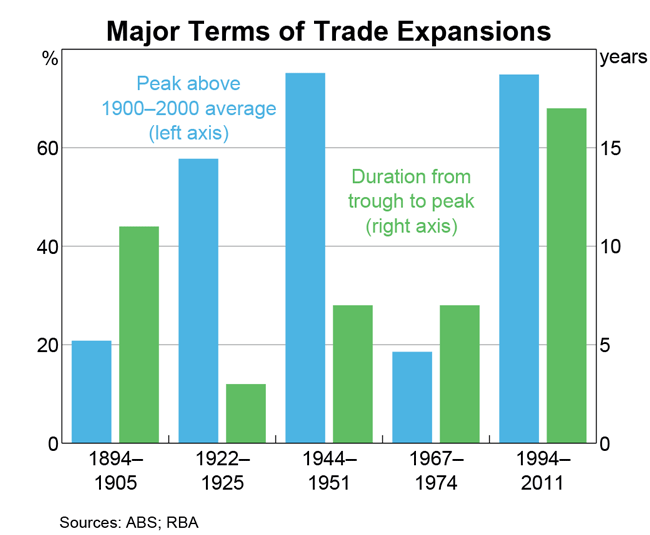
As a result, Australia's terms of trade reached very high levels. In fact, in 2011, the terms of trade were around 75 per cent above the average of the preceding century. This was also a longer terms of trade expansion than in previous episodes.
How Did the Terms of Trade Boom Affect the Australian Economy?
During the boom
Mining investment
These extraordinary commodity price increases triggered a massive amount of investment in mines and mining infrastructure across Australia. As prices for commodities increased, mining firms were keen to increase production to profit from the higher prices. To extract more commodities, mining firms expanded existing mines and developed new mines, leading to the largest resources investment boom in Australian history. For the 50 years leading up to the terms of trade boom, mining investment had averaged just over 1½ per cent of GDP. In 2012, mining investment had increased five-fold from its level in 2004 (from around $20 billion to $130 billion), peaking at 9 per cent of GDP.
Demand and profits
The increase in mining revenues and investment spilled over to other parts of the Australian economy:
- Increased demand for workers and higher wages: Higher demand for commodities and investment in new mines and infrastructure increased demand for workers in the mining sector, as well as other related sectors (including construction, engineering, finance and insurance, legal and transport). This resulted in an increase in both the number of workers employed and the wages these workers were paid, which in turn supported household incomes and consumption. In other words, more Australians had more money to spend on goods and services.
- Government revenue: Increases in the quantities of commodities extracted and higher prices resulted in higher profits for mining companies, which led to increased tax and royalty receipts by federal, state and territory governments.
- Increased shareholder profits: Increased after-tax profits in the mining sector and other related industries flowed through to company shareholders, a proportion of which were Australian residents.
The large-scale investment in the mining sector, alongside higher incomes, increased overall demand in the Australian economy. This, in turn, led to increased labour demand, which put downward pressure on the unemployment rate and upward pressure on wages, resulting in higher inflationary pressures.
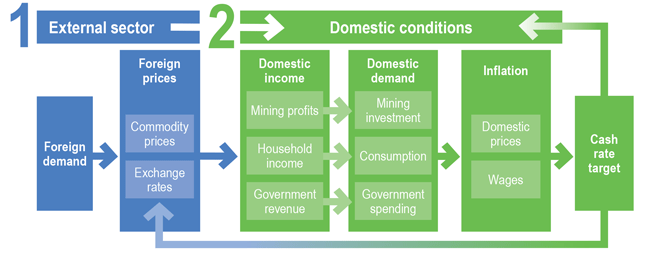
Offsetting effects from the exchange rate and the cash rate target
The increase in the terms of trade led to an appreciation of the Australian dollar. At the same time, the Reserve Bank increased the target for the cash rate in response to higher demand and inflationary pressures. The effects of the increase in the cash rate target and appreciation of the Australian dollar were more obvious in the non-mining sectors of the economy, such as the tourism industry, which were not directly benefiting from higher commodity prices. To learn more about the effects of changes in the cash rate target on the domestic economy, see Explainer: The Transmission of Monetary Policy.
Regional differences
The effects of the increase in mining investment were felt differently across various parts of the country, and were more easily identifiable in the resource-rich states of Western Australia and Queensland.
Commodities are spread unevenly across the country, with Western Australia and Queensland having the highest concentration of known reserves. Almost all iron ore mining occurs in Western Australia (mostly in the Pilbara region in the north-west of the state). Two-thirds of coal mining is in Queensland. In the case of natural gas, the bulk of production is from Western Australia and Queensland.
After the boom
Eventually, the new investment in mines and mining infrastructure meant that Australia was able to export more iron ore, coal and gas (shifting the commodities supply curve out from S1 to S2, in response to the initial upward shift in demand from D1 to D2). At the same time as this additional supply became available, demand for commodities from China and other parts of Asia slowed (demand shifted back in from D2 to D3). The combined effect of this increase in supply and fall in demand was a decline in commodity prices and Australia's terms of trade (with prices falling from P2 to P3 and quantities increasing from Q2 to Q3).

This decline in the terms of trade had the opposite effect on the economy of the increase in the terms of trade. Falling commodity prices weighed on growth in GDP, employment, profits, wages and fiscal revenues, as well as on inflation. In response, the Reserve Bank cut the cash rate target.
The effects of the falls in commodity demand and prices were felt most in the mining sector and the key mining states of Western Australia and Queensland, but were also evident across the country.
In the non-mining sector, growth in activity and employment picked up following the end of the boom. The reduction in the cash rate target between 2011 and 2016 assisted in rebalancing activity towards the non-mining economy. The depreciation of the Australian dollar between 2013 and 2015 also supported activity in the nonmining tradable sector, which includes agriculture, manufacturing and some services. Indeed, service exports have made a noticeable contribution to GDP growth over the past few years, with tourism, education and business services exports all increasing.
Compared with other terms of trade cycles
Compared with previous terms of trade cycles, the 2005–11 episode was much less disruptive to the national economy. Terms of trade surges in the 1950s and the 1970s produced significant inflation on the way up and were followed by major slowdowns or recessions in economic activity as the terms of trade fell back. In contrast, during the 2005–11 boom, inflationary pressures were relatively contained as the terms of trade rose. And on the way down – even as commodity prices fell sharply and mining investment declined – growth in GDP, employment and wages was only a little weaker than average.

One reason for the relatively smooth transition after the 2005–11 boom was the floating exchange rate (the Australian dollar was floated in 1983). At its peak in mid 2011, one Australian dollar was worth around US$1.10. By 2017, the Australian dollar was around 30 per cent lower than that against the US dollar, and about 16 per cent lower against the currencies of Australia's trading partners more generally. This movement – both up and down – was part of what helped insulate the economy from the effects of this particularly large terms of trade cycle. For more information on the effects of changes in the exchange rate on the domestic economy, see Explainer: Exchange Rates and the Australian Economy.
The economy's relatively smooth adjustment was also helped by a more flexible labour market than in earlier terms of trade booms. In the past, Australia's centralised wage-setting system had the effect of spreading wage increases across the economy to sectors where profitability had not increased, resulting in higher inflation and unemployment.