Speech Do Australian Households Borrow Too Much?

Tonight's subject is one that has attracted increasing attention over recent years – namely, the growth of household debt. There is no doubt that this debt has grown quickly over the past decade, and this has prompted a number of people to suggest that it is too high and that it presents a threat to the future health of the economy. What I would like to do tonight is to examine household debt from several perspectives in order to form a judgment on whether its current level poses risks for the economy, and what those risks might be. My broad conclusion is that a proportion of households have clearly taken on more risk, which has increased the risk profile for the sector as a whole. This is likely to make household consumption more sensitive to changes in economic circumstances than it formerly was, but the overall risk for the economy has not gone up to the extent that would be indicated by the rise in the level of debt or in the debt to income ratio.
The subject of household debt is one that we at the Reserve Bank have been thinking about, and writing about, for some time. Over the past year, we have produced a number of studies on debt and housing, which have laid out the main facts. I will summarise them briefly, before moving on to the more difficult task of making judgments about their economic significance. Those who want more detail can consult the studies listed below[1].
What has happened?
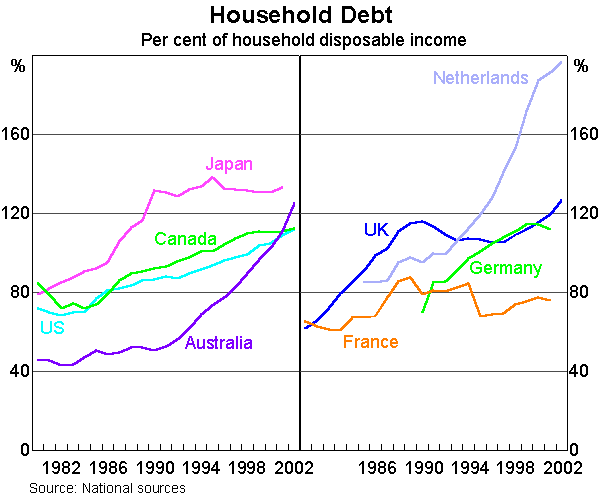
- Most studies concentrate on movements in the ratio of household debt to household incomes. Over the past decade, this ratio in Australia has risen from a level that was low by international standards (56 per cent) to one that is in the upper end of the range of other comparable countries (125 per cent).
- The rise in household debt was mainly due to increased borrowing for housing. Housing debt accounts for 83 per cent of total household debt, and that percentage has risen slightly over the decade. The story of household debt is largely a story about housing and, of course, is intimately tied up with the subject of rising house prices. In the remainder of my talk I will deal only with housing debt and ignore other forms of household debt.
- While borrowing for owner-occupation is still the largest part of housing debt, the fastest growing component has been borrowing for investor housing, which now represents 30 per cent of the stock of housing loans (compared with 18 per cent a decade ago).
- The main reason that debt has risen is that households can afford to borrow more in a low interest rate environment like the past decade than in a high interest rate environment like the previous two decades. Allied to this is the fact that in a low inflation environment, the real value of the debt is not eroded as fast as it was in a higher inflation one. So each household that takes out a loan can borrow more at the start of the loan, and will run down the real value of the loan more slowly than formerly was the case. Analysis published by the Reserve Bank of Australia (RBA) last month shows that these two related explanations could account for an approximate doubling in the debt to income ratio when their effects had fully worked through the system.[2]
- Financial deregulation and the associated increase in competition among lenders has also played a role by making loans cheaper, easier to obtain, particularly to investors, and providing innovations such as home equity loans and redraw facilities.
- Over 70 per cent of households either own their homes outright or are renting and therefore have no housing debt. Owner-occupied housing debt is concentrated in about 30 per cent of households, as it has been for decades, but that 30 per cent have considerably higher debt levels now.[3]
- For those households with mortgages, there is a pronounced pattern in the debt to income ratio and the debt-servicing ratio over the life cycle. Both these ratios peak in the 35–40 year age group and decline thereafter, usually to zero.
- Other measures of household balance sheet health such as the debt-servicing ratio and the gearing ratio show considerably less of an upward trend than the debt to income ratio.
What can we learn from the debt to income ratio?
Does the sharp rise in the household debt to income ratio over the past decade mean that it is now too high, or, as some commentators put it, that it has reached an unsustainable level? Unfortunately, it is impossible to answer this question by looking at the aggregate ratio, even if we supplement our analysis by international comparisons (Graph 1). There does not appear to be a level at which bad things start to happen – Japan's ratio levelled off at about 130 after the equity and property bubble burst, but it was corporate debt rather than household debt which fuelled the bubble. In the United Kingdom the ratio fell in the early 1990s after it reached 115, but has now resumed its upward path to be in the mid 120s, while in the Netherlands the ratio exceeds 180 and is still going up.
The debt to income ratio is only one measure of the health of household balance sheets, and, as will be argued below, not the best measure. We have to ask why the debt to income ratio rose, before we can draw any conclusions. As we demonstrated earlier, the main reason it has risen is that interest rates have fallen: mortgage rates halved between the second half of the 1980s and the past five years. As a result, a household which borrowed up to the point where debt servicing equalled 30 per cent of gross income (a common yardstick used by banks and other mortgage lenders) would be able to nearly double the size of the mortgage and still make the same monthly repayments as before.
In order to judge whether the resulting increase in debt represents an increase in risk, we have to go through the following mental exercise. Compare two households – one in 1993 and the other in 2003 – that have the same percentage of their income used in debt service, and have the same gearing ratio (level of debt as a percentage of value of house), but with the 2003 household having a debt level nearly twice as high as the 1993 household. Is the 2003 household taking more risk than the 1993 household?
My judgment is that the 2003 household is riskier in only one respect. For a given rise in interest rates, it will be more affected because the rise will apply to a larger loan. But it is probably not right to make the assumption about ‘a given rise in interest rates’. That is because in the low inflation/low interest rate environment we have today, interest rates do not move about as much as before. In the late 1980s, on one occasion the mortgage rate rose by 3½ percentage points in a year, in the 1990s we have had nothing like that (the largest rise in a year was 1¾ percentage points). So the answer to the question I posed above is that, provided the variability of interest rates has also fallen in proportion to the fall in the average interest rate level – which it has – the hypothetical household in 2003 is in no riskier a position than the hypothetical household in 1993.
Does this mean that the large rise in housing debt that we have seen in practice has not made the household sector more vulnerable? No, it merely means that we cannot draw this conclusion from looking at the rise in the debt to income ratio without enquiring into its cause. If, as in the hypothetical example above, it is entirely due to a fall in the level of interest rates and a commensurate fall in the variability of interest rates, then risk has not increased. This is important because most of the rise in the debt to income ratio in Australia is of this type. But this does not mean that we can dismiss all concerns about the rise in household debt. This is because some of the rise in the debt to income ratio was due to factors other than the fall in interest rates, and these factors may well have resulted in households taking on more risk, and in many cases a lot more than they recognise. The rest of my talk will attempt to spell out these factors.
Other factors behind the rise in the debt to income ratio
Lower inflation
The other variable that has a quantifiable and mechanical effect on the debt to income ratio is the rate of inflation or, more precisely, the rate of increase of household incomes. Not surprisingly, this is highly correlated with the rate of interest, but it has an identifiably separate influence. When the rate of growth of incomes slows, the debt to income ratio of each borrowing household is eroded more slowly than in a higher inflation environment.
When a household first takes out a mortgage, it places itself in a somewhat vulnerable position in that its debt is a multiple of its income, and its debt-servicing ratio is at its maximum. It accepts the risks involved because it is a necessary part of the path to home ownership. In the past, the typical household only remained in this relatively ‘risky phase’ for a few years, mainly because its nominal income rose quickly (partly due to inflation), and secondly because its debt was reduced by principal repayment. In a low inflation environment, nominal incomes rise more slowly and so households remain in the ‘risky phase’ for longer. If they have fully factored this into their financial decision-making, it should not present a major problem, but if they are still operating on the assumption that inflation will quickly reduce debt burdens, they would be taking more risk than they perceive[4].
Financial deregulation and increased competition
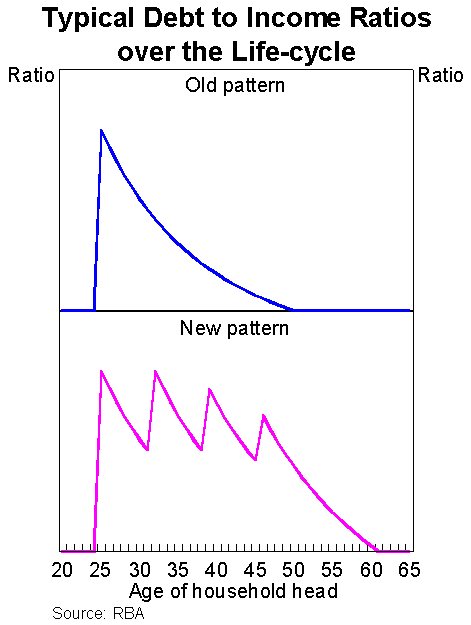
A range of other factors has allowed households to maintain higher levels of debt for longer periods than previously, and most of these are, at least in part, attributable to innovations brought about by financial deregulation and increased competition among providers of credit. It is now much easier to refinance and so take out a larger loan either on an existing property or to purchase a more expensive one. Banks and mortgage brokers now actively encourage these activities, and so loan turnover has risen sharply. A similar process is seen with new lending products such as home equity loans and mortgages with a redraw facility.
These developments have allowed borrowers to go back and top up their debt over their lifetime rather than simply allow it to decline through principal repayment. The contrast between the two types of behaviour is shown in Graph 2: the older pattern is shown in the top panel, and the newer one in the lower panel. Like the effect of lower inflation described earlier, this allows households to remain in the ‘risky phase’ for longer than was the case in earlier decades.
The special case of lending for investor housing
So far the analysis has implicitly assumed that we are talking about households that borrow for owner-occupation or, at the margin, for consumption. But the biggest single change over the past decade is the rapid increase in borrowing in order to purchase a dwelling for investment purposes. The annual growth rate in this type of borrowing has averaged 21.6 per cent over the past decade, compared with 13.4 per cent for borrowing for owner-occupation. To put this in another perspective – if borrowing for investment purposes had only risen at the same rate as borrowing for owner-occupation, the aggregate debt to income ratio would only have reached 109 per cent, not the 125 per cent that actually occurred. At the former figure, Australia would still be in the lower half of the countries shown in Graph 1.
So borrowing for investor housing is a large part of the story of rising household debt in Australia. It is also different to borrowing for owner-occupation in several respects. First, it is a pure investment decision, not a lifestyle decision. Many people would choose to become owner-occupiers even if they understood that it might not be particularly profitable; it is hard to see why anyone would be an investor in housing other than because they expected it would be a profitable commercial decision (hence, the widespread use of ‘investment seminars’ to encourage this type of activity). Second, for a high proportion of these investors, tax considerations drive the profitability calculations and so provide an incentive to maximise debt. Thirdly, borrowing for investment purposes is inherently riskier than for owner-occupation, in that the investor cannot be sure of who is going to occupy the dwelling and on what terms, but the owner-occupier knows the answer to that question.
There are additional risks that now accompany investor housing as a result of how the industry has changed. A high proportion of investment is now in multi-unit apartment buildings, where developers pre-sell to investors, usually on 10 per cent deposit. They have, therefore, effectively transferred the first 10 per cent of price risk onto investors. Because the building may take about 18 months to complete, that means the investor will not know whether the risk has eventuated for 18 months. In economics, a lag between when a decision to increase supply is made and when the price effect occurs can lead to what is colloquially known as a ‘hog cycle’, and can be associated with large overshootings in prices. It is conceivable that at some point in time there could be a large reduction in investor demand for apartments, perhaps because of fears of over-supply. But because of the production lag, there would still be an 18-month supply of partly-built apartments to come onto the market and to be digested by it. With the trend towards large-scale developments which take longer to complete, it is possible that this lag has been lengthening in recent years.
For these reasons, we at the Reserve Bank have been concerned about investor housing for some time. We are concerned not only because it has been a very large factor in explaining the growth of household debt, but because the risks involved are greater than in borrowing for owner-occupation, and are unlikely to be fully understood by the many newcomers to this activity.
What do other financial ratios show?
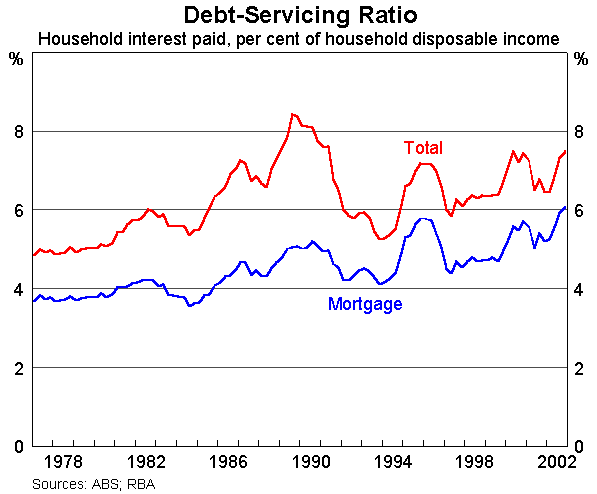
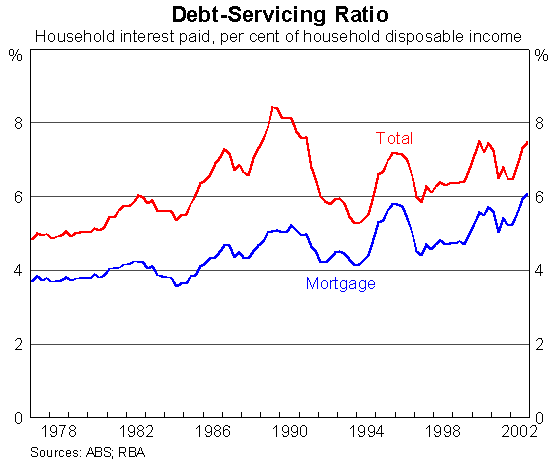
The most important financial ratio from the household perspective is the debt-servicing ratio – the ratio of interest payments to disposable income. Understanding the movements in this ratio is difficult, as shown in the appendix to this speech. Two measures of debt servicing are shown in Graph 3 – the bottom line shows only interest on mortgage debt and the top line adds in the interest on all other household borrowing. Both lines show a gradual upward trend, although their cyclical movements differ.
By 2002, the debt-servicing ratio on mortgages had reached 6 per cent of household income, while total debt servicing reached 7½ per cent. If we were to add the required repayment of principal on to this line, there would be a larger tendency for the line to slope upwards. Our estimate is that households currently pay about 2½ per cent of income in required principal repayment, which brings their total debt servicing to 10 per cent of disposable income.
These aggregate ratios sound quite low, but we should recognise that they are held down because they include all those households which have no debt. When we adjust for this, our estimate is that for households with housing debt, the total servicing payment (interest plus required payment of principal) averages 20 per cent of disposable income, compared with about 14 per cent 10 years ago. Thus, although interest rates have trended downwards through the period covered by Graph 3, debt servicing has trended upwards. Households have increased their borrowing by more than interest rates have fallen, an outcome consistent with the developments discussed in the previous section.
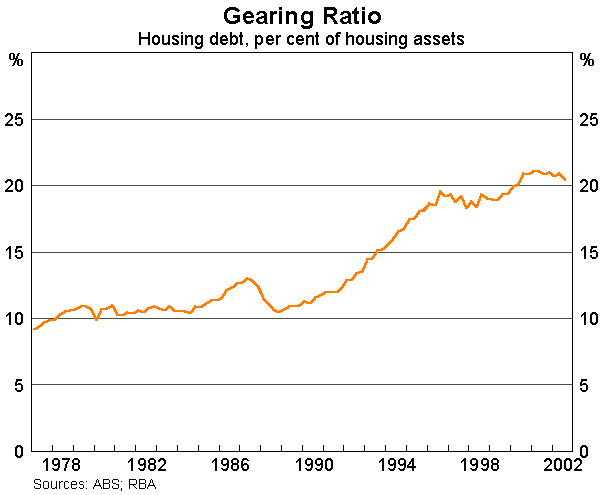
Another financial ratio that is important in order to evaluate risk is the gearing ratio, which is the ratio of the value of housing debt to the value of the stock of housing assets (Graph 4). In Australia this has risen over the past decade from 13 per cent to 20 per cent[5], and therefore means that households as a whole have increased their risk. But most households hold no housing debt, so the average gearing ratio for those that do is about 43 per cent.
One other fact that we can deduce is that the average gearing ratio for investors has risen a lot faster than for owner-occupiers over the past decade, although the level is not as high. It appears that there are two main classes of owners of investment properties: those that wish to live off the rental income and therefore hold little or no debt; and those that are mainly concerned with capital appreciation and tax minimisation and therefore aim for a high level of debt. Over the past decade, the sharp rise in the gearing ratio suggests that the second group have expanded a lot faster than the first.
Response to shocks
I would now like to return to the question of whether the rise in household debt will result in a reaction which will be disruptive to the economy. Some commentators have suggested that the debt to income ratio is now so high that it is unsustainable. If they mean by this that it will start to fall under its own weight, I think that this outcome is very unlikely. It is far more likely that the ratio will continue to rise for some time, even if more slowly. For a start, the effects of the lower interest rates and lower inflation have not yet fully worked their way through the system and, additionally, it is likely that over time more households will take advantage of the newer and more flexible debt products now on offer.
A more fruitful approach to analysing the effects on the economy of the higher household debt level is to ask how it will affect the response to economic shocks. In other words, how differently will a ‘high household debt’ economy behave in the face of some temporary adversity compared with a ‘low household debt’ economy? Is it more likely now, for example, that an adverse shock to the economy will mean more households are forced into selling their homes, or having their banks foreclose on their mortgages? This is the sort of scenario which we would all dread because it would impart a sharp contractionary force to the economy.
In principle, this could happen if the shock in question was a deep enough recession accompanied by a large enough rise in unemployment. If someone loses their job altogether or is forced to accept one at a much lower income, they may not be able to meet their debt-servicing obligations. However, the crucial variable here is the debt-servicing ratio – it is this which determines whether a household can keep its property when there is an interruption to its cash flow, not the absolute level of debt (or the debt to income ratio). And we know that the debt-servicing ratio has risen moderately – from about 14 per cent to 20 per cent. So our judgement would be that although the incidence of this type of extreme reaction would increase, it would not increase by a lot.
Even if we judge that the incidence of this extreme reaction will still be relatively low, are there other forms of behaviour which are likely to have changed as a result of the higher debt-servicing ratio and higher gearing among indebted households? In other words, are households that can afford to meet their debt-servicing requirement likely to change their behaviour in other ways now that they have a higher debt level than formerly? It seems to me that the answer to this is yes. Households are bound to become more cautious if the prospect of an economic downturn increases, and this would show up as weaker consumption and a rise in precautionary savings. Thus, as a general conclusion, we should assume that consumption will become more sensitive to economic conditions.
A related aspect is that it is often said that consumption is now more sensitive to a change in monetary policy. This is clearly true if we define a change in monetary policy as a given absolute rise in interest rates, say 50 basis points. Obviously, if households have more debt, a rise in interest rates will affect them more than if they had less, and so income after mortgage payments would fall more, and so would consumption. This has not gone unnoticed, and at the Reserve Bank we are aware that the heightening sensitivity of consumption means that to achieve a given change in the economy, a smaller change in interest rates will be required.
What about the response to falling house prices? For those households that could afford to meet their debt-servicing obligations, one would have to assume that they would continue to do so, regardless of the fact that the price of their house was falling. Even in the extreme circumstance where the price fell below the debt level – referred to as negative equity – it is likely that owner-occupiers would endure the situation stoically because there would be little alternative. Again, the higher the gearing, the more their wealth would be affected and the more cautious they would become in their consumption spending. The behaviour of investors in this situation, however, could be quite different to owner-occupiers in that there would be a strong temptation to get rid of the troublesome investment, especially if the fall in price was caused by a difficulty in finding tenants. So for investors, there could be a flow-on from falling housing prices to increased selling pressure and hence further downward pressure on housing prices.
Another channel through which the increased sensitivity of consumption could work is the phenomenon of housing equity injection/withdrawal. As we have seen, in the good times households can augment their consumption by effectively tapping into the increased equity in their homes (housing equity withdrawal). But if they become apprehensive about their economic prospects, they could easily cease this activity or go back to the old pattern of equity injection, which would involve reducing consumption. There is evidence from the United Kingdom that such a switch occurs when house prices fall.
Apart from the heightened sensitivity of consumption, are there other risks that we have overlooked? In particular, are there risks to the lenders as well as to borrowers, and hence a possibility of some sort of financial crisis due to failure of financial institutions? Obviously, if the shock was large enough, we could not rule this out, but my guess is that it is highly unlikely. Throughout our work on household debt, we have assumed that lending standards of financial institutions, as typified by maximum debt-service ratios, have not been relaxed. This might be an over-simplification but, if it is, it is not a large one.[6] I know APRA have been looking at this situation closely and have been subjecting banks to stress tests based on quite onerous scenarios – for example, a 25 per cent fall in house prices. Even under these extreme assumptions, even though bad debts rise markedly and there would be a lot of personal distress, it is very hard to conclude that there would be large-scale financial failure.
Conclusions
Although I started with the intention of keeping my talk simple, I am afraid that the subject matter ended up being far more technical than I thought. I will therefore attempt to compensate for this by keeping the conclusions as simple as possible.
There is one important factor that should give us some reassurance about the large increase in household debt. That is, most of the increase was due to the halving in the mortgage rate and the inflation rate as we moved from the 1980s to the 1990s. If this was all that was at work, I would be comfortable, given the greater stability in interest rates, in concluding that there had not been a significant increase in the risk profile of the household sector.
But other factors have also been at work, and I cannot help but think they are the result of the over-confidence that follows the experience of a strong and sustained economic expansion. Much as I think the expansion has a good deal further to run, I suspect that a significant number of households have chosen a debt level which makes sense in good times, but does not take into account the fact that bad times inevitably will occur at some time or other.
The other factors that have been at work show up as a modest rise in the aggregate debt-servicing ratio and a similar rise in the aggregate gearing ratio. These are not because the maximum risk a typical household faces during its life cycle is larger than it formerly was, but because many more households are now staying at or near their maximum risk position for a longer period. The other development that has clearly increased risk is the exceptionally fast increase in borrowing for residential property for investment purposes, and the accompanying rapid expansion in apartment building, which show all the signs of a seriously over-extended market.
As far as we can judge at this stage, the rise in household debt does not pose a significant danger of a financial crisis, i.e. the failure of significant financial institutions such as occurred in the early 1990s after the build-up in corporate debt. But it does suggest that household consumption will be a lot more sensitive to economic conditions than hitherto. Thus, we should expect a more pronounced cutback in consumption if adverse economic conditions occur. This increased sensitivity also has implications for monetary policy, a development we have been aware of for some time.
At present, there are some tentative signs that both household borrowing and residential property development may be levelling out. There is no doubt that those developments, followed by a further scaling back, would be in the longer-term interest of the Australian economy.
Endnotes
See ‘Recent Developments in Housing: Prices, Finance and Investor Attitudes, RBA Bulletin, July 2002, ‘Innovations in the Provision of Finance for Investor Housing’, RBA Bulletin, December 2002, ‘Housing Equity Withdrawal’, RBA Bulletin, February 2003, and ‘Household Debt: What the Data Show’, RBA Bulletin, March 2003. [1]
See RBA Bulletin, March 2003, op cit. In principle, this would not be completed until the last loan taken out before the fall in interest rates was paid off, i.e. 25 years. But in practice it would be a lot shorter because on average mortgages are paid out or refinanced well before maturity. [2]
Unfortunately, we have no detailed information on the distribution of household debt for investment housing. In what follows, we assume that investment properties are owned by households that already own or are paying off their owner-occupied property, i.e. renters do not own investment properties. [3]
See G.R. Stevens, ‘Some Observations on Low Inflation and Household Finances’, RBA Bulletin, October 1997. [4]
An alterative measure of gearing, the value of total household debt to total household assets (which includes equity holdings, superannuation, etc.), has risen from 10 per cent to 15 per cent over the same period. [5]
There is some anecdotal evidence of a small relaxation in lending standards in that the proportion of ‘high loan to valuation’ loans has risen somewhat, and the emergence of the non-conforming lenders has meant that some borrowers who could not meet the standards of the traditional lenders can now obtain housing loans. [6]
Appendix: Some Measurement Issues
Debt Servicing
One of the important aspects of any assessment of the sustainability of debt burdens is the extent of an economic entity's income which must be devoted to debt servicing. The measure used in this speech is the ratio of interest payments by households to household disposable income. This is derived from information in the national accounts, with some adjustments.[1]
The upper line in Graph A1 (the same as Graph 3 in the text) shows the resulting series. The notable feature of this series is that the peak value for debt servicing was in the period of high interest rates in the late 1980s. Subsequently, debt servicing costs declined sharply as interest rates fell. The effects of interest rate changes in the 1990s are visible as cyclical rises and falls in debt servicing, around a slowly rising trend, caused by the increase in debt levels.
The upward trend in debt servicing is clearer in the lower line in the graph, which shows the debt servicing requirement specifically for housing debt. Currently, about 6 per cent of household disposable income is devoted to servicing the interest cost of mortgages. This is higher by about 1 percentage point than the peak value in 1990, despite the much lower level of mortgage interest rates, because the size of mortgage debt outstanding is now so much higher. Allowing for principal repayments as well as interest would increase this by about 2½ percentage points, an amount which is likely to be larger now than in the past because of the higher levels of debt.
The fact that total interest servicing costs – i.e. those for mortgages and other loans – were so high in 1990, so that the divergence between these two lines is greatest at that time, reflects two factors. First, personal loans were a much larger share of total household debt at that time than they are now. Second, the average rate of interest on personal loans is usually higher than for mortgages, and they rose much more in the late 1980s than did mortgage rates.
Both these series represent averages across the household sector. But experience differs markedly between households. Slightly less than 30 per cent of households have an outstanding mortgage against their own house; about 40 per cent of households have no mortgage debt on the dwelling they own. These proportions are little changed from a decade ago. Based on data from the Australian Bureau of Statistics (ABS) and the Australian Taxation Office, the proportion of households owning investment properties is around 8 to 10 per cent. Some, though not all, of these properties are partly debt financed. Taking these facts into account, and allowing for the fact that households with debt have, on average, incomes about 30 per cent higher than the average for all households, interest and principal repayments probably account for something like 20 per cent of disposable income among those households who have debt. This has most likely increased by about 6 percentage points over the past decade.
In summary, a closer analysis of debt servicing requirements suggests that the commonly quoted fact that the total interest servicing cost is less than in the late-1980s peak obscures the fact that debt servicing costs are on an upward trend – which only stands to reason given that overall debt levels are rising. Further, servicing costs of those households with debt are considerably higher than indicated by the average experience across the household sector, and have risen a good deal over the past ten years.
Gearing Ratios
Turning to consideration of housing leverage – that is, the ratio of housing debt to the value of housing assets – Graph 4 in the speech showed that leverage had risen from about 13 per cent to about 20 per cent over the past decade. However, again this is the average across all households, including the majority of households who carry no debt at all. Arguably a more relevant measure is the leverage of those households which do carry debt – namely, owner occupiers with a mortgage still outstanding, and investors.
Some estimation is involved here because the relevant data are not directly observable. On the assumption that the 30 per cent of households with debt against their homes also own 30 per cent of housing assets, we estimate that the ratio of debt to assets for indebted owner occupiers is about 46 per cent, up from 36 per cent ten years earlier. Among investors, the rise in leverage appears to have been steeper, though from a lower starting point. In 2002, it is estimated that investors had debt equivalent to 36 per cent of assets, compared with 16 per cent ten years earlier.
| 1992 | 2002 | % increase | |
|---|---|---|---|
| Owner-occupiers | 35.9 | 46.1 | 28.3 |
| Investors | 15.6 | 36.1 | 132.0 |
Endnotes
Two adjustments have been made to the data published in the national accounts to arrive at the interest paid data used here. First, unlike the published national accounts data, the figures here are not measured net of Financial Intermediation Services Indirectly Measured (‘FISIM’), which treats some interest as payment for the financial intermediation services supplied to households which are not explicitly paid for by fees. In assessing the actual interest payments made by borrowers for the purposes at hand, gross interest payments are of more interest. Second, the published data show a level of interest expenses in the recent past which seems too low relative to what is implied by the level of debt and prevailing interest rates, both of which are fairly readily observable. From the December quarter 2000, the figures here use RBA staff estimates which vary the implied interest rate in line with the cash rate. [1]