Speech Some General Observations on the Kangaroo Bond Market

Chris Ryan
[1]
Head of Domestic Markets Department
Address to the ‘Kangaroos: Positioned For Growth’ Conference
Sydney –
1. Broad developments in the Australian bond market
I think it is useful to start this presentation with a reminder of the broad developments in the Australian bond market over the past 15 or so years (Graph 1).
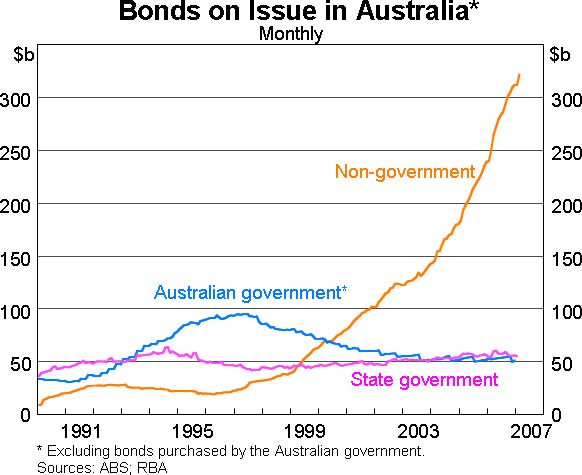
As is well known, the stock of Commonwealth Government Securities (CGS) rose rapidly in the early 1990s, peaked in 1997 and then fell until 2003. In response to concerns that further falls in the stock of CGS might be harmful for financial markets, the Government announced that it would maintain the viability of the CGS market, especially the futures contracts used to manage interest rate risk.
Throughout this period, the stock of bonds issued in Australia by the state borrowing authorities (‘semis’) has been relatively stable. In contrast, the stock of bonds issued in Australia by all other entities began growing rapidly around the time the CGS market peaked. Currently, the stock of such bonds exceeds $300 billion – around three times the combined stock of CGS and semis.
2. Why the strength in non-CGS/semi issuance?
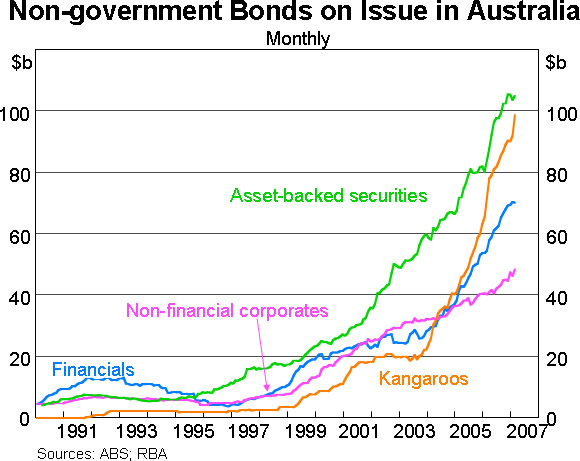
The strength in non-CGS/semi issuance reflects both supply and demand factors. For Australian issuers, the supply side factors revolve around the strong growth in credit and changes in the savings behaviour of Australian households (Graph 2).
Banks' lending for housing has grown rapidly. This reflects both a fall in mortgage rates due to lower inflation and increased competition, and good economic conditions. Growth in their lending to the corporate sector has been less rapid, but nonetheless solid. After a long period of de-leveraging in the early to mid 1990s, the corporate sector became more willing to undertake debt-financed expansion.
Increasingly, banks have funded all this lending via recourse to wholesale markets, including both local and offshore issuance of bonds and asset-backed securities. In part, this is because household savings have shifted from retail deposits towards funds management vehicles, especially superannuation.
Mortgage originators have been significant participants in the increase in housing debt and they have funded their lending almost entirely by residential mortgage-backed securities (RMBS). RMBS still makes up around three-quarters of asset-backed securities outstanding in Australia.
As noted above, non-financial corporates have increased their borrowings from banks. But they have also increased their own bond issuance.
Demand influences, for both Australian and Kangaroo issuers, have included: the growth in funds under management; the global trend of increased cross-border portfolio investment, from which a relatively small country like Australia can benefit substantially; the shift to low inflation, which has boosted demand for fixed-interest bonds; and the decline in CGS, which has boosted demand for AAA-rated bonds.
Given all this, it is not surprising that non-CGS/semi issuance in Australia has grown rapidly. But it doesn't really explain why, from the late 1990s and especially from late 2003, Kangaroo issuance has grown particularly rapidly (Graph 3).
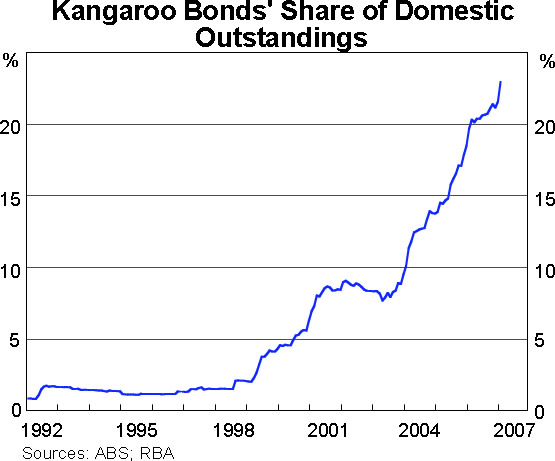
Kangaroo bonds' share of the total stock of domestic bonds, including CGS and semis, has risen from around 2 per cent during most of the 1990s to more than 20 per cent.
3. Why the particular strength in Kangaroo bonds?
There are several possible reasons for the particular strength in Kangaroo bonds:
- the decline in CGS;
- diversification and cross-border portfolio investment; and
- the associated development of the swap market.
(i) The decline in CGS
The decline in CGS, in absolute terms and then in relative terms, may have benefited Kangaroo issuance more than local issuance, but it is not likely to be the main explanation for Kangaroo bonds' increased share of total outstandings.
First, the timing and magnitudes do not sit together very well: the stock of Kangaroo bonds did not pick up sharply until around the time the stock of CGS levelled out, rather than earlier on when CGS were falling; and the rise in Kangaroo bonds greatly exceeds the fall in CGS.
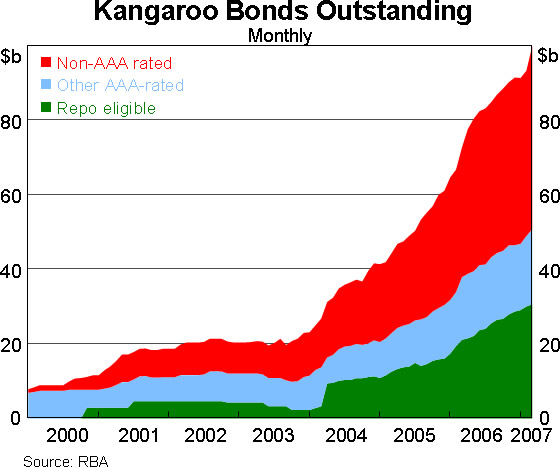
Second, Kangaroo bonds that can be considered a close substitute for CGS – that is, bonds that can be used as collateral in repurchase agreements (repo) with the RBA – are responsible for no more than a third of the absolute increase in Kangaroo bonds since the beginning of 2003 (Graph 4).
As an aside, it is interesting to note that a disproportionately low share of repo-eligible Kangaroo bonds are held by the RBA as a result of its market operations. That is, repo-eligible Kangaroo bonds' share of the RBA's ‘general collateral’ repo book, which also includes CGS and semis, is less than their share of all general collateral. This suggests that repo eligibility is sought for reasons other than liquidity enhancement. Consistent with this, total repo activity in these bonds appears to be very low.
Kangaroo bonds that can be considered a fairly close substitute for CGS, namely other AAA-rated Kangaroo bonds, have not grown strongly. As a result, the share of all AAA-rated Kangaroo bonds, repo-eligible or otherwise, in total Kangaroo issuance has remained around 50 per cent since 2003.
(ii) Diversification and cross-border portfolio investment
A second possible explanation for the relatively rapid growth of the Kangaroo market concerns diversification and cross-border portfolio investment.
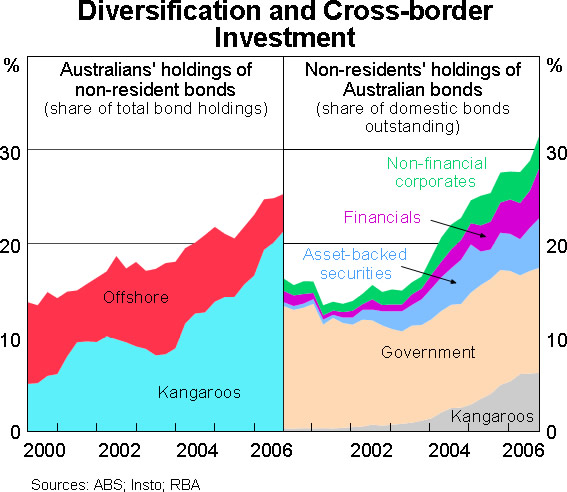
Australian investors' holdings of bonds issued by non-residents, as a share of their total bond holdings, have risen from around 15 per cent to 25 per cent since 2000 (Graph 5). More than all of this increase has been accounted for by Kangaroo bonds. Australian investors have clearly wanted to diversify their exposures but have wanted to stay with relatively high-yielding A$ assets.
At the same time, non-residents' holdings of bonds issued in Australia have risen from around 15 per cent to 30 per cent of local outstandings. Around a third of this increase has been accounted for by Kangaroo bonds. Government bonds have continued to represent a large share of their holdings, despite the contraction in the CGS market. Evidently, foreign investors have wanted to diversify their exposures and acquire relatively high-yielding assets. But generally speaking they have not wanted to combine exchange rate risk with a great deal of credit risk.
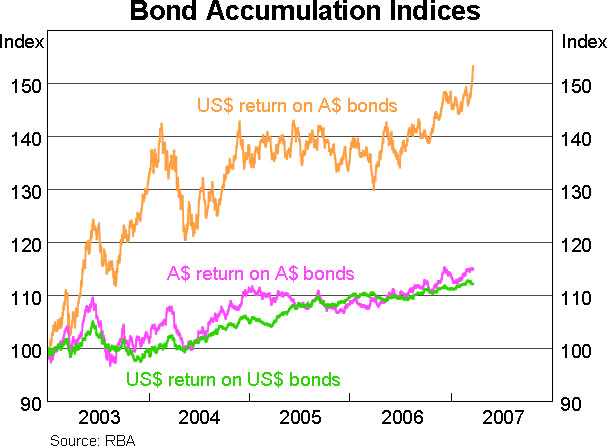
Some might object to the emphasis on high yields as a driving force on the grounds that such yields are associated with an expectation of exchange rate depreciation. That is, when adjusted for exchange rate risk, high-yielding securities are not particularly attractive. But over significant time periods – including recent years – exchange rate movements have tended to increase the total return on high-yielding securities such as Australian bonds (Graph 6).
A comparison of accumulation indices from 2003 onwards for a sample – albeit very small – of Kangaroo bonds and bonds issued in other currencies by the same entities suggests that the A$ returns on Kangaroo bonds have been only slightly higher than the US$ returns on the same entities' US$ bonds. This is because higher coupons have been roughly offset by a bigger rise in yields (i.e. capital loss) over the period. But the US$ returns on the Kangaroo bonds have been much higher, reflecting A$ strength during this particular period.
(iii) The swap market
Of course, the issuers of Kangaroo bonds would have been on the wrong end of these exchange rate movements had they not hedged their exposure. This is part of the reason why the development of the swap market has been very important.
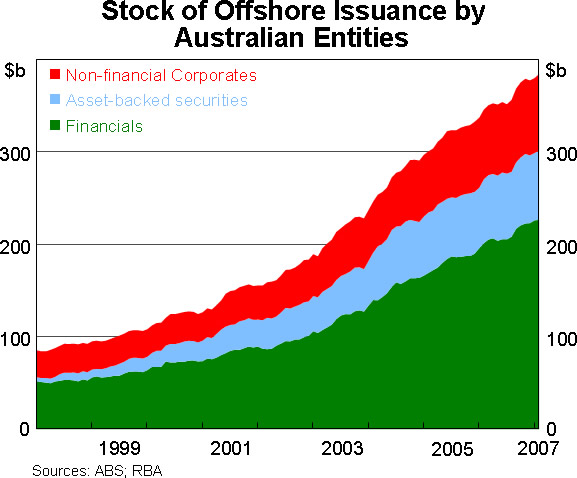
Australian non-government entities' outstandings of offshore bonds have grown almost as rapidly as their domestic outstandings (Graph 7). The A$ face value of these bonds is currently $380 billion, which exceeds their domestic outstandings. The A$ face value is a legitimate measure of these outstandings if all the proceeds have been swapped back to A$, and the available evidence suggests this is largely true. According to data from the Australian Bureau of Statistics, the proceeds of roughly 90 per cent of financial and asset-backed bonds, and around half of non-financials' bonds, are swapped back into A$.
At the same time, the A$ proceeds from Kangaroo issuance are invariably swapped out of A$. Mutually beneficial trade has been occurring, based on comparative advantage in currency issuance. As you know: offshore issuance has been cheaper for Australian entities when the spread to LIBOR they have paid overseas, plus the cross-currency basis swap premium they have paid to swap counterparties, has been less than the spread to swap they would have paid in Australia; and Kangaroo issuance has been cheaper for foreigners when the spread to swap they have paid in Australia, less the cross-currency basis swap premium they have received, has been less than the spread to LIBOR they would have paid overseas.
Before looking at these criteria in detail, let's look at several aspects of the swap market at the aggregate level (Graph 8).
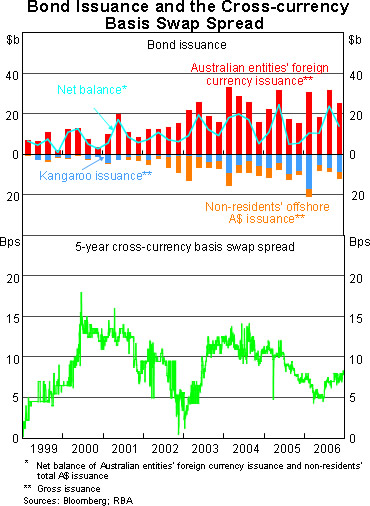
The first point to note is that Kangaroo issuance is far less than Australian offshore issuance. This does not follow immediately from us having a current account deficit – Australians could issue more bonds onshore and market them to foreign investors – but nonetheless it is not very surprising.[2] Even non-residents' total A$ issuance – that is, their Kangaroo and offshore A$ issuance combined – is almost always less than Australians' offshore issuance. This helps explain why the cross-currency basis swap spread, which equilibrates total demand and supply for A$ under swap, is typically positive.
Consistent with this, the spread tends to be more (or less) positive, the greater (or lower) the net balance of Australians' foreign currency and non-residents' A$ issuance. Sometimes the driving force is non-residents' A$ borrowing pushing down the cross-currency basis swap (for example, A$ issuance in Japan in 2002/03). Sometimes it is residents' offshore issuance pushing up the spread.
Either way, the reaction to these pressures on the swap spread tends to be quite quick. This is evidenced by the fact that non-residents' total A$ issuance tends to be positively correlated with Australians' offshore issuance. Not only does strong issuance in one currency push the cross-currency basis spread in favour of issuance in the other currency, the latter tends to pick up within the three month time intervals shown here.[3]
Now let's look in more detail at how cost effective it has been for Kangaroo issuers to issue in Australia and swap the proceeds into US$, rather than to raise US$ directly (Graph 9).
Each blue dot in this graph represents the US$ cost, as a spread to LIBOR, of issuing Kangaroo bonds at a particular point in time and swapping the A$ proceeds to US$. Each red dot represents the same group of issuers' cost of raising US$ directly, mostly via issuance in the US.
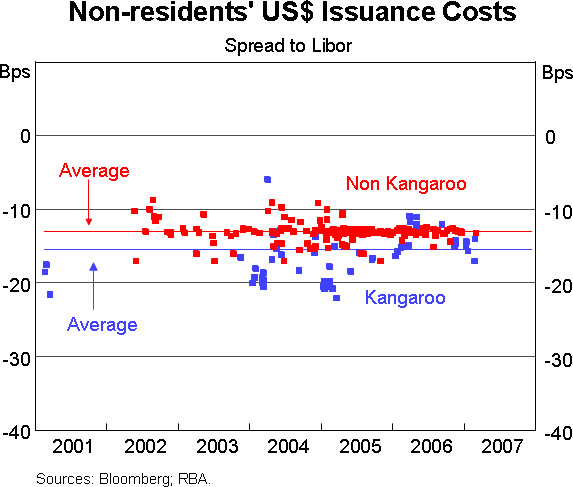
For this sample of AAA-rated issuers, the cost – excluding deal costs – of raising US$ via Kangaroo issuance has, on average, been slightly lower than the cost of raising US$ via issuance outside Australia.
As one would expect, Kangaroo issuance tends to occur when it is relatively cheap and tends not to occur when it is relatively expensive. But there are exceptions. Despite efforts to homogenise the issuances shown here, these exceptions may reflect variation across issuers, maturities and deal costs. They may also reflect longer-term cost considerations, such as the desirability of maintaining a presence in a particular market.
4. Are Kangaroo issuers shaped by what they do elsewhere or what the locals do in Australia?
The above analysis suggests Kangaroo issuance is often a cost effective means of raising desired currencies. But it leaves open the question of whether foreign issuers have had to modify their usual issuance characteristics when issuing Kangaroo bonds. If they have not, then it raises the question of whether they have influenced the characteristics of local issuance by Australian non-government entities.
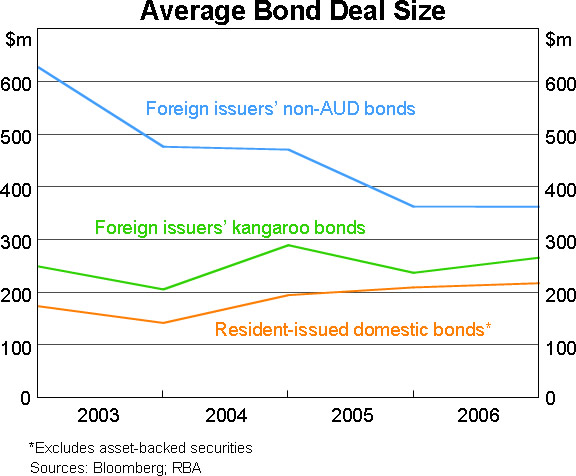
It is not surprising to find that Kangaroo deal sizes are slightly larger than local non-government issuers' deal sizes, but closer in size to local issuance than to their overseas issuance (Graph 10). It appears that, in this regard, Kangaroo issuers have offered some product differentiation but in the main have conformed reasonably closely to local standards. This is somewhat inevitable in a relatively small market.
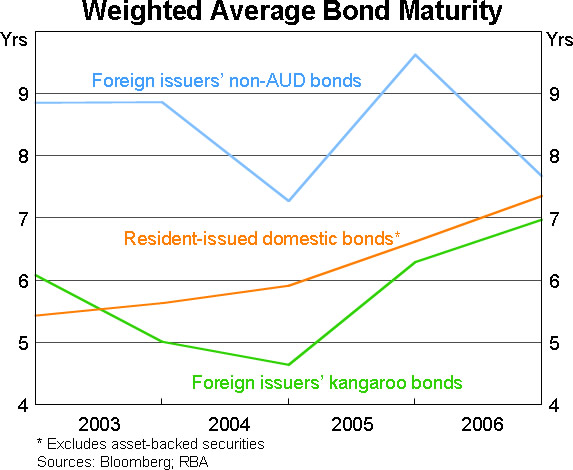
The opposite holds for maturities (Graph 11). Kangaroo bonds tend to be of shorter maturity than the bonds issued by local entities. This is despite the fact that the data for local issuers exclude CGS (and semis), which have relatively long maturities. Part of the explanation for this may be the existence of some very long-dated infrastructure bonds issued by local entities. Whatever the full explanation, it is quite good to observe a general lengthening of maturities in the Australian market.
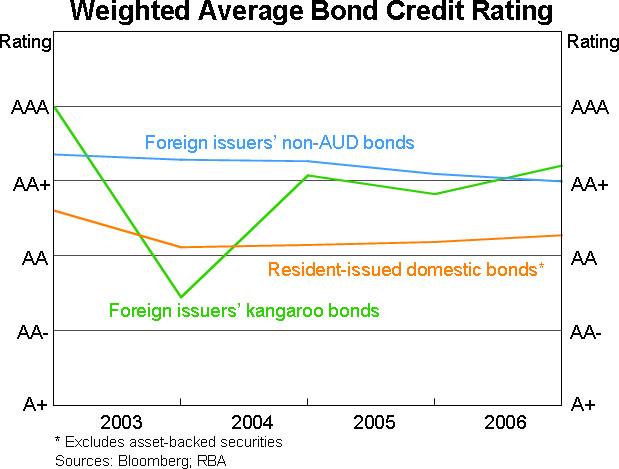
As for credit ratings, Kangaroo bonds generally have similar credit ratings to these issuers' overseas bonds, and higher ratings than local non-government bonds (Graph 12). This is largely because issuers have relatively little control over their rating here versus overseas, though at least some could make use of subordination or credit wrapping. Credit quality is mainly a question of demand and who has had the comparative advantage in issuing in A$.
5. Conclusions
There are some clearly identifiable factors behind the particular strength in the Kangaroo bond market in recent years. One of these is the relative decline in the CGS market. But this is unlikely to have been the main factor.
Another, and probably more important, factor has been the diversification and globalisation of bond markets. This has reflected the appeal to Australian investors of name diversification and the appeal to non-resident investors of high-yielding, generally high-quality A$ securities.
Helping to underpin this has been the development of the swap market. Kangaroo issuers have in effect paid US$ interest rates that, on average, have been very competitive with what they pay elsewhere. At the same time, Australian companies, particularly not very highly-rated companies, have often been able to pay lower A$ interest rates by issuing offshore rather than domestically. This counters any argument that the Kangaroo market might have crowded out Australian issuers.
Kangaroo issues have conformed reasonably closely to local deal size and maturities. There has, however, been some differentiation, and there may be more in the future as the market develops. Kangaroo's credit quality, compared with that of local private issuers, has been relatively high, but this is not a problem. It simply reflects the nature of domestic and foreign demand and comparative advantage in currency issuance.
Endnotes
Kangaroo bonds are A$-denominated bonds issued in Australia by non-residents. [1]
Australian offshore issuers can tap into well-developed distribution and marketing networks and be subject to legal and settlement requirements with which foreign investors will be more comfortable. [2]
This discussion is couched in terms of gross issuance by Australians and non-residents. The cross-currency basis swap tends to move more closely with the balance of net, rather than gross, issuance. However, issuance by Australians and non-residents tend to react to one another more strongly in gross, rather than net, terms. [3]