Speech Recent Developments in the Housing Market and its Financing

Luci Ellis
Head of Financial Stability Department
Financial
Review Residential Property Conference
2010
Sydney –
- Audio 13.52MB
I'd like to thank the AFR for the opportunity to speak to you today on a topic that many of us have found fascinating for most of our professional lives.
Housing is a big deal. It's the biggest purchase most of us will make. It's an asset class worth almost $4 trillion, accounting for around 60 per cent of household assets in Australia. Loans to buy property account for nearly 90 per cent of all household debt and around 40 per cent of the assets of Australian banks and other deposit-takers.
Housing prices have been rising quite quickly of late. A number of factors have been boosting housing demand, and supply has struggled to keep pace. Developments in housing markets can be important: global experience suggests that they can have both macroeconomic and financial stability consequences. Today I would like to talk about some of these developments, from both the macroeconomic and financial stability perspectives.
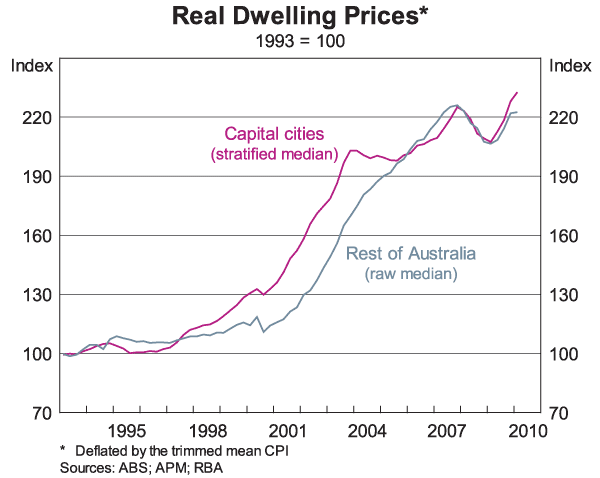
Housing prices in Australia have more than recovered their small decline of 2008. In the first three months of 2010, prices were growing quite smartly. In the major cities, they increased at an annual rate of between 12 and 15 per cent, depending on the measure. Even adjusting for inflation, housing prices have risen by roughly 12 per cent over the past year in the major cities, and by not much less in regional areas (Graph 1).
Demand-side Drivers
The most likely short-term drivers of this sharp recovery and momentum in housing markets are on the demand side. Government policy was supporting first-home buyers' capacity to pay for housing; interest rates were unusually low for a period; and unemployment did not rise as much as earlier feared.
Developments in housing finance have been somewhat at odds with this strength, though. Housing credit growth has been solid, but at 8½ per cent over the year to March, it is not running away. The number of new loan approvals for home purchase has been falling; in March, they were 16 per cent lower than their peak late last year. One reason for this divergence might be that there has been a change in the kinds of households in the market: more of the sales are at the high end, where more properties are bought for cash.
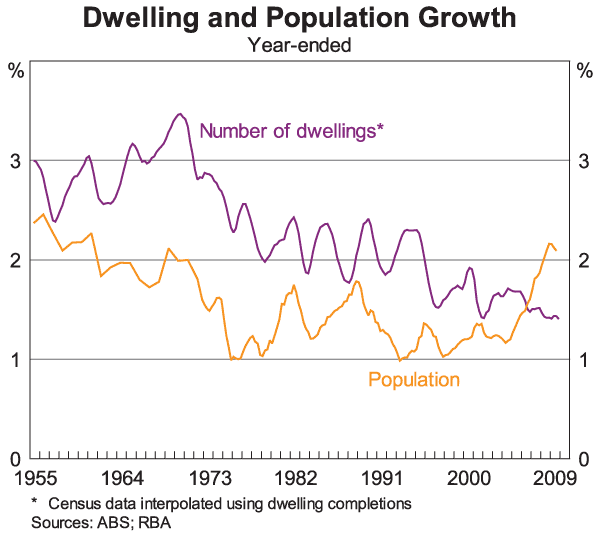
A more medium-term demand factor that has probably started to influence prices is the population (Graph 2). For a long time, the number of dwellings in Australia grew faster than the population did. This was necessary, since average household size was on a trend decline, initially because families were having fewer children, and more recently because there are more single-person households as the population ages. But population growth has picked up a lot, starting in around 2004. It is now running noticeably faster than growth in the dwelling stock.
The Role of the Supply Side
Together with these demand-side drivers, the supply side is important. The supply of housing is always going to be quite sluggish: most of it is already there. The additional amount of new supply is inherently small relative to the stock. On top of that, the supply of additional housing does not seem that responsive.[1] A number of factors are likely to be contributing to this. For example, it takes time to convert raw land to market-ready status. Many agencies have to coordinate their actions. And there are geographic limits to urban sprawl, especially since our major cities are all on coasts.
But whatever the causes, the ability to add to supply is falling short of this higher rate of population growth, despite some pick-up recently. Naturally that is putting upward pressure on housing prices. This factor may be more prominent in this cycle than in earlier ones, when easier credit conditions and other factors probably played a bigger role in boosting many individual households' demand for housing. In the current episode, by contrast, more of the extra demand is likely taking the form of demand for more dwellings, precisely because of the extra population growth.
The supply curve slopes up, and always has. This is not something that can be wished away. We shouldn't think that more flexible supply would prevent prices from rising whenever demand increased. But because population growth is now higher, it would be desirable for the supply of new dwellings to become more flexible than it has been to date, for a number of reasons. First, and most importantly, there is the simple fact that the extra people need somewhere to live. That is the core of the concerns about supply.
Second, there is the issue of the relative cost of shelter. If the number of dwellings does not expand, more of the adjustment must come as a higher cost of housing – both prices and rents.
Third, there is the issue of household finances. The more that housing prices rise, the more that some people might feel that they must stretch their finances to buy a home. And if household balance sheets were to become overstretched, household spending would become overly sensitive to income shocks. Such an outcome, if it occurred, would not be conducive to macroeconomic stability.
A further concern is that if too much of the response to faster population growth comes as faster growth in housing prices, this could be built into people's expectations. If price expectations become over-optimistic and encourage too much investor demand, the result could be disappointment – or worse. Again, such an outcome would not be helpful to ensuring macroeconomic stability.
The Financial Stability Perspective
Even if household balance sheets were to become overstretched to some extent, historical experience suggests that this, on its own, is unlikely to pose significant risk to Australia's financial system. Of course, the state of household balance sheets could weigh on consumption and exacerbate the business cycle. Lenders' loan losses would therefore be higher in any future recession than they otherwise would be. But the loan losses themselves and the painful deleveraging have historically occurred in the business sector, not directly in the household sector. In other words, taking a financial stability perspective, the state of household balance sheets and housing markets is not the most important issue for financial stability. And in the shorter term, housing is perhaps less important than it is from the perspective of macroeconomic management.
Compared with other kinds of credit, lending to households to finance the purchase of housing is relatively low risk. International banking regulations recognise this by applying lower risk weights to home mortgages than to small business loans, for example.
There are good reasons for this view. Historically, households have not normally been the instigators of financial instability. Aside from the current episode in the United States, financial crises are normally sparked by other sources. These include commercial property, property development, leveraged buyouts, sovereign debt and so on. As this graph shows, arrears rates on home mortgages usually only swing upwards significantly when unemployment has increased substantially (Graph 3). (The arrears numbers for Canada are much lower so the swing is harder to see, but the pattern is the same.) That is, something else has to go wrong in the economy first, before one sees a big rise in home loan arrears and loan losses.
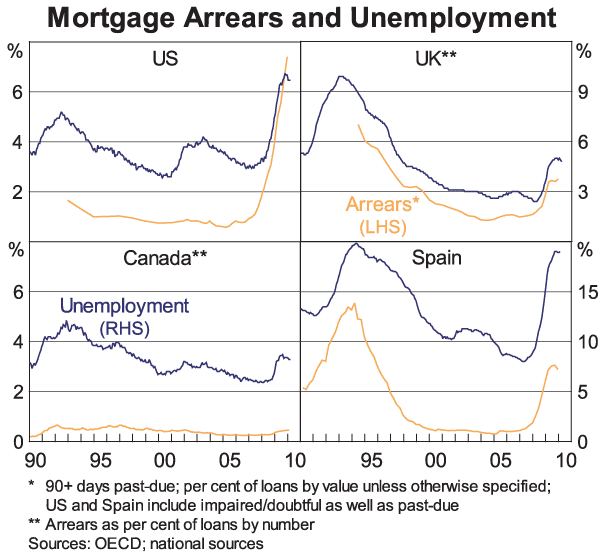
The exception to this pattern is, of course, the United States in the recent episode. There, arrears rates on home loans started to rise in 2006. That was more than a year before the unemployment rate did.
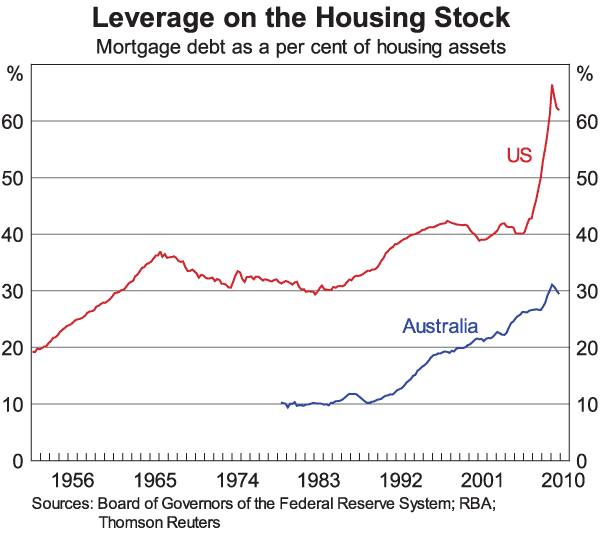
As we noted in the most recent Financial Stability Review released in March, Australian housing debt is higher relative to housing assets now than in the past (Graph 4). We should expect this ratio to be higher than in the 1970s and 1980s. The financial regulation of that period artificially restricted household borrowing. For example, unmarried women found it hard get mortgages back then. The question is whether this measure of leverage is higher than can be sustained. After all, it is much lower than in the United States, even before their boom-bust cycle. But we should expect that to be true. Because they can claim home mortgage interest against their tax, American owner-occupiers have less incentive to pay their debt down than their Australian counterparts.
A Disaggregated View
But these aggregated figures do not tell us much about the minority of households that pose the greatest risk. Undiscriminating use of aggregated statistics can in fact be quite misleading in financial stability analysis. We must also look at more disaggregated information, such as from household surveys. These provide many useful insights, even if they are not very timely.
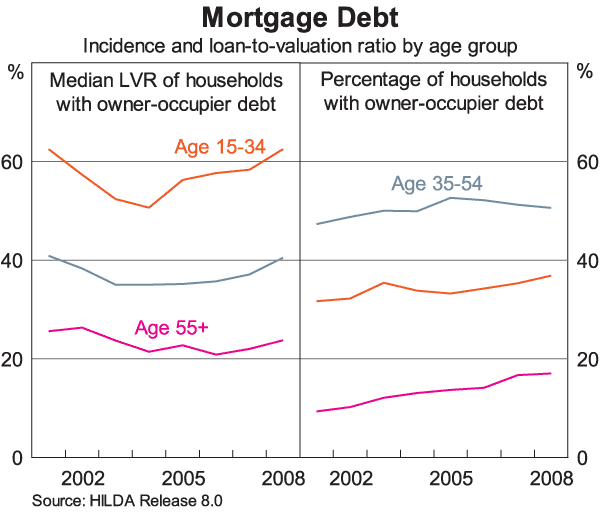
One source of disaggregated data is the HILDA survey, which has tracked a sample of Australian households for nearly a decade now. It asks home-owners how much they think their home is worth, and how much debt they hold against it. From this information we can calculate an estimated loan-to-valuation ratio for each home-owner. It's not a perfect measure, but it samples all home-owners, not just people who have recently taken out a new loan.
As this graph shows, by this measure, loan-to-valuation ratios have risen in recent years (Graph 5). But they are only back to the levels reported by households in the same age groups at the beginning of the decade. This might at first seem at odds with the aggregate data I showed in the previous graph, with household debt expanding faster than assets.
What has happened is that fewer people own their homes outright. Specifically, fewer households bought their homes without debt, especially amongst the over-55s age group. More households in this age group have mortgages now than in the past. It is not clear if that's because they are not paying their original debt down as fast, or because they are not trading down as far as they used to. Either way, our assessment is that the increase in debt has broadly been concentrated in the hands of those generally more able to service it.
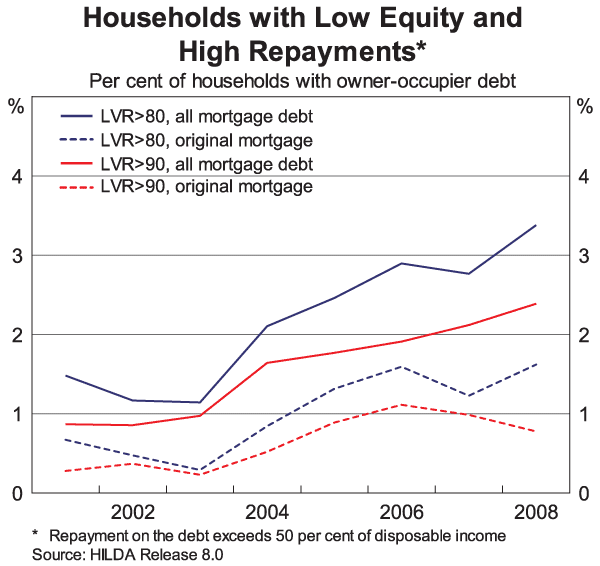
If we focus on the group of households with debt that have high repayment burdens and high loan-to-valuation ratios, we can see that their numbers have risen over time (Graph 6). But the overall percentage has remained very low. This was true even in late 2008, the latest available data, when mortgage interest rates, and thus repayments, were at their peak.
The Key Role of Lending Standards
If this relatively benign picture is to continue, one crucial precondition is that lending standards in the mortgage market remain prudent. Past experience has clearly shown that in the long run, you don't improve housing affordability by easing lending standards. That just gets capitalised in the price.
In fact, easing mortgage lending standards too far can be outright damaging to long-run affordability. This has been amply demonstrated in the recent United States housing meltdown. There, the boom phase around the middle of the decade drew out a multitude of so-called affordability products. These were designed to help households purchase ever-more expensive homes. They included sub-prime loans, of course, but also a plethora of no-deposit, no-documentation, teaser-rate and negative amortisation products not seen in other countries. So households could borrow more, but this just helped to boost housing prices further. During the boom, sub-prime lending was seen as a way of getting people into home ownership. But it had the added advantage that it could siphon some mortgage business away from the government-sponsored enterprises that dominated the US industry. It was therefore thought that sub-prime lending would reduce systemic risk in the mortgage market. But as millions of American households lose their homes to foreclosure, and the owner-occupation rate declines to rates last seen in the mid 1990s, it would seem that they are worse off from this experiment. Sub-prime lenders could be seen as the cane toads of the US mortgage market: they were designed to battle one problem, but they created a bigger problem.
In Australia, lending standards never eased that far, and conditions never got that grim. Some newer data that APRA have been collecting can help shed some light on mortgage lending standards here (Graph 7). As you can see, only a minority of recent home loan borrowers started with a loan-to-valuation ratio above 90 per cent. The fraction of owner-occupiers with high loan-to-valuation ratios increased during the period when grants to first-home buyers were increased; these buyers normally have smaller deposits than existing home owners who are moving, and they accounted for a larger share of new loans in that period. We have been carefully watching lending standards in the first-home buyer market segment. First-home buyers have long faced greater risk than more established home owners who have more equity in their home. But as far as the data allow us to tell, recent new loans to first-home buyers look quite like those made to previous cohorts of first-home buyers.
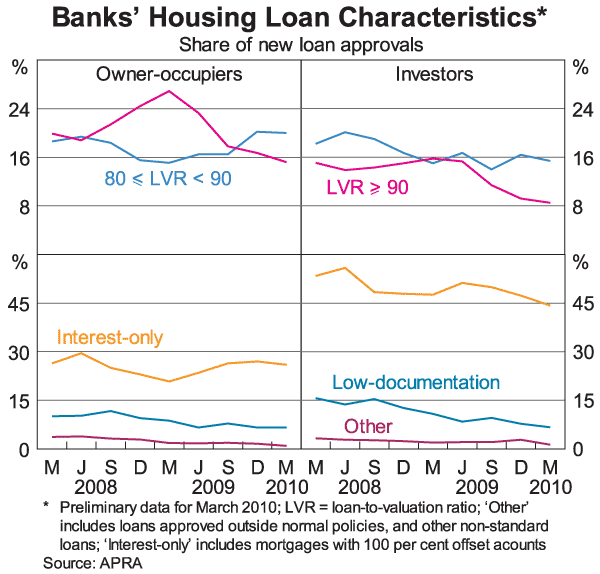
Indeed, across the mortgage market as a whole, lending standards are a little tighter than they were a couple of years ago. Banks and other deposit-takers have gained market share relative to non-bank lenders that tended to offer less conservative mortgage products. And as the graph shows, the banks themselves now have a more conservative profile in their lending than previously. Some lenders have reduced the maximum loan-to-valuation ratio they will offer for certain customers. The fraction of new loans with low documentation is lower now than even two years ago, both for owner-occupiers and investors. And although the share of interest-only owner-occupier loans has largely reversed its earlier dip, most of these are actually loans with offset accounts, which people use to pay their loan down faster.
Final Thoughts
To conclude, housing prices have been under upward pressure in Australia. The nature of the demand shock Australia faces means that it would be helpful if more of that demand could be accommodated with extra homes for occupation, instead of by higher prices. Some of that pick-up in construction does seem to be happening.
Every cycle starts with something real, something fundamental. Recent data suggest that we do not have a credit-fuelled speculative boom on our hands. It would not be desirable for the current situation to turn into one. It will therefore be important for lenders to remain prudent in their standards. It will be equally important for prospective borrowers to have realistic expectations, and not to rely on a hoped-for capital gain in order to service their debts.
Thank you.
Endnote
Earlier work suggests supply of new housing in Australia has historically been a bit more sluggish than in the United States and Canada, but more flexible than in the United Kingdom. See Berger-Thompson L and L Ellis (2004), ‘Housing Construction Cycles and Interest Rates’, RBA Research Discussion Paper No 2004-08. [1]