Speech Cyclical and Structural Changes in the Labour Market

Christopher Kent
[*]
Assistant Governor (Economic)
Address on Labour Market Developments, hosted by The Wall Street Journal
Sydney –
- Audio 23.64MB
- Q&A Transcript
I appreciate the opportunity to talk to you today about some key cyclical and structural forces affecting the Australian labour market over recent years. Not surprisingly, we spend considerable time and effort at the Bank trying to understand labour market developments given their relevance to both unemployment and inflation.
Developments over the Past Couple of Years
Over recent months, labour market conditions have shown some signs of improvement. Following only very modest growth last year, employment has grown by almost 0.9 per cent so far this year. The unemployment rate ticked down a few months ago and the participation rate appears to have stabilised somewhat, after a significant decline through 2013. These improvements appear consistent with some signs of better growth in economic activity, although I'll come back to this point in a few minutes.[1]
Despite these improvements, there is still a fair degree of spare capacity in the labour market. This is apparent across a number of dimensions (Graph 1):
- the unemployment rate is high relative to its recent history
- the participation rate is around the lowest it's been over the past eight years
- there's been a significant decline in the ratio of employment to the working-age population since 2010
- wage growth has declined, to be well below its average of the past decade.
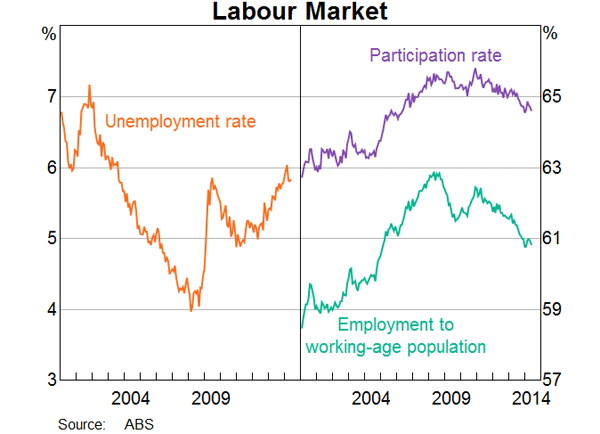
My plan today is to discuss some of the key forces at play that have led the labour market to this point, and think about prospects for the future.
Demand and Supply: What's Driving Labour Market Developments?
Like all markets, developments in the labour market reflect the interplay of demand and supply. These determine outcomes in terms of quantities (such as employment) and prices (namely wages). There are three key developments that help to explain the dynamics over the past few years:
- First, over that period there has been a weakening in the growth of labour demand, reflecting the decline in mining investment and the still weak state of overall demand across the non-mining economy.
- Second, there's been a decline in the growth of labour supply, some of which reflects a cyclical ‘discouraged worker’ effect, but the ageing of the population is also a significant and enduring influence.
- Third, wages are adjusting to the degree of spare capacity in the labour market. Moreover, slower growth of wages is playing a part in the real exchange rate adjustment that is required as the terms of trade and mining investment decline.
To a large extent, these developments reflect an unwinding of some of the adjustment that was seen over the period when commodity prices were rising and the mining boom was in the midst of its investment phase. As my colleagues and I have noted elsewhere, that period saw a significant appreciation of the nominal and real exchange rates, alongside relatively strong growth in both employment and wages – particularly for mining and mining-related activities.[2] These changes are now working in reverse, with the nominal exchange rate and growth of wages lower than they had been. Both are helpful parts of the necessary adjustment process. Monetary policy is also playing its role by providing support to demand.
Labour Demand: The Transition Away from Mining-led Growth
In large part, subdued growth of labour demand over the past couple of years has reflected below-trend growth in output over much of that period. The economy has been facing various headwinds over that time, including: the decline in the terms of trade; the decline in mining investment; the high level of the exchange rate; and weak growth of public demand.
The demand for labour can be thought of as being derived from the demand for the goods and services it helps to produce. So it is not surprising that employment growth weakened and the unemployment rate turned up from around the middle of 2012. That corresponded to a noticeable slowing in the growth of economic activity, which remained relatively subdued, at least up until late 2013 (Graph 2). In turn, much of that owes to the decline in mining investment. Meanwhile, growth of activity in the non-mining economy was subdued through that period, but it picked up slightly from late last year. That modest pick-up may have contributed, at least in part, to improved employment growth over the past few months. It may also be that some of that improvement reflects a ‘catching-up’ of employment growth after only very modest growth through 2013.
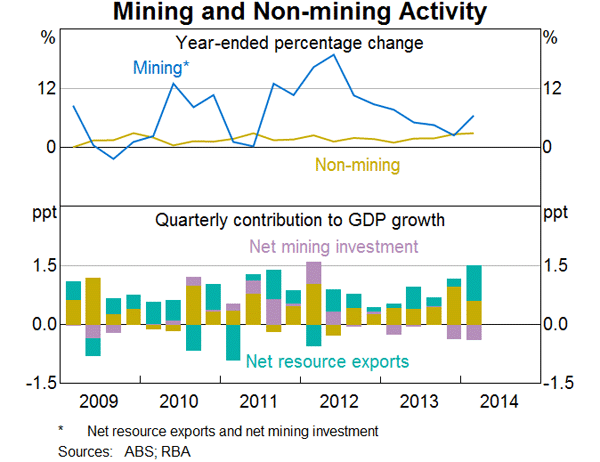
GDP growth lifted noticeably around the turn of this year – and was running at a bit above trend over the year to the March quarter 2014. But much of that owed to a very strong contribution from the production and export of resources, which does not draw on much labour. The strength of resource production of late partly reflects an improvement in labour productivity in the mining sector, which is to be expected as new productive capacity comes on line.
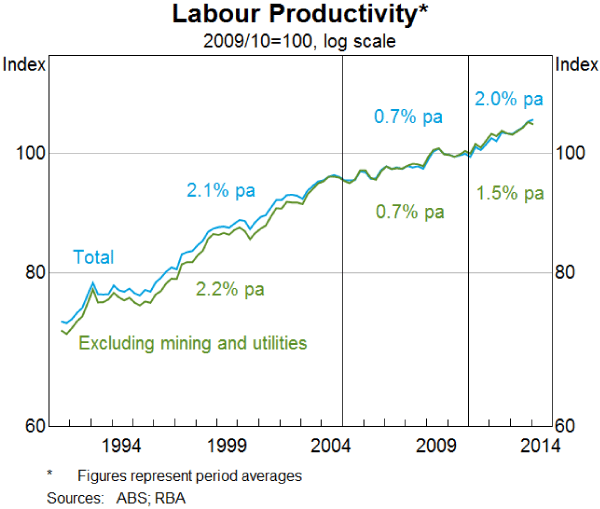
However, measured labour productivity growth has improved over the past few years across a broader range of industries, following a period of quite weak growth (Graph 3). If this can be sustained, it would be a very positive development, including for employees who will in time benefit through sustainable gains in their earnings. Over the past couple of years, it has meant that the growth in output that we've seen has been achieved with relatively moderate growth in employment. Outside of the mining sector, the general improvement in productivity growth may have been in response to a range of competitive pressures coming to bear during a period of weak growth of aggregate demand. The still high level of the exchange rate is one such competitive pressure.
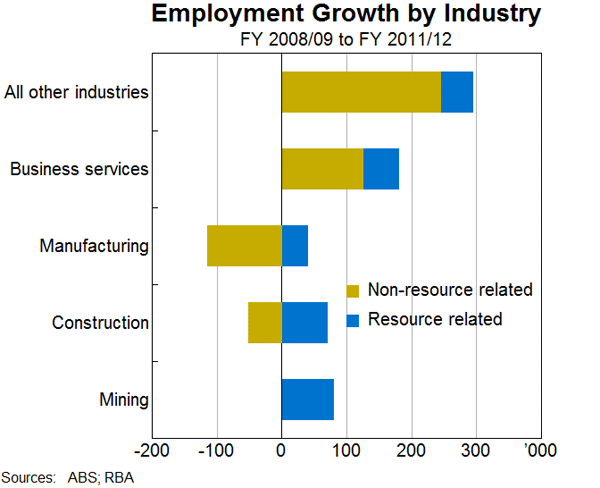
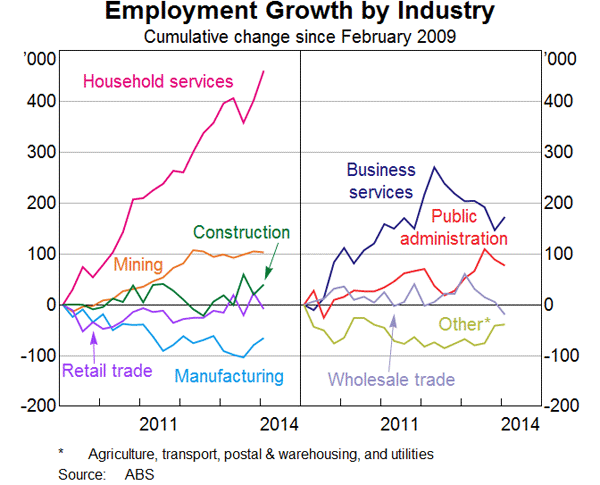
The transition from the relatively labour-intensive investment phase of the mining boom to its capital-intensive production phase is apparent in employment growth across different industries. Stepping back for a minute to the period from 2008/09 to 2011/12 (just prior to what appears to have been the peak in mining investment), resource-related activity accounted for a bit more than half of the growth in employment (Graph 4).[3] Much of that was in the mining industry itself, but much was also in industries that provide inputs to resources extraction or investment. Business services, manufacturing and construction all benefitted directly from this resource-related activity.
Now, as we are starting to see the decline in mining investment, there has been a reversal of some of these earlier trends. Most notably, business services employment has declined significantly, with firms more exposed to the mining sector particularly affected (Graph 5). Also, mining employment has plateaued since about mid 2012. Meanwhile, there has been further strong growth in employment in household services, which has accounted for a significant share of the growth in employment over recent years. There's also been a slight upward trend in employment in construction, consistent with the prospect of a strong pick-up in both residential and non-residential building, which will require more workers in this sector in the period ahead.
The relatively weak state of overall labour demand over the past couple of years has been evident in measures of employment intentions, job vacancies and advertisements. Some of these have shown signs of improvement of late, but they remain at relatively low levels. Households' expectations have adjusted as well; weak growth of labour demand has translated into concerns over job security. In turn, concerns over job security and labour market conditions have led to a decline in the rate of employee resignations which, in spite of an increase in the rate of dismissals, has seen turnover in the labour market decline a little.
Labour Supply
Labour market outcomes also depend on the supply of labour. Like labour demand, growth in labour supply has slowed substantially over the past year or so. This reflects both cyclical and structural influences.
The slowing in the growth of labour supply is evident in the rate of labour force participation. A smaller proportion of the working-age population is employed or looking for work. This decline in the participation rate has been larger than the average experience during earlier episodes of rising unemployment (Graph 6). So even though the population has continued to grow at a strong rate, the growth in the labour force has been a little slower than previous experience might have suggested.
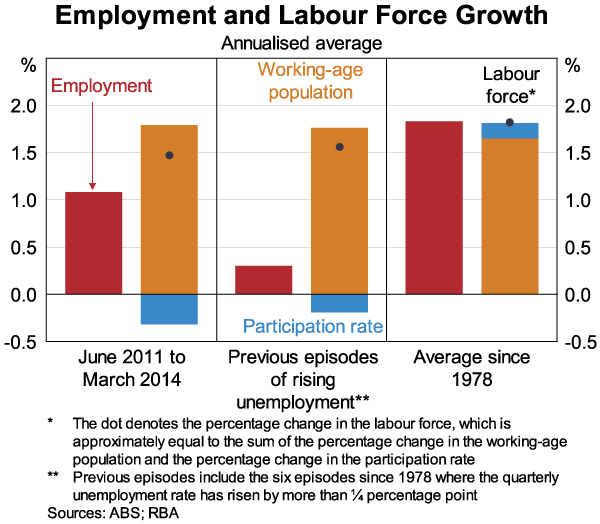
It is not unusual for the participation rate to fall during periods of weak demand. As jobs become more difficult to find (at the prevailing wage), some individuals become discouraged from searching. These individuals may still be available to work, but they might choose to sit on the sidelines of the labour market, ready to take up an opportunity or at least begin searching for one when conditions improve. Discouraged individuals represent an element of labour market slack that is not captured by the conventional measure of unemployment because they are ‘marginally attached' to the labour force.[4]
In recent years, there has been a rise in the proportion of the working-age population that is marginally attached to the labour force, which is consistent with a discouraged worker effect (Graph 7). This has contributed to the decline in the participation rate – that is, a rise in the share of the working-age population not in the labour force. But since 2010, the rise in the marginally attached only accounts for less than one-quarter of the rise in the share of the working-age population not in the labour force. Many of those not in the labour force may still have been discouraged, but they chose to make themselves unavailable for work; for example, they may have embarked on a period of study or decided to retire earlier than might have otherwise been the case.
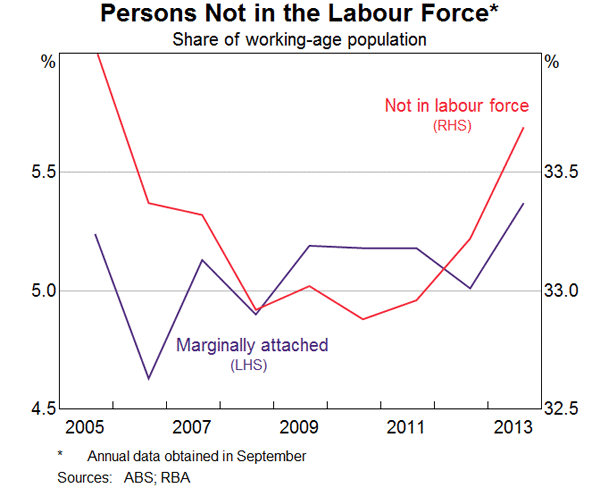
The noticeable increase in the number of people that are not in the labour force and are not considered to be marginally attached suggests that there are other, potentially more structural factors at play. An important one is ageing. An increasing share of the populace is moving into older age brackets, which tend to have lower rates of participation (Graph 8). Also, older workers are more likely to work part-time, so even those participating do so with fewer hours on average than when they were in the prime of their working-age lives.
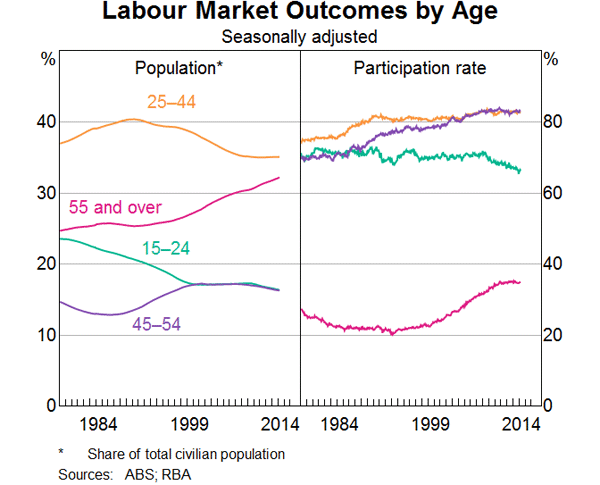
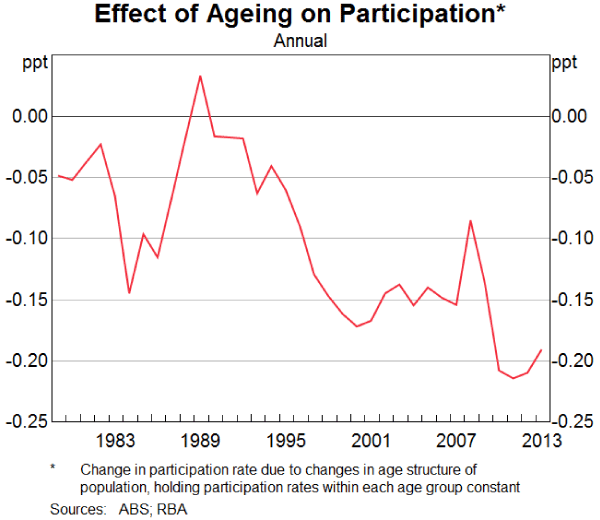
The ageing of the population is not new. By itself, ageing is estimated to have subtracted from the participation rate by between 0.1 and 0.2 percentage points per year over the past decade and a half (Graph 9). However, the effect has picked up a little in recent years as baby boomers have begun to reach the age of 65 years.
What has begun to deviate more noticeably from its historical path in recent years is the participation rate among older workers. In the past, rising participation of those people in older age brackets worked to more than offset the effect of an increasing share of older people in the population. That is, while the workforce was ageing, more people were working later into life than was the case in the past. In particular, older women were more likely to participate than was the case for their predecessors. But in recent years this trend increase in the participation of older age groups has slowed, and their participation rates have been flat or even falling a touch (Graph 10).
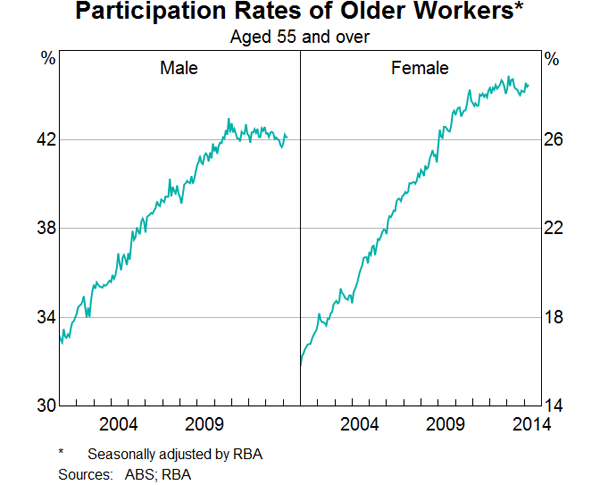
What's not clear though is why this upward trend has tapered off. It may be a response to the cyclical weakness in the labour market, in which case participation rates of those aged 55 years and over might trend up again, in time. Alternatively, it may be more structural. Perhaps earlier forces, including rising longevity and a general ability and preference to work later into life, may have largely run their course. However, given the long history of rising longevity, it seems likely that this will continue. One possibility though is that the forces underpinning the earlier rise in participation at older ages (including longevity) have run up against current incentives for many to retire by the age of 65 years.
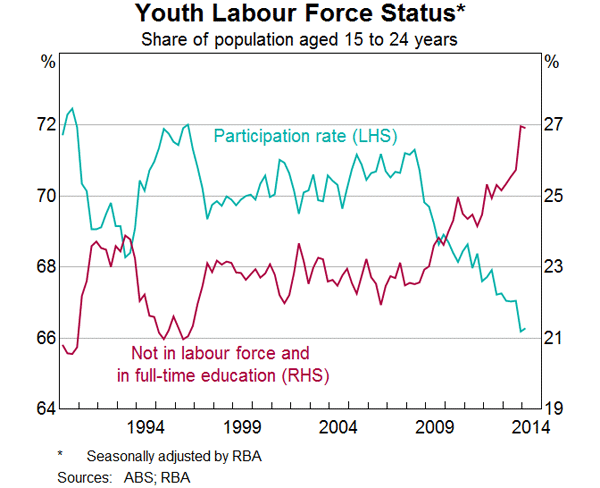
However, the story of lower participation rates is not entirely about ageing and the behaviour of older workers. Participation has also declined for other groups, most notably younger people – many more of whom are participating in education (Graph 11). Again, these declines may have both cyclical and structural elements.
Wages
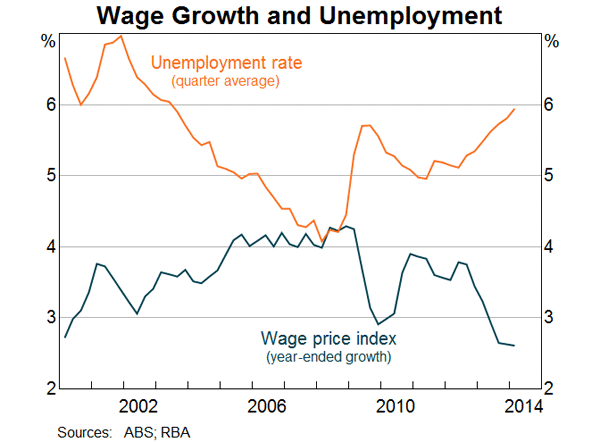
While the growth rates of labour demand and supply have both been weaker over the past couple of years, we know that the former has been more significant than the latter. The fact that labour supply has not been constraining employment growth is evident in the rise in the unemployment rate and the substantial decline in the growth rate of wages over that period (Graph 12).
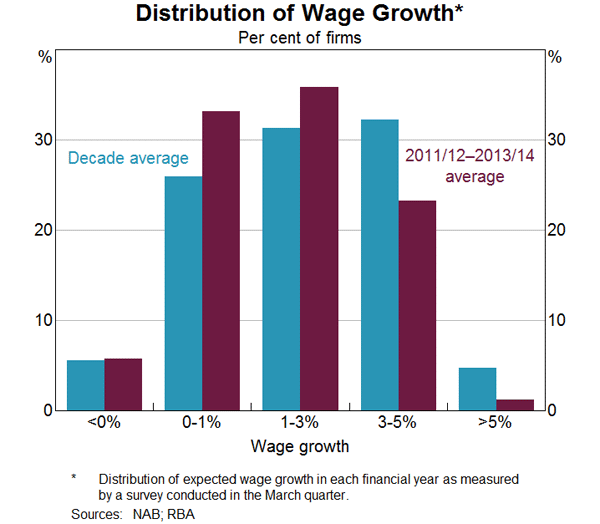
The slowing in wage growth is clear also in the leftward shift in the distribution of wage growth across individual firms (Graph 13). The data shown here are from the NAB business survey. This is also consistent with the Bank's liaison which suggests that wage outcomes of more than 4 per cent have become far less common than was the case a few years ago. Indeed, outcomes of 2–3 per cent are more common than 3–4 per cent. Slower wage growth has also been helped by inflation expectations remaining contained.[5]
The implications of a slowing in labour demand (relative to supply) depend significantly on the responsiveness of wages. Changes in demand will have less of an effect on employment and output if wages respond sooner and by more than otherwise. In this respect, the more flexible labour market in comparison to earlier terms of trade booms has been helpful. This flexibility allowed for a rise in relative wages to encourage labour into resource and resource-related activities during the run-up in mining investment, without this leading to a large rise in the growth rate of wages across the economy more broadly. The same flexibility is helping as the terms of trade and mining investment turn down.[6]
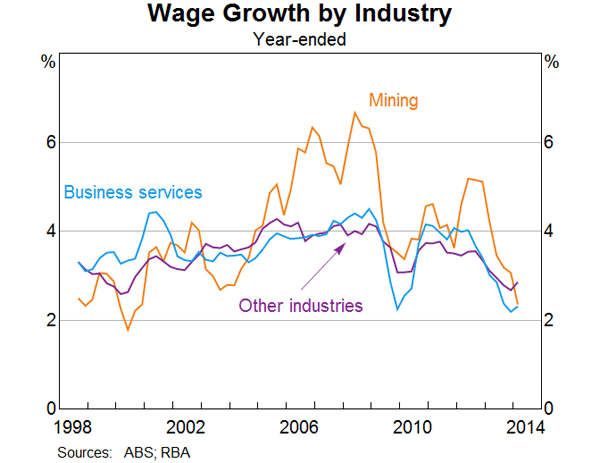
Indeed, the decline in wage growth of late has been particularly pronounced in mining and business services, but it is evident elsewhere (Graph 14). The move from the investment to the production phase of the mining boom is freeing up and will continue to free up labour to move back into the non-resource sectors of the economy. This has weighed on wage growth across the economy and is likely to do so for a while yet.
The slowing in wage growth across all industries has meant that firms have experienced relatively slow growth in their labour costs. This is more striking after accounting for the growth in the productivity of labour, which as I've already noted has picked up somewhat compared with the pace we had become accustomed to over much of the 2000s. Over the past year and a half, the growth in nominal wages has been matched by growth in labour productivity. As a result, there has been no increase in the cost of labour required to produce a unit of output.[7]
In turn, slower growth in labour costs is having a beneficial effect on international competitiveness. The link between labour costs and competitiveness can be illustrated by a measure of the real exchange rate based on unit labour costs (the real trade weighted index (TWI) in Graph 15). This tells us about the labour cost of producing a unit of output in Australia relative to the cost of doing so in our trading partners (both measured in equivalent currency terms). Over the decade to 2011, the real exchange rate appreciated significantly, consistent with the rise in the terms of trade and the mining investment boom. Much of that occurred via the nominal exchange rate, which appreciated by a little more than 50 per cent over that period. But part of the adjustment occurred via a pick-up in the pace of wage growth, at a time when labour productivity growth was relatively slow. Hence, nominal unit labour costs in Australia increased by around 25 per cent relative to our trading partners over this same period, contributing noticeably to the decline in competiveness (outside of the resources sector, which benefited from much higher commodity prices).
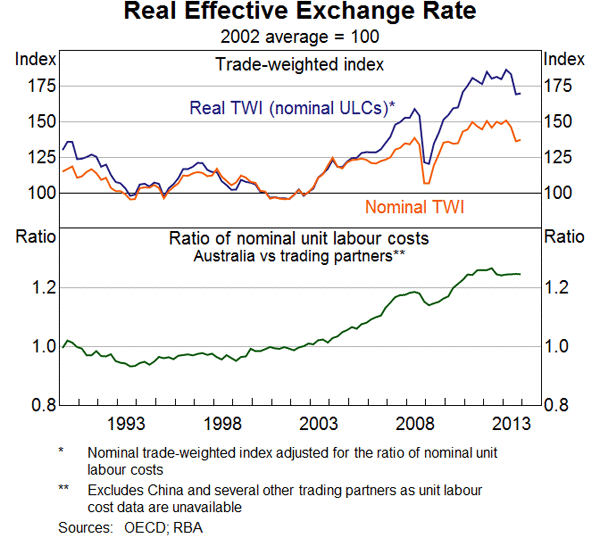
Now that process is beginning to change course. A decline in the real exchange rate is one important way in which the economy can adjust to the decline in the terms of trade and the transition to the production phase of the mining boom. Over the past year, we've seen a noticeable decline in the nominal exchange rate, although it still remains high by historical standards, particularly given the further decline in commodity prices in recent months.
At the same time, Australian unit labour costs have stopped rising relative to our trading partners and even declined just a little since mid 2012. This is part of the adjustment to the decline in commodity prices and will assist the non-mining economy regain some competitiveness and generate employment growth as demand for labour in the resources sector turns down. Adjustment via slower wage growth and stronger productivity growth may not contribute as much nor as quickly to a real depreciation as might be expected from a decline in the nominal exchange rate. However, it is still preferable to the alternative of little or no adjustment in the growth of unit labour costs, which would come at the expense of more unemployment and the associated economic and social costs.
Conclusions
To conclude, growth in both labour demand and labour supply has been slow over recent years. Demand for labour has been affected by several headwinds. The downturn in mining investment has weighed on domestic demand, while the commensurate pick-up in exports has been less labour intensive. On the labour supply side, much of the slowdown is likely to have had a cyclical element, although structural factors such as ageing are also playing a role.
The slower growth of wages over the past couple of years has been a helpful part of the process of adjusting to the downturn in commodity prices and mining investment. The decline in wage growth has contributed, at the margins, to a turnaround in the real exchange rate and helped cushion the effect of slower growth of domestic demand on employment growth. It has also helped to contain domestic cost pressures thereby offsetting the effect of the lower exchange rate on consumer prices.
The demand for labour has improved over recent months, although some of that may reflect a ‘catch-up’ after a period of weak employment growth last year. Some forward-looking indicators are higher than they have been, though they are still at levels consistent with only moderate employment growth in the next few months. The Bank's latest forecasts are for employment growth to pick up gradually over the next two years. The unemployment rate is expected to remain elevated over that period, declining from later in 2015 when we anticipate GDP growth to be picking up to an above-trend pace.
Looking well beyond that horizon, demographic changes loom large and will play an increasing role in the discussion of labour market developments. As we've suggested on a number of occasions, in time it is likely that the availability of workers, not jobs, will be the main concern.[8] And in that world, one imagines that real wages might grow a little more rapidly than otherwise, in order to encourage participation.
Endnotes
I thank David Jacobs, Kim Edwards, Daniel De Voss, Sharon Lai and Josef Manalo for help in preparing these remarks. [*]
The lags between activity and the labour market are discussed in RBA (2014), ‘Box B: Lags from Activity to the Labour Market’, Statement on Monetary Policy, May, pp 39–41. [1]
As discussed in Plumb M, C Kent and J Bishop (2013), ‘Implications for the Australian Economy of Strong Growth in Asia’, RBA Research Discussion Paper No 2013-03. [2]
Rayner V and J Bishop (2013), ‘Industry Dimensions of the Resource Boom: An Input-Output Analysis’, RBA Research Discussion Paper No 2013-02. [3]
The definition of marginal attachment includes individuals who are available for or searching for work, but not both (in which case they would be classified as unemployed). Note that some ‘discouraged’ workers may not be classified as marginally attached; for example, some individuals will choose to take up further study, in which case they are no longer available for work nor are they searching for it. Conversely, some individuals will be considered marginally attached even if they are not ‘discouraged’ from searching for a job; for example, those that are searching but not yet available to enter the labour force. [4]
See RBA (2013), ‘Box B: The Slowing in Wage Growth’, Statement on Monetary Policy, August, pp 51–52. [5]
See Battellino R (2010), ‘Mining Booms and the Australian Economy’, RBA Bulletin, March, pp 63–69; and Plumb M, C Kent and J Bishop (2013), ‘Implications for the Australian Economy of Strong Growth in Asia’, RBA Research Discussion Paper No 2013-03. [6]
The average growth of nominal unit labour costs over the inflation targeting period is around 2½ per cent, which is consistent with the CPI inflation target in the absence of trend changes in firms' profit margins or the exchange rate. [7]
See Stevens G (2014), ‘Economic Conditions and Prospects’, Speech to the American Chamber of Commerce (Qld) AmCham iiNet Business Luncheon, Brisbane, 3 April; and Kulish M, C Kent and K Smith (2010), ‘Aging, Retirement, and Savings: A General Equilibrium Analysis’, The B.E. Journal of Macroeconomics, 10(1), pp 1–32. [8]