Speech National Wealth, Land Values and Monetary Policy
It is a great honour for me to have been invited to deliver the Shann Memorial Lecture for 2015. I would like to thank the University of Western Australia very much for this privilege and I am delighted to be in Perth once again.
Edward Shann stands tall in the list of Australia's distinguished economists. His work emphasised the importance of looking back to history to understand what the future might hold for us. He was a tireless advocate for market-based policies, including in commodity, labour and foreign exchange markets. He was a strong and prominent voice against the tariff wall that had been built around Australian industry. And his writings emphasised the importance of spending public money wisely and the dangers of excessive and poorly designed regulation.
I suspect that if Shann was among us this evening, he would see much that he liked in the Australian economy of 2015. While we still have work to do, in many respects we are closer to the world that he advocated than we were in the 1920s when he was doing much of his work. Most of us, I think, would agree that the general move to a fairly liberalised market-based economy has served Australia and its people well.
Reading through Shann's work in preparation for this evening's talk, I was struck by his fascination with two other very modern Australian interests: balance sheets and land prices.
While I didn't come across him using the exact term ‘balance sheets’, Shann's writings display a deep interest in the evolution of the liabilities and assets of both the public and private sectors. He understood the dangers of excess leverage. He understood the importance of making sure that assets generated a return to cover their financing costs. And he understood the difference between current economic activity and the accumulation of wealth.
But it is Shann's discussion of land prices that really makes his writings come to life. He talks of ‘bubbles’, of ‘log-rollers’ pushing projects that increased the value of their own land and of the antics of the ‘land-jobbers’. And, when talking of the land boom of the 1880s, he cites with, I think, some disquiet, TA Coghlan's observation that “Free conveyances carried people to the sales, champagne lunches gave them courage to bid, and extraordinary terms of credit reconciled them to their purchases.”[1]
Today, people mostly find their own way to property sales and I hope that champagne is consumed only after the bidding process has stopped. But, our fascination with land, its value, and its financing has endured. In a way, it has become part of our national culture.
It is this interest of Shann's in balance sheets and land that serves as the motivation for my remarks this evening.
Most of the time, economic commentary focuses on changes in income and spending: things such as changes in GDP, consumption, retail trade, exports, etc. Most of the time, much less attention is paid to the developments in our national balance sheet. And when attention does turn to the balance sheet, the focus is often on the liability side, not on the asset side. So, this evening, I would like to take this opportunity to talk a little about Australia's national balance sheet, and particularly the asset side.
My remarks are in three parts. In the first part, I will look at what we know about our balance sheet and how it has changed over time, including the relative importance of land and physical capital. In the second part, I will discuss the increased value of our land and how we might interpret the changes that have taken place. And then, finally, I will discuss how some of these issues have a bearing on monetary policy.
Australia's National Balance Sheet
So, first to our national balance sheet and what we know about Australia's net wealth.
Constructing a national balance sheet is a challenging task, with measurement problems almost everywhere one looks. While the value of physical assets can be estimated with some precision, estimating the value of other assets can be extremely complicated. One of Australia's most important national assets is our institutional arrangements: things like the rule of law, our strong and credible institutions, and our stable political system. But putting a monetary value on these particular assets is nigh impossible.[2] There are also challenges in measuring the value of other important national assets, including our cultural heritage, our human capital and our rich and varied natural environment. There are various efforts around the world trying to make progress on how to measure these types of assets, but most of this work remains experimental.[3]
This means that inevitably, the construction of a national balance sheet is only partial, covering the elements that we can measure with some confidence. Notwithstanding this, since the late 1980s, the Australian Bureau of Statistics (ABS) has been producing an annual balance sheet for Australia, including an annual estimate of Australia's net wealth, that is, the difference in the value of our assets and our liabilities.
There are two ‘technical’ issues that are worth pointing out before talking about this balance sheet in some detail.
The first is that while the balance sheet includes a wide range of assets, it does not incorporate the assets that I was just talking about.[4] The assets that are included are man-made physical assets – such as buildings, infrastructure, and plant and equipment – as well as land, weapons systems, livestock and timber, inventories and known mineral resources. A number of intangible assets are also included, such as computer software, some intellectual property, and research and development assets. So it is a broad list of both private and public assets, but not a universal list.
The second technical point is that the balance sheet does not include financing transactions that are ‘internal’ to Australia; that is, it does not record when one Australian entity provides finance to another. This reflects the fact that while financial transactions between Australians do affect the risk profile of individual balance sheets within the economy, they do not, by themselves, change our national net wealth. It is what is done with this internal finance that matters for wealth.
In contrast to domestic financing transactions, when we draw on funding from the rest of the world, or buy assets overseas, our net asset position as a country does change. This means that financial transactions with the rest of the world are included in the national balance sheet.
So, to the data.
There are four broad observations to which I would like to draw your attention.
The first is that according to the ABS' latest estimates, the total value of Australia's assets as at end June 2014 was around $12½ trillion, or around $500,000 for each person living in Australia. After an adjustment is made for net foreign liabilities, the net asset position, or net wealth, was around $10 trillion, which is the equivalent to around six times Australia's annual GDP.
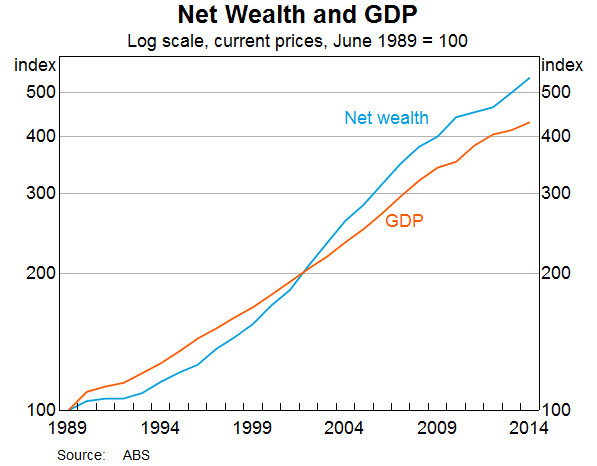
The second observation is that, over recent decades, net wealth has increased at a faster rate than has GDP (Graph 1). Between 1989 and 2014, the nominal value of net wealth increased at an average pace of around 7 per cent per year, compared with an average increase in nominal GDP of around 6 per cent. While net wealth grew more slowly than GDP in the first half of the 1990s, for most of the time since it has grown more quickly than GDP.
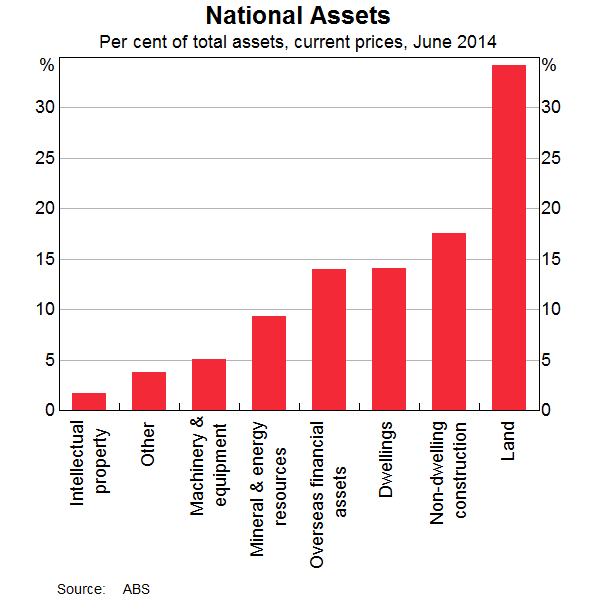
The third observation relates to the composition of our national assets (Graph 2). Land is the asset class with the highest value. As at June 2014, it accounted for 34 per cent of the value of our national assets. This is followed by non-dwelling construction – offices, factories, infrastructure, etc. – which accounts for a further 18 per cent of total assets. And then overseas financial assets and the value of our dwellings each account for a little under 15 per cent of the national balance sheet. Intellectual property assets account for only around 2 per cent of the total.
The final and perhaps most interesting set of observations relate to how the structure of the balance sheet has changed through time.
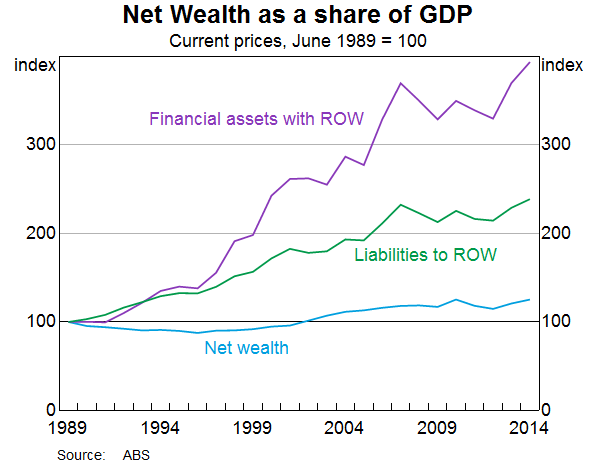
One very clear trend has been a substantial increase in the value of our foreign financial assets and liabilities; both have increased much faster than net wealth (Graph 3). In effect, as we have become more globally integrated as a nation, there has been a grossing-up of our balance sheet with the rest of the world. Australians now hold many more overseas assets than they once did. And, conversely, overseas residents now hold many more Australian assets than they once did.
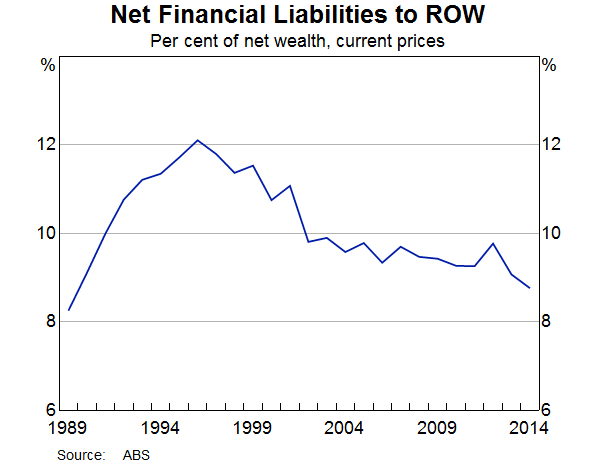
In net terms, Australia still has a net liability position with the rest of the world, having been a drawer on overseas savings for more than 200 years. Interestingly though, while our net liability position, relative to our national income, has been relatively steady in recent decades, relative to the value of our national assets it has declined and is currently at the lowest level in around 25 years (Graph 4).
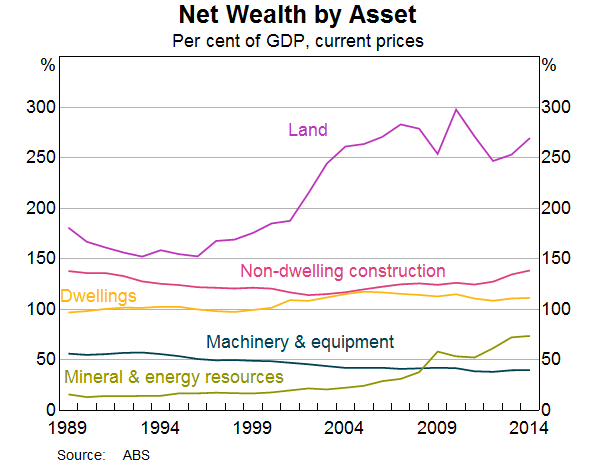
In terms of the non-financial assets, there have also been significant changes over time (Graph 5). The most striking of these is the increase in the relative importance of land. Indeed, almost three-quarters of the increase in the ratio of net wealth to GDP since the late 1980s is explained by higher land prices.
Given the significance of this change, I want to explore why it has occurred and its implications a little later in this talk. But before I do so, it is worth talking about other changes in the national balance sheet.
One of these is the noticeable increase in the value of our mineral and energy resources.[5] In 1989, these assets accounted for just 3 per cent of net wealth. Today, the figure is 12 per cent. This rise reflects both the discovery of new resources and higher commodity prices. These higher prices have increased the present discounted value of expected future production, as well as the share of the existing known reserves that can be extracted economically at some point in the future.
One aspect of the balance sheet that has shown relatively little net change over time is the value of non-dwelling construction assets, relative to GDP. The relative valuation of these assets did decline over the 1990s, but this trend reversed in the 2000s with the investment boom in the resources sector. In contrast, the value of machinery and equipment, relative to GDP, has fallen steadily since at least the late 1980s, although this is largely explained by the fall in the relative price of machinery and equipment.
Looking to the future, it is important that Australia continues to invest in our asset base. While growth in the overall capital stock has been strong in recent years because of developments in the resources sector, growth in the non-mining capital stock has been noticeably weaker. This weak growth is partly cyclical, although it is proving to be more protracted than earlier expected. There may also be a structural element, and it is possible that, over time, we might return to the earlier general downward trend in the value of our physical capital stock relative to GDP. One contributing factor here is that a number of the strongly growing services industries are more intensive in human capital than in physical capital. Given this, our focus needs to be not just on creating an environment that is conducive to the accumulation of physical assets but, perhaps even more importantly over the medium term, on the accumulation of human capital.
One other aspect of the current debates about investment that I am sure Shann would have found very interesting is that surrounding infrastructure investment. His writings drew attention to the important role that such investment can play in a growing economy. But they also emphasised the importance of making sure that investments in infrastructure generate an appropriate rate of return. In his short book about the 1890s and the 1920s, Shann writes ‘Public works are excellent things, but only so long as the balance is preserved between capital and earning power’. In this context, he writes approvingly of the appointment by Sir Henry Parkes in 1888 of Edward Eddy as the Chief Commissioner of Railways in New South Wales, stating that: ‘Eddy raised the return on the capital invested in the New South Wales railways from 2.85 per cent to 3.58 per cent, and in tramways from 1.98 per cent to 5.28 per cent’. He contrasts this with the outcomes in Victoria where he writes with strong disapproval that the Victorian railways commissioner, Richard Speight, ‘caught the feverish spirit of speculation’.[6]
Shann's general observations in the area transcend time.
If we fast forward to the Australia of 2015, there is a reasonable case that there are a number of investments in new infrastructure assets that would satisfy Shann's test that ‘the balance is preserved between capital and earning power’. This is especially so when funding costs today are lower than at the time when Shann was writing, and indeed, in many cases, the lowest since Federation.
But, as he often pointed out, money spent on infrastructure can be wasted easily. The key here is to ensure that the right projects are selected, the construction costs are well controlled and that the risk-sharing between the public and private sectors serves the public interest. Getting these ‘governance issues’ right is far from straightforward, but it is not impossible. Making progress on this front would help us build the infrastructure assets that would strengthen our national balance sheet and lift our productive capacity.
The final aspect of this balance sheet to which I want to draw your attention before returning to the issue of land prices is the gradual, albeit relatively small, increase in the value of our dwellings (excluding the land component) relative to our incomes.
There are a number of factors that have contributed to this increase. One is that, since the late 1980s the average number of people living in each dwelling has fallen a little, so that the number of dwellings has increased a bit more quickly than the population. Another is that, over time, the average quality of our dwellings has improved and the average size of the dwellings has increased; for example, since the late 1980s, the average floorspace of newly constructed houses has risen by around 45 per cent (Graph 6). Interestingly, both of these trends – that is, towards smaller households but bigger dwellings – seem to have reversed in recent times.
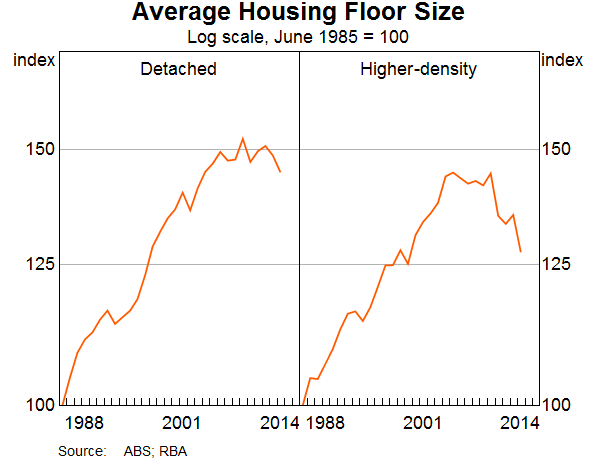
These data put into some perspective the claims that are sometimes made that Australians are investing too much in housing. In a sense, the upward drift in the value of the constructed housing stock, relative to our incomes, looks neither surprising, nor remarkable. Right around the world, as people's incomes rise, they tend to use the extra income to purchase better dwellings.
Instead, what is perhaps more remarkable is the extra resources that Australian households have used to purchase, from one another, the land on which these bigger and better dwellings sit. Indeed, most of the extra money that has gone into residential property has not gone not into the physical stock of housing, but rather into land. So our fascination with housing is really, mostly, a fascination with land.
Land Values and Wealth
I would now like to explore this rise in the value of our land, and its implications, in a bit more detail.
Taken literally, the figures that I have presented invite the conclusion that our national wealth has risen largely because of higher land prices. But is such a conclusion really warranted? Have we really become wealthier as a nation simply because the value of our land has increased?
The answer would clearly be yes if this increase was because we had discovered more land. To my knowledge, though, this has not happened.[7]
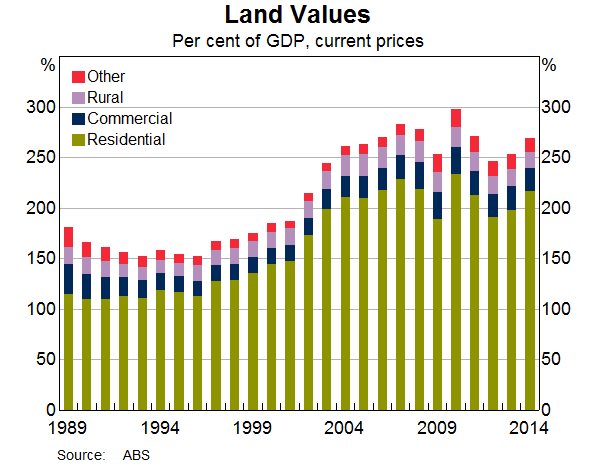
It would also be yes if the main factor driving the increase in land prices was a large leap in productivity of our agricultural land. Over time, crop yields have indeed increased substantially, but the resulting higher value of rural land accounts for only 5 per cent of the increase in the total value of land in Australia since the late 1980s.[8] Instead, almost all the increase has come from the higher value of the land upon which our dwellings are built in the towns and cities across Australia (Graph 7).
So, how do we explain this increase in the value of our residential land over recent decades?
There are two main structural factors.
The first is the combination of financial liberalisation and low inflation. In the 1970s and 1980s, regulation of the financial system and high inflation served to hold down land prices artificially. They did this by limiting the amount that people could borrow. When the financial system was liberalised and low inflation became the norm, people's borrowing capacity increased. Many Australians took advantage of this and borrowed more in an effort to buy a better property than they previously could have done. But, of course, collectively we can't all move to better properties. And so the main effect of increased borrowing capacity was to push up housing prices, and that means land prices.
The second factor is the combination of strong population growth and the structural difficulties of increasing the effective supply of residential land. Since 1989, the Australian population has increased by more than 40 per cent, or around 7 million people, one of the fastest rates of increase among the advanced economies. The difficulties of responding to this on the supply side of the housing market have been well documented.[9] They include the challenges of developing land on the urban fringe and of rezoning land close to city centres for urban infill. They also include, in some areas, underinvestment in transportation infrastructure. This underinvestment has effectively constrained the growth in the supply of ‘well-located’ land at a time when demand for this type of land has grown very strongly. The result has been a higher average price of land in our major cities.
Another possible structural explanation is that the higher land prices reflect an upward revision to people's expectations of future income growth and thus the amount they are prepared to pay for housing services. One possible reason for this is that the growth of our cities generates a positive externality – by bringing more people together competition is improved and productivity is higher. While this might be part of the story, I think it is unlikely to be a central part. Real income growth per capita did pick up markedly from around the mid 1990s, but it has subsequently slowed substantially, with apparently little effect on the price of land relative to income.
So the story is really one of increased borrowing capacity, strong population growth and a slow supply response.
One might ask why it matters why land prices have risen. After all, regardless of the reason, higher land prices have delivered large capital gains to many Australians and have made them better off.
The complication here comes from the fact that Australians are both owners of housing assets and consumers of housing services. We don't just own housing and the land on which it is built, but we also live in that housing, and on that land. And that housing and land provide us with valuable services.
If housing is fairly valued – in the sense that the price of housing is equal to the present discounted value of the future rents – then the rise in prices implies an increase in the expected future cost of housing services.
So, from the perspective of society as a whole, much of what is gained on the one hand is lost on the other: there are windfall gains from higher land prices but then everyone pays more for housing services.[10]
How any one individual is affected by all of this depends upon their own circumstances.
For an older person who owns their own home and has no children, the capital gain from the higher land prices more than offsets the expected higher future housing costs. Such a household is better off. The same is true for owners of investment properties, since they own multiple dwellings on which they earn a capital gain. In contrast, for young homeowners with multiple children, the calculation can look quite different. If they care about the future housing costs of their children, then, in some circumstances, it is possible that the higher future expected housing costs could exceed the capital gain on their dwelling. In a welfare sense, the increase in land prices could make them worse off, even though they own land. The same is obviously true for renters as they do not have any capital gain to offset the higher future housing costs.
One might think that only an economist would argue in these terms: to worry that a capital gain on an asset that you own could actually make you worse off because of some vague notion of higher future housing costs, especially for your children. And you might be right. But I think many Australians have an innate understanding of the concept and share the concern. Many parents around the country look at the high housing (really land) prices and worry that their children will not be able to afford the type of property that they themselves have been able to live in, even if their children were to have the same life-time income profile as they have had. In effect, these parents are doing the present discounted value calculation and they see the potential problem.
So it is arguable that the main impact of higher land prices is not really to increase our national wealth, but to change the distribution of that wealth.
The distributional effects are in two dimensions. The first is cross-sectional, with the existing owners of dwellings receiving capital gains when land prices increase. The second is the distribution of wealth across generations, with the current owners of dwellings earning capital gains but future generations paying higher housing costs. Both of these aspects of changing wealth distribution have economic and social consequences, neither of which, I suspect, are yet fully understood.
How the intergenerational distribution ultimately plays out will depend critically upon the extent to which the gains that have accrued to the current generation are passed on to the next generation. In general, we know relatively little about intergenerational transfers, but what we do know suggests that things may be changing gradually. One illustration of this can be seen in the Household, Income and Labour Dynamics in Australia (HILDA) Survey, which suggests that, over time, there has been some increase in the share of first-home buyers that are receiving loans from family and friends (Graph 8). There is also some evidence of younger generations receiving increased assistance with household expenses from older generations, including by continuing to live in the family home.
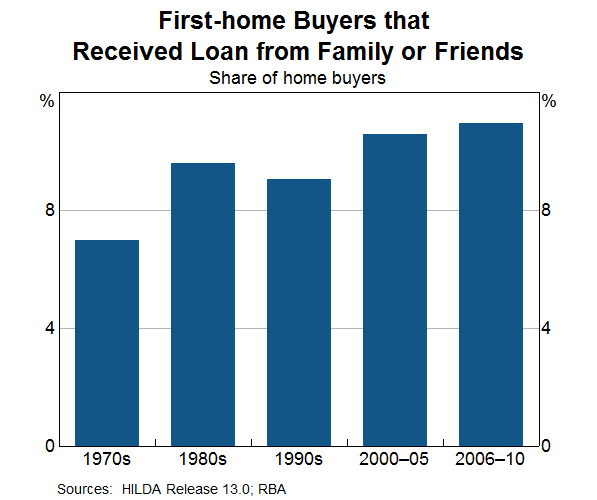
It is quite likely that these trends will continue with it becoming more commonplace for parents to help their children in the property market. This has both economic and social consequences. Of course, if this type of intergenerational assistance does become more common, then fewer parents will be able to use the capital gains that they have benefited from to boost their own consumption. Instead, in effect, they will be using those capital gains to support the following generations with their higher housing costs. Alternatively, if it turns out that today's generations use their capital gains to increase their own spending, then they will have less ability to help their children. If this were to happen, I suspect that, over time there would be some downward pressure on the price of housing, relative to incomes, as future generations deal with the high cost of housing.
Implications for Monetary Policy
In the remaining time I would like to touch on three issues relevant to monetary policy that are closely related to the issues I have been talking about.
Higher land prices and spending
The first of these is the link between higher housing prices and household spending.
There is a well-established research literature empirically demonstrating that higher housing wealth boosts household consumption. For example, work done by my colleagues at the Reserve Bank of Australia (RBA) has estimated that a rise in wealth of $100 leads to a rise in non-housing spending of between $2 and $4 per year.[11]
There are two commonly accepted channels that explain this relationship.
The first is a pure wealth channel. To the extent that higher dwelling prices are perceived to increase wealth, households should spend a little of that extra wealth each year over their lifetime.
The second is the collateral channel, as higher land prices increase the value of collateral that can be posted by potential borrowers. The increased collateral makes it easier for credit-constrained households to borrow to increase their spending. Similarly, businesses can find it easier to finance projects that previously might have struggled to get finance.[12]
Over recent years, there has, however, been some reinterpretation of the role of the pure wealth channel.
In part, this reflects the issues that I was speaking about a few moments ago; that is, that higher housing prices not only deliver capital gains to the existing owners but also imply a higher price of future housing services. The reinterpretation of the evidence is that the link between housing wealth and spending arises not so much through the traditional pure wealth channel, but rather because higher housing prices are sometimes a proxy for faster expected income growth into the future. And it is this lift in expected income growth that spending is really responding to.
Interestingly, other colleagues at the RBA have recently been examining this idea, again using household level data from the HILDA Survey.[13] They find clear evidence in favour of a collateral channel, especially for younger households who are more likely to be credit constrained. In contrast, they find no evidence in favour of the traditional pure wealth effect. Instead, their evidence is consistent with the alternative expected-income idea. Perhaps, the most intriguing aspect of their results is that when housing prices in a particular area increase, renters in that area increase their consumption. The increase is not as large as for owner occupiers, but it is an increase. The conclusion that my colleagues reach is that it is a common third factor such as higher expected future income, or less income uncertainty, that is, at least partly, responsible for the observed association between housing wealth and spending.
If this conclusion is correct, then I think it helps partly explain what is going on in the economy at the moment. In the early 2000s, when housing prices and real incomes were rising quickly, many households used the higher value of their housing assets to increase their spending. Nowadays, this is not happening on the same scale that it once was. With slower expected future income growth and increased concerns about future housing costs, the response to higher housing prices looks to be smaller than it was previously. And this smaller response is affecting overall spending in the economy.
Liabilities and risk
The second issue that I wanted to touch on is the increase in debt that has accompanied the increase in land prices.
Throughout this talk I have barely touched on the liability side of the balance sheet. This is largely for the reason that I spoke about at the start, namely that financing transactions that are internal to the country do not change Australia's net wealth. However, these transactions can have a material impact on the profile and riskiness of the individual balance sheets within the economy.
The rise in land prices that I have spoken about is inextricably linked to the rise in household borrowing. Together, these two developments have grossed up the household sector's balance sheet (Graph 9). This means that, on the assets side of the balance sheet, a given percentage change in housing prices has a bigger effect than it once did. And on the liabilities side, movements in interest rates also have a bigger effect.
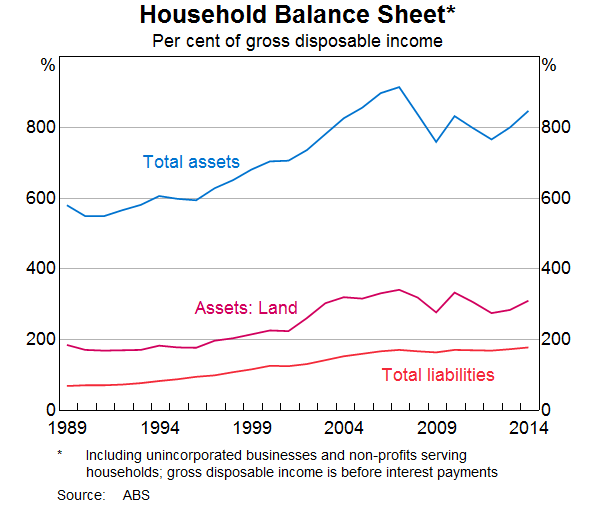
We are still trying to understand fully the implications of all of this. However, I think it is difficult to escape the conclusion that household balance sheets are, on average, a little more risky than they once were. Many Australian households also seem to have reached a similar conclusion. This is reflected in the decision by many Australians to take a more prudent approach to their spending over recent years.
I suspect that it is unlikely to be in our national interest for this more prudent approach to give way to household consumption once again growing consistently much faster than our incomes. This is something we continue to be cognisant of in the setting of monetary policy. Some decline in the rate of household saving is probably appropriate as the economy rebalances after the terms of trade and mining investment booms. But, given the position of household balance sheets, it is unlikely to be in our long-term interest for a consumption boom to be financed by a pick-up in household borrowing.
Generating growth
That brings me to my final issue: that is the need to generate sustainable growth in the economy.
Monetary policy can play some role here, including by helping reduce uncertainty by maintaining low and stable inflation and overall stability in the economy. But monetary policy is, ultimately, not a driver of medium-term economic growth. Indeed, while low interest rates are currently helping the economy through a period of transition, an extended period of low interest rates implies ongoing low returns to savers and low underlying returns on assets. This is not a world to which we should aspire.
One of the challenges we face as a country is to lift the expected risk-adjusted return on investment in new assets, whether they be physical assets or human capital. If we can do this, then we will see the investment in new assets that is crucial to the sustainable expansion in the economy.
There is no single lever that can be pulled here. But neither is there a shortage of sensible ideas that, if implemented, could improve the environment for the creation of new assets in Australia.
These ideas include: a strengthening of the culture of innovation; the removal of unnecessary and overly complicated regulation; and making competition work effectively in markets across the country. Increased investment in infrastructure, including in transport, probably also has a role to play here. Done properly, it could help lift the return to other forms of investment in a wide range of industries across the economy. Better transportation can also increase the effective supply of well-located land, making housing more affordable for many Australians. None of this is easy, but neither is it impossible.
Concluding Remarks
Let me conclude by trying to bring these remarks together with three brief closing observations.
The first is that rising land and housing prices have made many, but not all, Australians better off. They have also changed the distribution of wealth within our society and between generations. And we are still coming to grips with the implications of this. Ever-rising housing prices, relative to our incomes, do increase risks in the economy and are unlikely to make us better off as a nation. Rising housing prices are best matched by rising incomes.
The second observation is that real wealth generation for the society as a whole comes from asset accumulation and lifting our productivity. While the rise in the value of our resource base over the past decade has improved our national balance sheet substantially, we cannot rely on this occurring again. Further improvement in our national balance sheet requires us to invest in both physical and human capital. And it requires us to come with new ideas and better ways of doing things.
And the third, and related observation, is that balance sheets have two sides. They have a liabilities side and they have an assets side. Both sides need to be managed carefully. We need to make sure that our liabilities are sustainable and that they are managed prudently. Shann's writings remind us of what can happen if we do not do this. But we also need to make sure that we continue to invest in the assets that form the base of sustainable growth in national income over the years ahead.
Thank you very much for listening this evening. I would be very happy to answer any questions.
Endnotes
I would like to thank Gianni La Cava and Christian Gillitzer for assistance in the preparation of this talk. [*]
See Shann (1927), (1948, ch XVII, p312). [1]
To some extent the value of these institutional arrangements is capitalised into our land prices. [2]
Some years ago the ABS (Wei 2004, 2008) produced experimental estimates of human capital stocks and flows for Australia. Boarini et al (2012) provide a cross-country review of practices to measuring human capital. The United Nations Statistical Commission's ‘System of Environmental-Economic Accounting’ provides a framework to unify statistical information on the environment and its relationship with the economy. The ABS has been producing a Water Account since the early 2000s, providing information on the physical and monetary supply and use of water in the Australian economy. [3]
Australian Bureau of Statistics (2014). [4]
The value of these resources is estimated as the current value of economically exploitable resources given current technology and prices. Price estimates are based on a 5-year lagged moving average. [5]
The quotes here come from Shann (1927), pp 30, 33 and 12, respectively. [6]
While the physical land area of Australia has not changed, the ABS volume estimates for land have increased over time, reflecting improvements in land quality. The ABS assumes that the volume of urban land increases at half the rate of growth in the volume of overlying non-dwelling construction and one-third the rate of growth in the volume of overlying dwelling construction. There is no change in rural land volume over time, with rezoning of rural land to urban use assumed to be offset by rural land improvements. [7]
Currently, rural land accounts for just 6 per cent of the value of land in Australia. In contrast, Scott (1969) estimates that in 1930 rural land accounted for 57 per cent of the total value of private land on an unimproved basis and 43 per cent on an improved basis. [8]
Productivity Commission (2011) discusses the role of planning, zoning and development assessments. Kulish et al (2012) use a calibrated model to study the effect of supply constraints on density and the price of land in an Australian context, while Gitelman and Otto (2012) provide supply elasticity estimates for residential property in Sydney. [9]
For a theoretical treatment of this point, see Buiter (2008). [10]
See, for example, Dvornak and Kohler (2007). [11]
Recent work at the RBA also suggest that higher housing wealth provides collateral for small-business borrowing and is associated with higher levels of business formation (see Connolly, La Cava and Read 2015). [12]
See Windsor, Jääskelä and Finlay (2015). [13]
References
Australian Bureau of Statistics (2015), Australian System of National Accounts: Concepts, Sources and Methods, 2014, ABS Cat No 5216.0, Chapter 17.
Boarini R, M Mira d'Ercole and G Liu (2012), ‘Approaches to Measuring the Stock of Human Capital: A Review of Country Practices,’ OECD Statistics Working Papers, 2012/04, OECD Publishing. Also available <http://dx.doi.org/10.1787/5k8zlm5bc3ns-en>.
Buiter Willem H (2008), ‘Housing Wealth Isn't Wealth’, NBER Working Paper No 14204. Also available <http://www.nber.org/papers/w14204>.
Connolly E, G La Cava and M Read (2015), ‘Small Business & Finance’ in J Simon and A Moore (eds), Housing Prices and Entrepreneurship: Evidence for the Housing Collateral Channel in Australia, Proceedings of a Conference, Reserve Bank of Australia, Sydney.
Dvornak N and M Kohler (2007), ‘Housing Wealth, Stock Market Wealth and Consumption: A Panel Analysis for Australia’, Economic Record, 83(261), pp 117–130.
Gitelman E and G Otto (2012), ‘Supply Elasticity Estimates for the Sydney Housing Market,’ Australian Economic Review, 45(2) pp 176–190.
Kulish M, A Richards and C Gillitzer (2012), ‘Urban Structure and Housing Prices: Some Evidence from Australian Cities,’ Economic Record, 88(282) pp 303–322.
Productivity Commission (2011), Performance Benchmarking of Australian Business Regulation: Planning, Zoning and Development Assessments, Volume 1, Research Report, Canberra.
Scott RH (1969), ‘The Value of Land in Australia’, Paper delivered to the 1969 meeting of the Australian and New Zealand Association for the Advancement of Science (ANZAAS) Congress, Adelaide.
Shann EOG (1927), The Boom of 1890 – And Now, Cornstalk Publishing Company, Sydney.
Shann EOG (1930), An Economic History of Australia, in particular Chapter XVII, ‘The Land Boom’, pp 298–315, Cambridge University Press, Cambridge.
Wei, H (2004), ‘Measuring the Stock of Human Capital for Australia,’ Methodology Research Papers, ABS Cat No 1351.0.55.001.
Wei, H (2008), ‘Measuring Human Capital Flows for Australia,’ Working Paper, cat. no. 1351.0.55.023, Australian Bureau of Statistics, Canberra.
Windsor C, J Jääskelä and R Finlay (2015), ‘Housing Wealth Effects: Evidence from an Australian Panel’, Economica, 82(327), pp 552–577.
