Speech Women in the Economy and in Economics
Thank you to the Women in Economics Network for the invitation to speak at its ACT launch. It is an incredible honour. It is also very pleasing to see that this network has been formed. As I'll discuss later in my talk, economics has struggled with an image – and a reality – of being a male-dominated profession. This is true both in Australia and in many other countries, and it is more of an issue in economics than in some other quantitative disciplines. Networks such as these are instrumental in helping to break down barriers. That's needed, because there are considerable barriers to achieving a more equal participation of both sexes in the profession, consistent with the true distribution of talent.
Women in the Australian Economy
Before I get to the topic of the economics profession, I'd like to make some brief remarks on the story of women in the Australian economy. I can't do this story justice in the time available, but perhaps some of the facts I highlight can help illuminate where Australia is in terms of equality of the sexes, and how we got there.
Economic and social changes often come from deep structural drivers. Sometimes, they come instead from long-lasting effects of business cycle developments. It's easy to confuse the two. Many commentators do so, pointing to structural causes, such as skills mismatch, when cyclical developments, like slow labour market recoveries after recessions, might be just as plausible. We must therefore be careful about interpreting shifts in the labour market, including changes to the pattern of male and female employment. It isn't always clear what is deep and structural, what is cyclical and temporary, and what is initially cyclical but ends up having long-running effects.
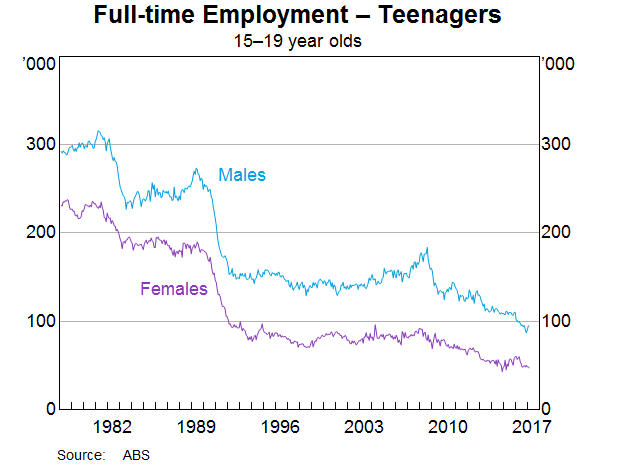
Cyclical developments can indeed have lasting implications. One particularly striking example is that recessions in Australia have resulted in permanent reductions in the level of full-time employment for teenagers (Graph 1). The technical term for this kind of path dependence is ‘hysteresis’. Another way to describe it might be that ‘extinction is forever’. There was a background trend of increased school retention, but it's amazing how that effect was so concentrated in recessions and their aftermath. There's a gender angle here, too, because the effect is starker for males than females. It isn't entirely clear why that is, but it might have had something to do with decisions to employ apprentices.
Structural, or perhaps we should say ‘non-economic’, factors can also have profound implications for economic outcomes.
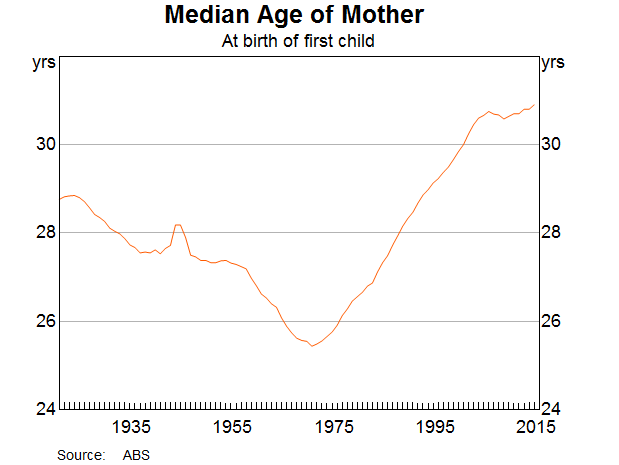
- On the demographic side, we are seeing the effects of an ageing population, driven partly by increasing longevity, and partly by the end of the post-war baby boom and the ageing of the generation born in that boom. The end of the baby boom also saw an increase in the average age that people partnered and became parents (Graph 2). The post-war period was the anomaly here. The current median age of first parenting is only a little above where it was a century ago. If we look at Western European countries, it turns out that partnering and parenting in one's mid-to-late twenties has been the norm for several centuries there.[1]
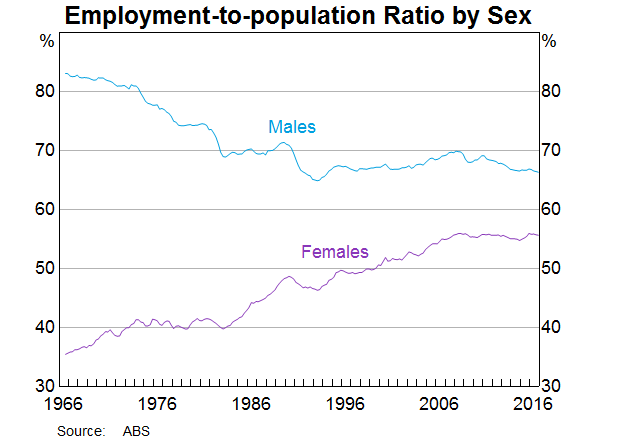
- On the social side, we see the long-lasting effects of the integration – or perhaps we should say the reintegration after the post-war period – of women into the labour force. Female labour force participation and employment has increased by around 15 percentage points since the mid 1970s, though it has levelled out more recently and is still noticeably lower than for males (Graph 3).
Social and demographic changes are mediated through and in turn affect institutional arrangements. Australia's unusual wage-setting system, starting from the 1907 Harvester judgement until the 1990s, was centred on a judicial process. The social presumption behind that process (until at least the late 1960s) was that men had a family to support, while women did not. (This led to much commentary about the number of non-existent wives and children being supported on men's wages.) Unequal pay was therefore enforced by that process until the equal pay decisions of 1969 (equal pay for equal work) and 1972 (equal pay for work of equal value).
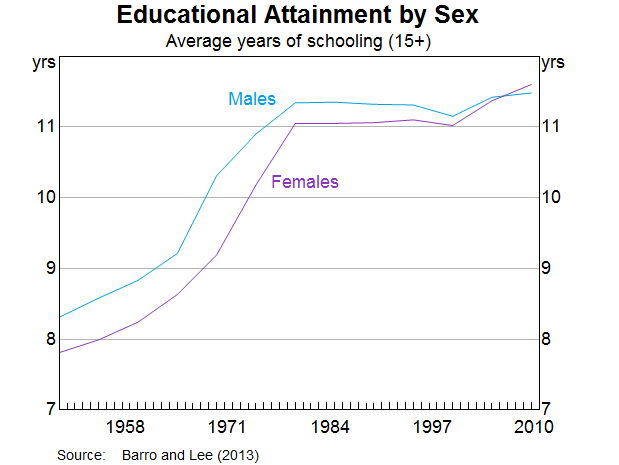
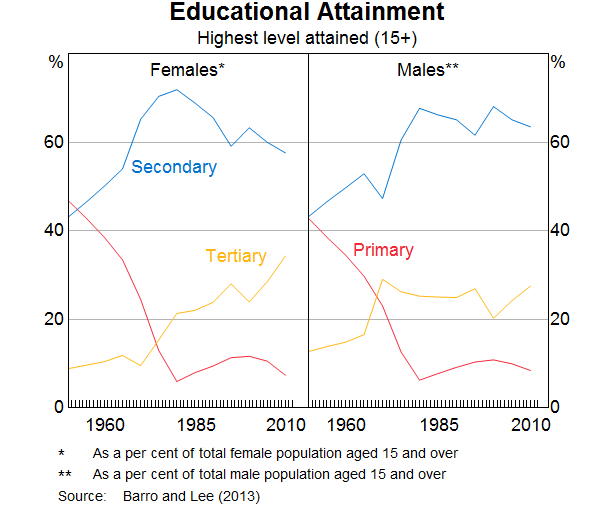
It is common to assume that if wages are lifted by the powers of the state, rather than by the forces of supply and demand, employment of the affected group will fall. That is not what happened to women in the 1970s. As the graph above shows, female employment increased, participation increased, and a wider range of occupations opened to women. That outcome should be seen in the context of the substantial increase in educational attainment for both males and females in the post-war period (Graph 4). Much of that increase had already occurred before the equal pay decisions. Following those decisions, the gap between the sexes on this measure (which was never very large) narrowed noticeably, perhaps partly because equal pay increased the payoff to female education. (Free university education probably helped as well.) In fact it is now the case that women are more likely than men to have a tertiary education (Graph 5).
The conclusion I draw from this is that, prior to those equal pay decisions, women were not being paid their marginal product. But employers did not respond to this cost differential by substituting male workers with cheaper female workers. Perhaps that was partly because of a (false) social presumption that female workers were less skilled. Occupational segregation also helps prevent substitution between different groups, in this case between the sexes.
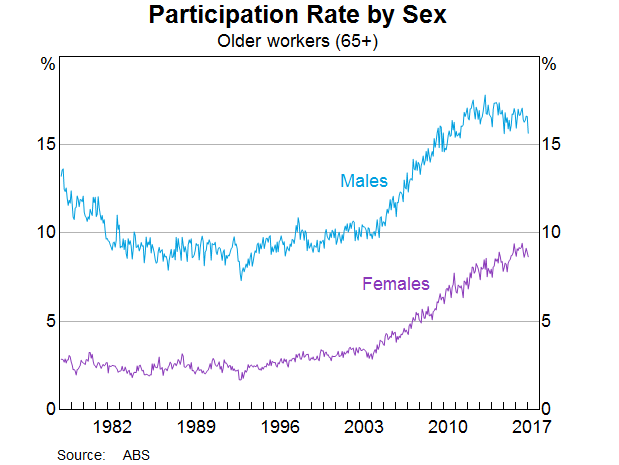
Lest you think that this is all old history and irrelevant to the present day, it is worth recalling that there are women who were in the workforce at the time of the equal pay decisions who are still in the workforce today or only recently retired; the second equal pay decision happened in my lifetime. It's also important because the dynamics of these large social changes are quite slow moving. They take effect at a generational frequency. To take one example, participation rates of older workers – both male and female – have risen noticeably over the past decade or so (Graph 6).
Part of this might be a response to increased employment opportunities in specific fields during the mining investment boom. And part of it might have been a response to rising pension ages and concerns that retirement savings might not be adequate. But for older women, some of the shift could also be a cohort effect. The generations of women with higher labour market participation rates than their predecessors were also more likely to remain in the labour force as they approached and passed conventional retirement ages.
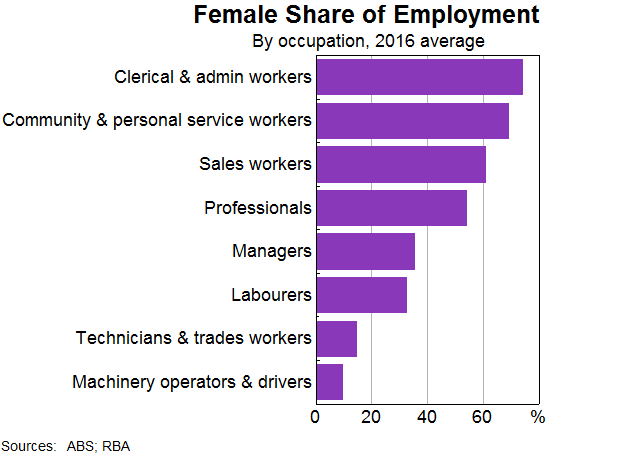
Occupational segregation is another feature of the labour market that shifts only slowly. Decisions made as teenagers affect occupational choices over one's entire career. That's still the case even nowadays, when people are expected to make several ‘career changes’ throughout their working lives. And as you can see from this graph, the Australian labour force is still quite sex-segregated across different occupations; some occupations are mostly undertaken by female workers, while occupations such as trades and machinery operators are mostly undertaken by males (Graph 7).
I don't have time today to do justice to the huge literature examining how occupational segregation comes about or what might cause it to change.[2] But one broad way to summarise the evidence is that the pattern of occupations that are male-dominated or female-dominated is largely determined by social conventions past and present. The echo of past social conventions remains in older workers' occupational choices. There are examples of social conventions and employment patterns changing. Those of you who have seen the film Hidden Figures would now be aware that performing mathematical calculations was once considered ‘women's work'. At that time, a ‘computer’ was a human, often a female human. That might be surprising to some people, given the overwhelmingly male-dominated mathematical professions today. A more recent example of what was once traditionally a ‘male’ occupation now employing many more women is the role of traffic management on roadwork crews.
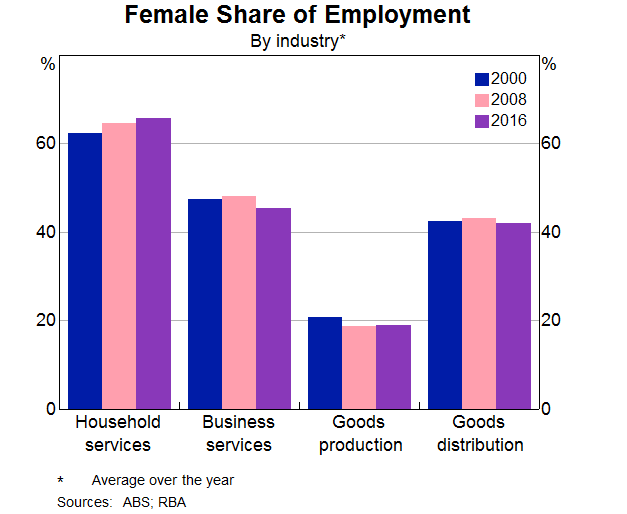
At a broader level, though, industry-level and occupation-level sex-segregation is remarkably stable from decade to decade. Across both the broad industry groupings shown in this graph and more narrowly defined specific industries, the share of females in total employment has been remarkably stable over the past decade or so (Graph 8). Where it has changed, the sex-segregation has if anything become more stark.
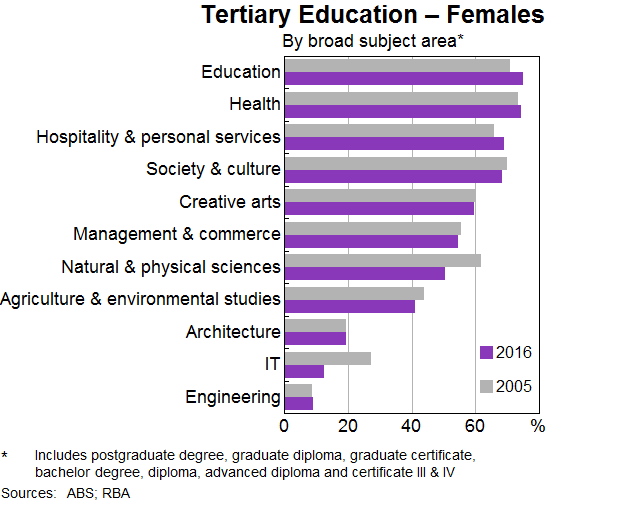
And it's hard to see how this will change much in the next decade or so, when we consider that the patterns of subject choices in higher education are not only quite sex-segregated, but have if anything become more so in recent years (Graph 9). Traditionally ‘female’ fields such as education, health and hospitality and personal services – all ‘caring professions’ – have become slightly more female-dominated over the past decade. Similarly, IT has long been a male-dominated field in this country, and current student enrolments are accentuating that trend.
A Dismally Male Profession?
To understand and interpret these trends, it helps to have a few people around who have trained in economics. Unfortunately, both in general and for female students, economics is not exactly popular in Australia. The previous graph showed that the decline in the female share of tertiary students in management and commerce over the past decade has only been marginal, and the student population is reasonably balanced between males and females. But for economics, the share of female university students has always been much lower and appears to have fallen further more recently. Even more concerning is that total student numbers in economics appear to have fallen at our universities over the past couple of decades, though some data show a small pick-up more recently.
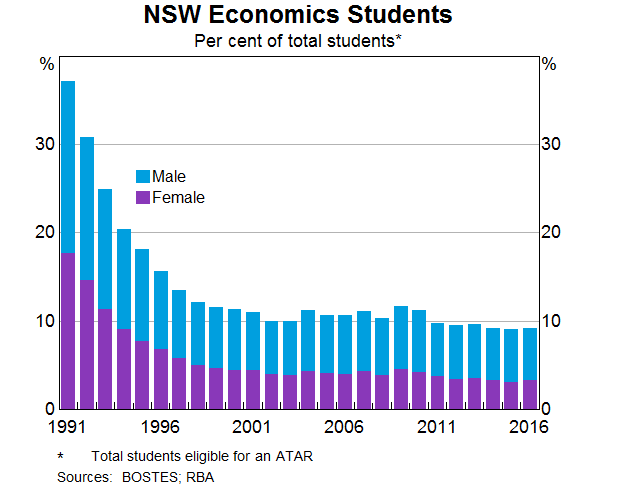
The picture is even worse at school level. Taking New South Wales just as an example, fewer students are doing economics in Year 12, and a declining proportion of that declining number are female (Graph 10). From what we understand, when business studies subjects were introduced, they expanded at the expense of economics. Most of that shift happened in the 1990s. I can't help wondering if the experience of the early 1990s recession, or the popular discussion at the time about ‘economic rationalism’ made economics somehow uncool. Or maybe business studies was seen as easier for students, or for teachers; or maybe general subjects are seen as better for employability. We just don't know.
At least we can say that it seems that the global financial crisis, which is considered in some quarters to represent a failure of economics as a discipline, did not have the same effect. In fact we hear from some students, young and old, who were inspired to study economics by the crisis. Maybe that has something to do with the small pick-up in total university student numbers recently.
Of course, it is not essential to have studied economics at school to select it as a major at university. Studying mathematics can be another path. To succeed in university economics studies, studying mathematics and statistics is actually very helpful. But this decline in school economics is a disquieting picture.
There is already a voluminous literature on the sex imbalance in the economics profession. Equality of the sexes is one of the areas where new data, and big data, have been instrumental in replacing pontification with evidence-based insight. We can no longer dismiss suggestions that treatment or representation of females are subject to negative biases and other disadvantages. From analysis of movie dialogue to matched-resume studies, evidence of bias now has statistical weight.
One piece of positive news from these new data sets is that in US academia, at least, evidence of raw bias is no longer present in most Science, Technology, Engineering and Maths (STEM) fields. Male and female academics who publish the same number of papers will on average have the same experiences in hiring and promotion (Ceci et al 2014). However, economics is an outlier; there is still apparent bias in those hiring and promotion decisions (Ginther and Kahn 2015). In an earlier paper, the authors summarised their results by saying, ‘It seems that once men have assistant professor status in economics, they get tenure irrespective of their publications, citations or background, while women … only receive tenure based more on observable traits’ (Ginther and Kahn 2004).[3] Some other recent research suggests that part of the problem arises because selection committees don't give female economists sufficient credit for their work when that work is co-authored with men (Sarsons 2016).
It is therefore not surprising that economics, unlike most other technical disciplines such as statistics, has not seen much increase in the share of PhDs granted to women or other metrics of the ‘pipeline’ to senior positions. Seeing few women in senior faculty positions, it is also no surprise that economics does not attract many women even at undergraduate level. This is especially disappointing, given that economics is so important to understanding aspects of everyday life, media commentary and public policy discourse.
One conclusion we can draw from this is that if there is some form of objective criteria for career progression, such as publications or profits, it is harder for unconscious biases to influence outcomes. But we also know from the same research that married men in STEM fields had better publication records on average than either single men or married and single women. This might suggest that women do not receive the same kind of spousal support of their careers, and therefore that publication records might overstate the underlying abilities of married men in academia. I do fear that organisations could do everything in their power to eliminate biases and obstacles to female participation, but that it won't be enough, because of the presumptions operating within at least some couples.
It isn't all bad news for equality of the sexes in economics, though, at least not at the Reserve Bank. Some concerted effort and rethinking of our recruitment strategies have resulted in a marked turnaround in the share of female graduates in our intake this year (Graph 11).[4]
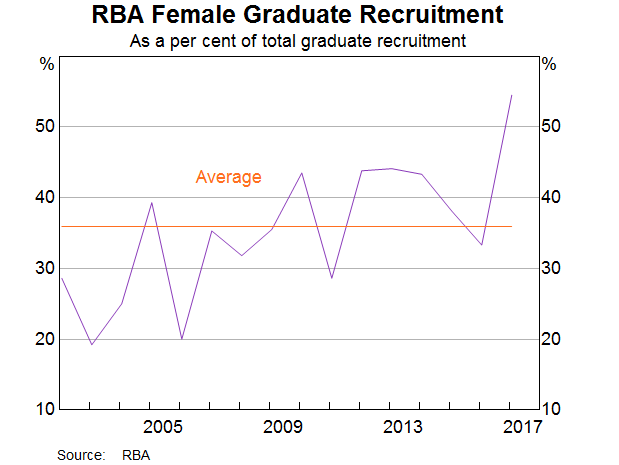
Contrary to what some people might fear, we didn't have to lower our standards. Nor did we have to recruit candidates from outside the family of disciplines we usually recruit from, such as economics, finance, law, mathematics and statistics. Instead:
- We engaged more intensively with universities so that students knew about the Reserve Bank as a place where one can have a rewarding career in an inclusive environment.
- We used separate teams for shortlisting and interviewing, to reduce unconscious biases at later stages of the selection process.
- We moved our recruitment campaign earlier and started fast-tracking the obviously good candidates to interview and decision before deciding on the full slate of interviewees.
I believe this last change was particularly important because we are competing with many other organisations for the best candidates, whether male or female. If we are later than our competitors, we never even see some candidates. By the time applications for jobs at the Reserve Bank opened, someone had already snapped them up. I believe that's especially relevant for the female candidates, though. In a male-dominated field where many employers are trying to rectify their gender balance, everyone is competing for the same strong female candidates.
Final Thoughts
I've touched on a lot of issues today, none in much detail. But I hope I have given a flavour of the complexity and the depth of the issues we face, both in economics and the economy more broadly. Equality of the sexes is essential if we are to achieve our economic potential as a nation. When someone faces bias or artificial obstacles, it holds all of us back. Overcoming those biases and unmaking those obstacles won't be easy, either in the profession or in other workplaces. But it is certainly worth doing, for both males and females, now and in future.
Thank you so much for your time. I wish the network every success.
Bibliography
Ceci SJ, DK Ginther, S Kahn and WM Williams (2014), ‘Women in Academic Science: A Changing Landscape’, Psychological Science in the Public Interest, 15(3), pp 75–131.
Daly MC (2016), ‘You Tell Me—Stop Leaving Talent on the Table: Achieving Diversity with No Excuses’, Medium.com site, 15 December. Available at <https://medium.com/diversity-without-excuses/stop-leaving-talent-on-the-table-achieving-diversity-with-no-excuses-c0719c60564b#.ehll2i76w>.
Dennison T and S Ogilvie (2014), ‘Does the European Marriage Pattern Explain Economic Growth?’, The Journal of Economic History, 74(3), pp 651–692.
Foreman-Peck J (2011), ‘The Western European marriage pattern and economic development’, Explorations in Economic History, 48(2), pp 292–309.
Ginther DK and S Kahn (2004), ‘Women in Economics: Moving Up or Falling Off the Academic Career Ladder?’, Journal of Economic Perspectives, 18(3), pp 193–214.
Ginther DK and S Kahn (2015), ‘Women's Careers in Academic Social Science: Progress, Pitfalls, and Plateaus', Boston University, January, unpublished manuscript. Available at <http://sites.bu.edu/shulamitkahn/files/2015/01/GintherKahn-SocSci-chapter.pdf>.
Goldin C (2016), ‘ A Pollution Theory of Discrimination: Male and Female Differences in Occupations and Earnings’, Human Capital in History: The American Record, University of Chicago Press, Chicago, pp 313–348.
Hajnal J (1965), ‘European marriage pattern in historical perspective ’, in D Glass and DEC Eversley (eds), Population in History, Arnold, London.
Sarsons H (2016), ‘Gender Differences in Recognition for Group Work’, Working Paper, unpublished manuscript. Available at <http://scholar.harvard.edu/files/sarsons/files/groupwork.pdf>.
Endnotes
Many thanks to Zoya Dhillon, Tanya Livermore and Tim Atkin for assistance with the graphs and other material in this talk, and to many other colleagues for helpful comments and suggestions. [*]
The pattern of marriage and child-bearing occurring mainly when people are in their late 20s is known as the ‘Western European marriage pattern’ and has been established for several centuries in European data (Hajnal 1965). There is some suggestion that the establishment of this pattern was instrumental in subsequent economic development (Foreman-Peck 2011), although this claim is contested (Dennison and Ogilvie 2014). If the claim is true, though, one is tempted to speculate whether the post-war decline in average ages of marriage and child-bearing had something to do with the decline in productivity growth observed in the 1970s. [1]
A useful recent contribution to this literature is Goldin (2016). [2]
The working paper version of the article described this more succinctly: ‘It seems that men get tenure irrespective of their merit (including publications). Women get tenure only if they merit it’. [3]
These figures group graduates by campaign year, not entry year: the last data point only includes staff starting in the 2017 cohort who were recruited in directly as graduates in 2016, rather than initially as summer interns in the summer of 2015/16. This is because our recruitment approach was changed for 2016, after those interns were interviewed and selected. Other central banks have had similar experiences: see, for example, Daly (2016) on the experience of the Federal Reserve Bank of San Francisco. [4]
