Speech Recent Trends in Australian Capital Flows
Introduction
Thanks to the AFR for inviting me to speak here today. I’m not going to talk about housing, I’m going to talk about something a bit more slow moving and lower frequency and that is capital flows to and from Australia and how the country funds its level of investment, which exceeds its level of aggregate saving. Though in saying that, it is worth noting that the aggregate level of saving in Australia is actually pretty high compared to other countries, it is just that investment is even higher.
For more than a century, Australia's high level of investment relative to saving has been supported by capital inflows from the rest of the world.[1] These net capital inflows are the financial counterpart to Australia's current account deficit. Foreign investment has been instrumental in expanding our domestic productive capacity and has been attracted by the favourable risk-adjusted returns on offer here.
Although net capital inflows have been a consistent feature of Australia's balance of payments, the composition of both the inflows, as well as the outflows when Australians invest offshore, has varied substantially over time.
When I spoke about capital flows a few years ago, I discussed the significant changes in the composition of capital flows that had taken place since 2007.[2] At that time, I highlighted three noteworthy developments: a marked increase in foreign direct investment in the mining sector associated with the mining investment boom; the significant change in flows to the Australian banking sector from sizeable inflows pre-crisis to around zero; and a substantial increase in foreigners' purchases of Australian government debt (Graph 1).
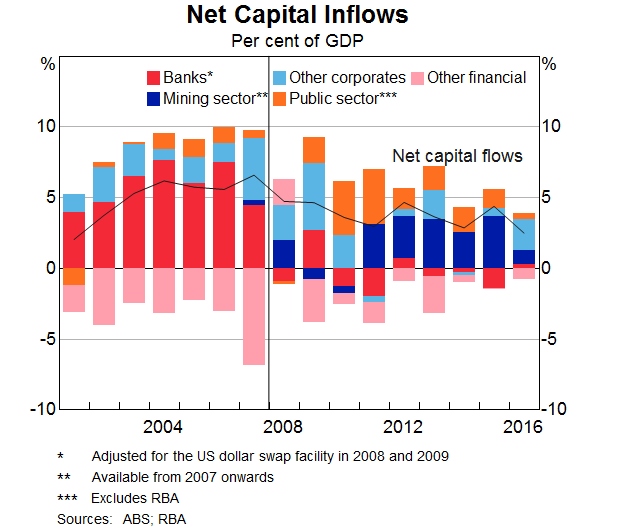
To a large degree, these trends have continued over the past three years (Table 1). But under the surface, there have been some significant changes in the composition of these flows in recent years. Today I would like to highlight some of these. A forthcoming RBA Bulletin article will discuss these trends in more detail.
| Average over: | |||
|---|---|---|---|
| 1998–2007 | 2008–13 | 2014–16 | |
| Private sector | 5.0 | 2.3 | 2.3 |
| Banks(b) | 5.4 | –0.2 | –0.5 |
| Other financials | –2.6 | –1.2 | –0.4 |
| Non-financials | 2.2 | 3.4 | 3.0 |
| Mining sector | n/a | 1.7 | 2.4 |
| Public sector | –0.1 | 2.1 | 1.2 |
| Total | 5.0 | 4.4 | 3.5 |
|
(a) Excludes households and the RBA Sources: ABS; RBA |
|||
Mining Sector
From 2008, a significant share of mining investment expenditure was funded through foreign direct investment in the form of reinvested earnings during a period when profitability in the mining sector was particularly high. In the balance of payments, these reinvested earnings – essentially calculated as profits less dividends – are generally treated as being notionally distributed to foreign owners in the net income component of the current account. The foreign owners are then deemed to notionally reinvest back into the firm. These notional capital flows are recorded in the financial account.[3] The money does not necessarily flow in and out of the country, it is just recorded as such in the balance of payments. The net capital inflows to the mining sector during the investment phase reflected the combined effect of the mining sector's high profitability (and low dividend payout ratio), its tendency to fund investment from internal sources and the very high degree of foreign ownership.[4]
In recent years the net inflows to the mining sector have continued to be large despite the large decline in mining investment spending from 9½ per cent of GDP in 2012 to around 3½ per cent of GDP currently. The inflows have continued, even as mining profits have declined with the fall in commodity prices (until very recently).[5] The continued strength of capital inflows has been supported by ongoing investment related to large liquefied natural gas (LNG) projects. LNG projects have made up a larger share of resource investment during this period than previously and many of these projects have an even higher foreign ownership share than the overall sector. These LNG projects have typically involved new joint ventures, where the majority of participants are foreign entities and are likely to have limited existing domestic operations with which to fund investment through profits. Accordingly, these inflows have mostly been in the form of direct funding from offshore rather than reinvested earnings.
In this context, it seems reasonable to expect net capital inflows to the mining sector to moderate in the future, with capital flows to the mining sector in recent quarters already starting to taper. This follows the transition of a number of large LNG projects from the investment phase into the production and export phase. While the increase in exports will support profits and, therefore, notional capital inflows to the mining sector, some of these profits are likely to be paid out to offshore owners as dividends rather than reinvested, an issue I will return to later when discussing the net income deficit.
Public Sector
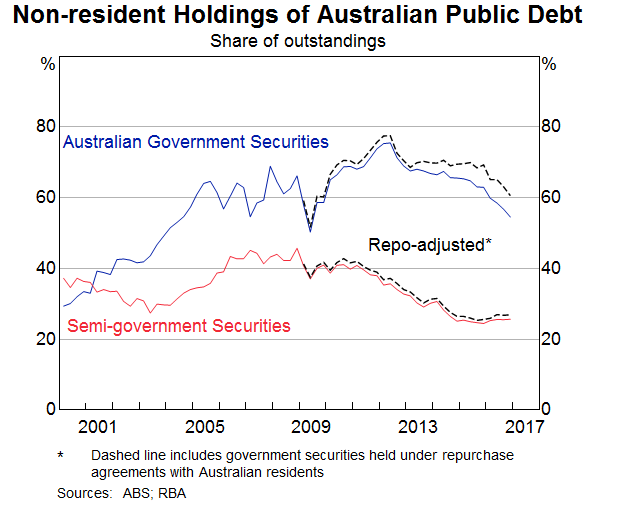
Turning to the public sector, foreigners have remained ongoing purchasers of Australian government debt, with the level of holdings continuing to rise over the past couple of years. Flows into government bonds have nonetheless moderated, and have not kept pace with the increase in net issuance. At face value, the headline statistics show that the foreign ownership share of government bonds has declined by around 20 percentage points since its peak in 2012.
However, the extent of the decline is overstated. Part of this decline is a reflection of foreigners becoming considerably more active in the management of their government bond holdings, rather than a decreased appetite to hold Australian government bonds. In particular, part of the decline in the foreign ownership share reflects an increase in collateralised lending of Australian Government Securities (AGS) to Australian repo dealers.[6] Such lending activity – which grew particularly strongly over 2013–14 – is captured in the statistics as a sale of AGS by a foreigner to their domestic counterparty. This is despite economic ownership remaining with the foreign lender (who has the obligation to buy back similar securities at some stage in the future). Adjusting the level of foreign ownership to account for this collateralised lending shows that the decline in the foreign ownership share of AGS has been around 5 percentage points smaller (Graph 2).
Banking Sector
The aggregate pattern of capital flows to the banking sector has not changed materially since I last spoke on this topic. Since 2014 – and indeed over the period since the financial crisis – there have been minimal net capital flows to or from the banking sector. Following the shift away from offshore wholesale debt towards domestic deposits that took place in the wake of the global financial crisis, the funding composition of banks has remained relatively stable. But notwithstanding this stability, recently there have been two noteworthy developments relating to short-term debt, both stemming from regulatory reforms.
Firstly, over the past year or so, Australian banks have reduced their short-term debt issuance in preparation for the introduction of the Net Stable Funding Ratio (NSFR) next year (Graph 3). The NSFR provides an incentive for banks to shift to sources of funding considered to be more stable and away from sources such as short-term wholesale liabilities.
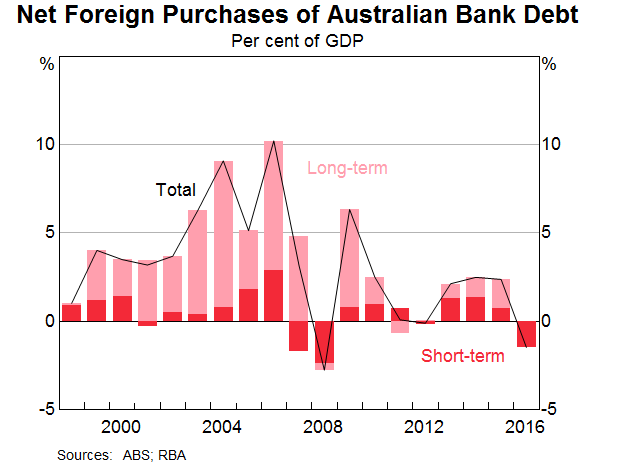
Secondly, the composition of Australian banks' short-term offshore funding has also changed following the implementation of US Money Market Fund (MMF) reforms by the Securities and Exchange Commission in October 2016. As a result of these reforms, the value of assets under management of prime MMFs (those that lend to banks) has fallen by US$1 trillion or around 70 per cent over the past couple of years. Some prime funds have switched to become government-only funds, that is, funds that invest only in US government debt. At the same time, investors have allocated away from prime funds to government-only funds. Although prime MMFs have maintained their exposure to Australian banks relative to banks globally (at around 8 per cent of total MMF exposures to banks), their holdings of Australian bank debt have declined from around US$100 billion to under US$30 billion currently.
However, in aggregate, Australian banks have continued to raise almost as much short-term funding from US commercial paper markets, despite the decline in MMFs. They have been able to tap other investors, in particular US corporates with large cash holdings, such as those in the technology sector.
Australia's Net Foreign Liability Position
Having talked about capital flows, I will now turn to the stocks, which are the accumulation of all these flows (plus valuation effects). Australia's net foreign liability position has been relatively stable as a share of GDP for more than a decade, before increasing a little recently to be around 60 per cent of GDP (Graph 4). Slightly more than all of Australia's net liabilities are in the form of debt as the country has had a small net equity position in recent years. That is, since 2013, the level of Australian investment in foreign equity has exceeded the level of foreign investment in Australian equity. This reflects the sizeable offshore equity investment of the Australian superannuation sector as well as foreign exchange valuation effects, with the depreciation of the Australian dollar since 2013 increasing the Australian dollar value of our foreign equity investments.
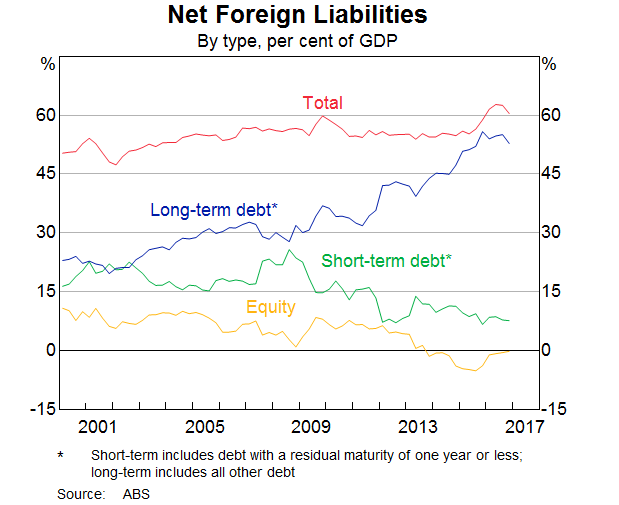
Today the majority of Australia's debt liabilities are long-term, which is a significant change from a decade ago. Long-term debt liabilities are currently around 50–55 per cent of GDP, up from around 30 per cent prior to the financial crisis. The post-crisis shift towards longer-term debt was a result of two factors: banks lengthening the tenor of their debt on issue as well as the shift from bank debt towards government debt, which tends to have a relatively longer tenor.[7] Short-term debt liabilities are around their lowest share of GDP in two decades.
Net Income Deficit
I will finish by looking at the cost of servicing those liabilities. Over recent years, one of the more interesting trends has been the decline in the net income deficit. The net income deficit reflects the returns on foreign holdings of Australian assets compared with Australian holdings of foreign assets, be it in the form of interest, dividends or reinvested earnings. Australia has had a net income deficit since at least 1960 – a direct consequence of the net foreign liability position.
Since late 2010, Australia's net income deficit, as a per cent of GDP, has narrowed to be around its lowest level since the Australian dollar was floated (Graph 5). This has been associated with a narrowing of the current account deficit to its lowest share of GDP since the early 1980s. There are two distinct periods with different drivers behind this.
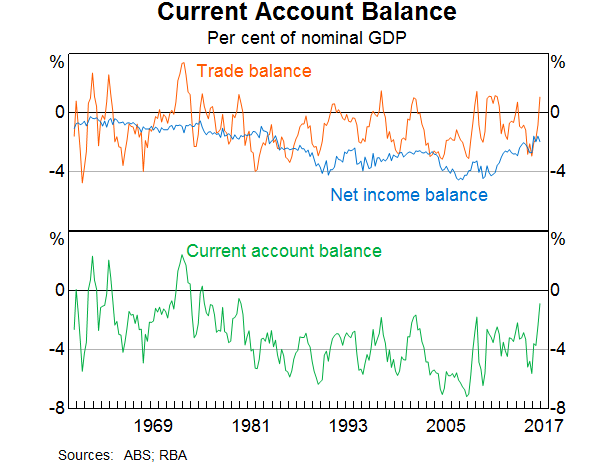
The narrowing in the net income deficit from late 2010 to late 2013 mostly reflected a decline in income payments on Australians' foreign debt and equity liabilities.[8] The lower average yield paid on Australian foreign debt was due to a combination of declines in Australian interest rates and an increase in the share of Australia's foreign debt attributable to the Australian Government, which pays a lower rate of interest than private sector borrowers. The decline in the payments on equity liabilities was a result of lower profitability of the mining sector. Because Australia's mining sector is majority foreign owned, a reduction in the profitability of that sector gives rise to smaller payments to the foreign owners, either in the form of dividend payments or reinvested earnings, thereby reducing the net income deficit.
Since 2013, the reduction in the net income deficit has instead reflected an increase in returns on Australian residents' offshore equity holdings. These increased returns are directly related to the determinants of the shift towards a net equity asset position that I just touched on: namely, continued flows into offshore equity by Australian superannuation funds and the depreciation of the exchange rate, which increases the Australian dollar value of dividend receipts.
In the most recent national accounts, profits of private corporations rose by more than 15 per cent – the second largest increase in the history of the accounts – driven by a huge rise in profitability in the mining sector, in turn a reflection of the recent sharp rise in the prices of coal and iron ore. Based on company announcements, some of these profits are likely to be distributed to foreign owners as dividends. Moreover, to the extent that mining sector profits remain high over the next quarter or so, we could expect to see income outflows as these profits are distributed to foreign owners, all other things being equal. This is likely to increase the net income deficit in coming quarters, but not contribute to gross capital inflows to the mining sector, in contrast to previous periods of high profitability, when profits were reinvested to fund increased investment spending.
Concluding Remarks
To conclude, the main purpose of my speech today has been to highlight some trends in capital flows that have taken place over the past few years. By and large these trends have, on the surface, continued the patterns of previous years, but disaggregating a little further reveals some noteworthy trends. Firstly, sizeable capital inflows have continued to fund mining investment, in particular large LNG projects. Whereas these (notional) flows during the mining investment boom mostly reflected reinvested earnings, much of the more recent flows have been (actual) transfers from offshore affiliates. As these LNG projects transition into the production and export phase, we would expect to see these inflows moderate. Moreover, some of these profits are likely to be paid out to offshore owners as dividends rather than reinvested. Secondly, there has been continued appetite from foreign investors for Australian government debt, but this needs to be measured carefully given the increased participation of foreign investors in the domestic repo market. The third development has been the continuation of little net capital flows either to or from the banking sector, but, within that, a notable change in the composition of the investor base, particularly for short-term debt.
Endnotes
Thanks to Sue Black, Blair Chapman and Callan Windsor for their help in preparing this talk. [*]
See Belkar R, L Cockerell and C Kent (2007), ‘Current Account Deficits: The Australian Debate’, RBA Research Discussion Paper No 2007-02. [1]
See Debelle G (2014), ‘Capital Flows and the Australian Dollar’, Address to the Financial Services Institute of Australia, 20 May. [2]
See RBA (2011), ‘Box B: The Mining Sector and the External Accounts’, Statement on Monetary Policy, November, pp 42–44. [3]
I have discussed this previously. See Debelle G (2013), ‘Funding the Resources Investment Boom’, Address to the Melbourne Institute Public Economic Forum, Canberra, 16 April. [4]
The fall in commodity prices led to lower mining sector profits (after dividends). For a more detailed discussion, see Bergmann M (2016), ‘The Rise in Dividend Payments’, RBA Bulletin, March, pp 47–56. [5]
See Becker C, A Fang and JC Wang (2016), 'Developments in the Australian Repo Market', RBA Bulletin, September, pp 41–46. [6]
See Stewart C, B Robertson and A Heath (2013), ‘Trends in the Funding and Lending Behaviour of Australian Banks’, RBA Research Discussion Paper No 2013-15. [7]
See Ma S (2014), ‘Why has the Net Income Deficit Narrowed’, RBA Bulletin, June, pp 19–26. [8]
