Speech Some Evolving Questions
It is a pleasure for me to speak at the annual dinner of the Australian Business Economists. I have spoken at this dinner three times before: in 2010, 2012 and 2014. Thank you for inviting me back.
When I spoke in 2012 the title of my remarks was ‘What is Normal?’[1] On that occasion, I talked about a recalibration in expectations about what was considered normal in the Australian economy. I also suggested that the normal level of interest rates might be lower than it was in the past.
Five years on, we are still searching to understand what is normal.
In a number of countries, low rates of unemployment are coexisting with below-average inflation. Low inflation, in turn, means low interest rates. Many investors judge that this unusual combination of low unemployment and low inflation can persist for quite some time – perhaps, that it is now normal. With inflation rates having surprised on the downside for a few years now, there is unusually low compensation for future inflation risk in many financial markets.
Real income growth for many households has also been unusually slow in many countries. Not surprisingly, these households, including many here in Australia, wonder whether this slow growth in incomes is now the new normal, or whether in time it will pass. Much depends upon the answer to this, including households' appetite and ability to spend and borrow.
So we are still searching for what is normal.
Tonight, I would like to use this opportunity to reflect on some of the questions we have been grappling with at the RBA over the year or so that I have had the privilege of being the Governor. A number of these questions go to what could be considered normal these days. While I am not able to give you a full suite of answers, I hope that you find the transparency around our thinking useful.
There are three sets of questions that have occupied much of our time over the past year.
The first is how the final stages of the transition to lower levels of mining investment would play out.
The second is the degree to which an improving labour market would translate into a pick-up in wage growth and inflation.
And the third is the nature of risks stemming from high and rising levels of household debt and how to deal with those risks.
I will talk about each of these three issues and then conclude with how they have influenced the Reserve Bank Board's decisions on monetary policy over the past year or so.
The End of the Transition
For a number of years we have been describing the economy as being in transition: a transition from very high levels of mining investment to something more normal.
It is now time, though, to move to a new narrative. The wind-down of mining investment is now all but complete, with work soon to be finished on some of the large liquefied natural gas projects. Mining investment, as a share of GDP, is now back to something more normal (Graph 1). This means that, as I talked about in a recent speech, it's time to open a new chapter in Australia's economic history.
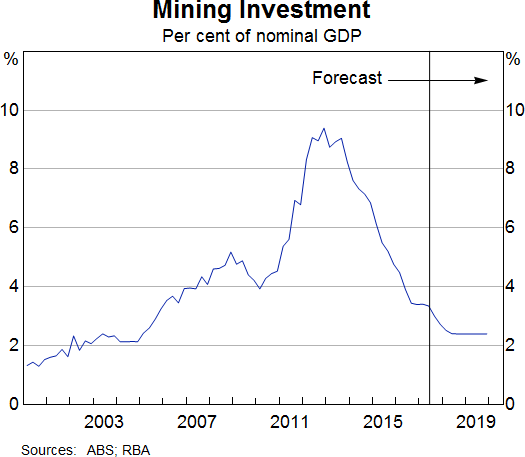
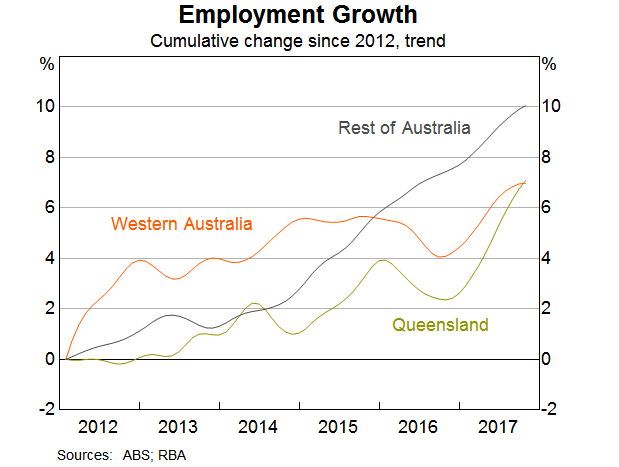
Over recent times, our judgement has been that this transition to lower levels of mining investment was masking an underlying improvement in the Australian economy. The decline in mining investment generated substantial negative spillovers to the rest of the economy. These spillovers were most evident in Queensland and Western Australia, where, for a while, growth in employment, investment and income were all quite weak.
The good news is that these negative spillovers from lower levels of mining investment are now fading. This was first evident in Queensland, where the labour market began to improve in 2015 (Graph 2). It is now evident too in Western Australia, where conditions in the labour market have improved noticeably since late last year. Elsewhere, there has been steady growth in employment for a number of years.
The fading of the negative spillovers is one reason why growth in the Australian economy is expected to strengthen over the period ahead. Another is the higher volume of resource exports as a result of all the mining investment. We expect GDP growth to pick up to average a bit above 3 per cent over 2018 and 2019 (Graph 3). If these forecasts are realised, it would represent a better outcome than has been achieved for some years now.
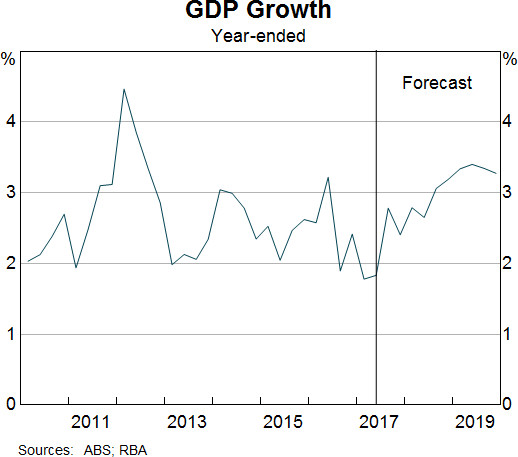
This more positive outlook is being supported by an improving world economy, low interest rates, strong population growth and increased public spending on infrastructure. All these things are helping.
Encouragingly, the outlook for business investment has brightened. For a number of years, we were repeatedly disappointed that non-mining business investment was not picking up. Part of the explanation was the negative spillover effects that I just spoke about, although, as my colleague Guy Debelle spoke about last week, there were other factors at work as well.[2] Now, though, a gentle upswing in business investment does seem to be taking place and the forward indicators suggest that this will continue. It's too early to say that animal spirits have returned with gusto. But more firms are reporting that economic conditions have improved and more are now prepared to take a risk and invest in new assets. This is good news for the economy.
The improvement in the business environment is also reflected in strong employment growth. Over the past year, the number of people with jobs has increased by around 3 per cent, the fastest rate of increase for some time (Graph 4). This pick-up in jobs is evident across the country and has been strongest in the household services and construction industries. It is also leading to a pick-up in labour force participation, especially for women.
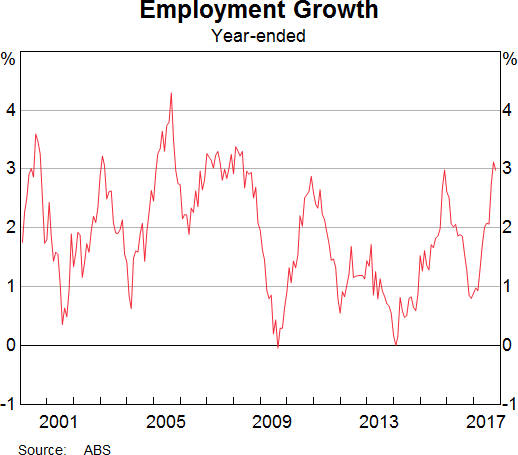
Business is feeling better than it has for some time and it is lifting capital spending and creating more jobs.
At the same time, though, growth in consumer spending remains fairly soft. Indeed, for a number of years consumption growth has been weaker than we had originally forecast.[3] This is evident in this chart, which shows our forecasts for consumption growth at various points in time as well as the actual outcomes (black line) (Graph 5). The picture is pretty clear. For some years, consumption growth has been weaker than forecast and it has not exceeded 3 per cent for quite a few years.
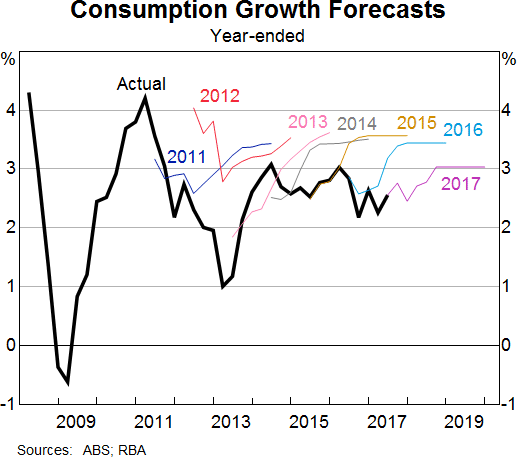
The most likely explanation for the ongoing subdued consumption outcomes is the combination of weak growth in real household income and the high level of household debt. Given the persistence of these factors, our latest forecasts have incorporated a flatter profile for consumption growth than has been the case in previous forecasts.
An important issue shaping the future is how these cross-cutting themes are resolved: businesses feel better than they have for some time, but consumers feel weighed down by weak income growth and high debt levels.
Our central scenario is that the increased willingness of business to invest and employ people will lead to a gradual increase in growth of consumer spending. As employment increases, so too will household income. Some increase in wage growth will also support household income. Given these factors, the central forecast is for consumption growth to pick up to around the 3 per cent mark. This would be above the average growth of consumption for the current decade, but below the average for the period prior to the financial crisis.
Labour Market, Wages and Inflation
I would like to turn to the second question that has occupied us over much of the past year: the degree to which an improving labour market will translate into a pick-up in wage growth and inflation.
A distinguishing feature of Australia's recent economic performance has been the slow growth in wages. The Wage Price Index has increased by just 2 per cent over the past year. Whereas in earlier years, Australians had got used to average wage increases of around the 3½–4 per cent mark, 2–2½ per cent is now the norm (Graph 6). Growth in average hourly earnings has been weaker still: in trend terms it is running at the lowest rate since at least the 1960s. Not only are wage increases low, but some people had been moving out of high-paying jobs associated with the mining sector into lower-paying jobs. We have heard from our liaison program that there has been downward pressure on non-wage payments, including allowances, and an increase in the proportion of new employees hired on lower salaries than their predecessors.
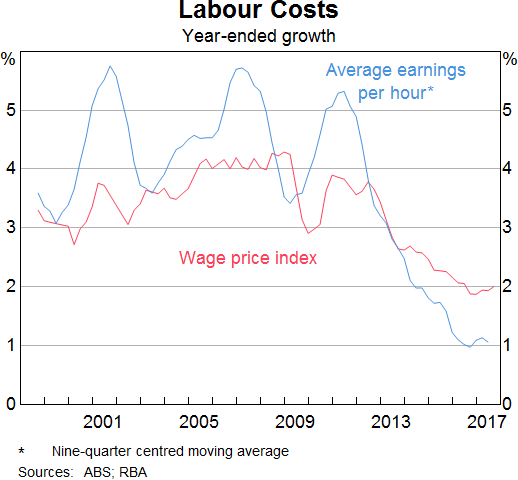
As I noted earlier, subdued growth in wages is also occurring in a number of other countries. Understanding this is a major priority. Low growth in wages means low inflation, which means low interest rates, which means high asset valuations. So a lot depends on understanding the reasons for slow growth in nominal and real wages. The answer is likely to be found in a combination of cyclical and structural factors.
In Australia, we are still some way short of our estimates of full employment of around 5 per cent, so it is not surprising that wage growth is below average.
But structural factors are likely to be at work as well. Foremost among these are perceptions of increased competition.
Many workers feel there is more competition out there, sometimes from workers overseas and sometimes because of advances in technology. In the past, the pressure of competition from globalisation and from technology was felt most acutely in the manufacturing industry. Now, these same forces of competition are being felt in an increasingly wide range of service industries. This shift, together with changes in the nature of work and bargaining arrangements, mean that many workers feel like they have less bargaining power than they once did.
But this is not the full story. It is likely that there is also something happening on the firms' side as well. In other advanced economies where unemployment rates are below conventional estimates of full employment, the normal tendency for firms to pay higher wages in tight labour markets appears to be muted. Businesses are not bidding up wages in the way they might once have. This is partly because business, too, feels the pressure of increased competition.
One response to this competitive pressure is to have a laser-like focus on containing costs. Over recent times there has been a mindset in many businesses, including some here in Australia, that the key to higher profits is to reduce costs. Paying higher wages can sit at odds with that mindset.
Given these various effects, it is plausible that, at least for a while, the economy is less inflation prone than it once was. Both workers and firms feel more competition, and it is plausible that the wage- and price-setting processes are adjusting in response.
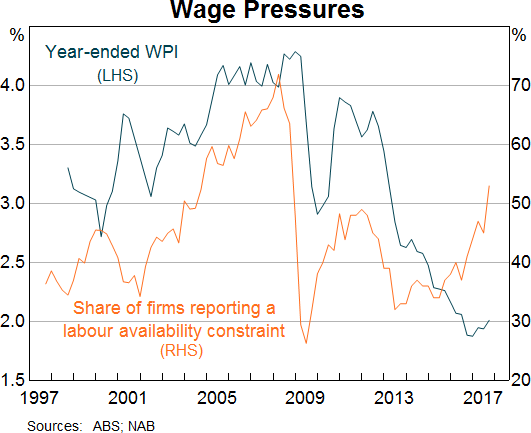
This, of course, does not mean that the normal forces of supply and demand have been abandoned. Tighter labour markets should still push up wages and prices, even if it takes a little longer than we are used to. We are starting to see some hints of this in the Australian labour market. Business surveys report that firms are having more difficulty finding suitable labour than they have for some time (Graph 7). In the past, when firms found it difficult to find suitable labour, higher growth in wages resulted. Consistent with this, we are hearing reports through our liaison program that in some pockets the stronger demand for workers is starting to push wages up a bit. We expect that as employment growth continues, these reports will become more common.
Another factor that has a significant bearing on the outlook for inflation is the increased competition in the retail industry. I spoke a few moments ago about how, globally, increased competition is affecting pricing dynamics. Australian retailing provides a very good example of this. Competition from new entrants is putting pressure on margins and is forcing existing retailers to find ways to lower their cost structures. Technology is helping them to do this, including by automating processes and streamlining logistics. The result is lower prices.
For some years now, the rate of increase in food prices has been unusually low. A large part of the story here is increased competition. The same story is playing out in other parts of retailing. Over recent times, the prices of many consumer goods – including clothing, furniture and household appliances – have been falling (Graph 8). Increased competition and changes in technology are driving down the prices of many of the things we buy. This is making for a tough environment for many in the retail industry, but for consumers, lower prices are good news.
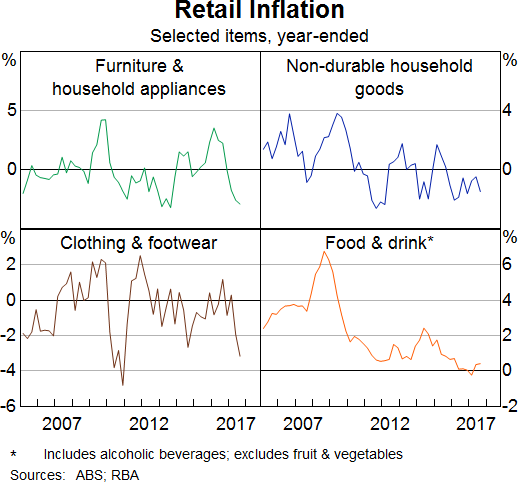
A question we are grappling with here is how much further this process has to run. It is difficult to know the answer, but our sense is that the impact of greater competition on consumer prices still has some way to go as both retailers and wholesalers adjust their business models. So this is likely to be a constraining factor on inflation for a while yet.
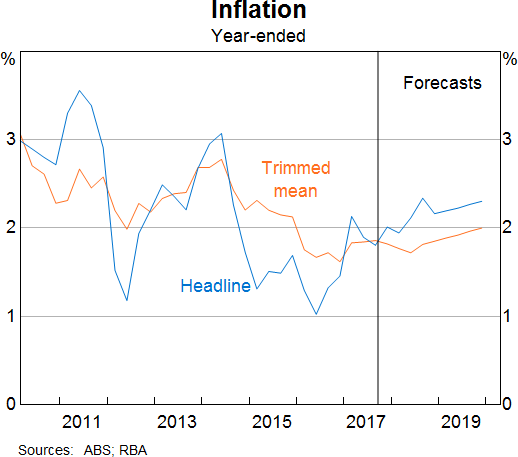
Putting all this together, we expect inflation to pick up, but to do so only gradually (Graph 9). By the end of our two-year forecast period, inflation is expected to reach about 2 per cent in underlying terms, and a little higher in headline terms because of planned increases in tobacco excise. Underpinning this expected lift in inflation is a gradual increase in wage growth in response to the tighter labour market.
High and Rising Household Debt
The third question we have focused on over recent times is the implications of the high and rising level of household debt.
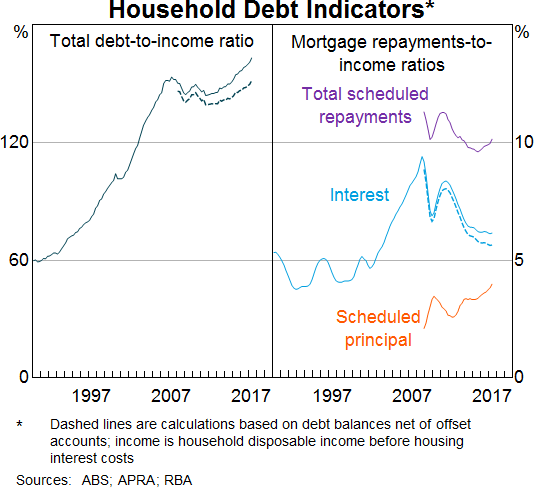
The growth in household debt has been outpacing the very low growth in household incomes for a few years now. As a result, the household debt-to-income ratio has risen, although if account is taken of the increased balances held in offset accounts the rise is less pronounced (Graph 10). The low level of interest rates means that even though debt levels are higher, the share of household income devoted to paying mortgage interest is lower than it has been for some time. Perhaps reflecting this, as well as the recent decline in the unemployment rate, aggregate indicators of household financial stress remain quite low.
The central issue here is how the high levels of debt affect the stability of the economy over the medium term. Our concern has not been the stability of the banking system; the banks are strong and they are well capitalised. Rather, the concern has been that as the household sector takes on ever-more debt relative to its income, the risk of medium-term problems increases. This is especially so when this debt is taken on in an unusually low-interest rate environment.
It is difficult to be precise about exactly how much this risk has increased, but our judgement has been that, should earlier trends have continued, the risk of future problems would have continued to increase. A scenario we have focused on is the possibility of a future shock that causes households to abruptly reassess their past borrowing decisions. In this scenario, consumption might be wound back sharply to put balance sheets on a sounder footing. If this occurred, it could turn an otherwise manageable shock into something more serious.
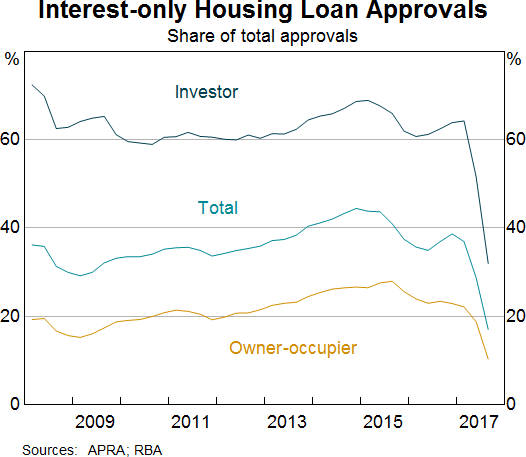
One way of guarding against this risk is for lenders to maintain strong lending standards. The various steps taken by the Australian Prudential Regulation Authority (APRA) – with the strong support of the Council of Financial Regulators – have worked in this direction. Growth in lending to investors has slowed, fewer loans are being made with very high loan-to-valuation ratios, debt-servicing tests have been tightened and fewer interest-only loans are being made. The latest data suggest that the banks have more than succeeded in reducing interest-only lending to below the 30 per cent benchmark (Graph 11). These are all positive developments but it is an area we, together with the Council of Financial Regulators, continue to watch closely.
Recently, we have also seen some cooling in the Sydney property market. This reflects a combination of factors, including increased supply of new dwellings, some tightening of credit conditions, higher interest rates on loans to investors and some reduction in offshore demand. The increasing unaffordability of prices for many people has also probably played a role. In Melbourne, where the population is growing very strongly, housing prices are still increasing faster than incomes, although the rate of increase has slowed. Elsewhere, housing prices have been little changed over recent months. Conditions are subdued in Brisbane, where the supply of apartments has increased significantly, and remain weak in Perth, owing to slowing population growth following the unwinding of the mining investment boom.
It is important to be clear that the RBA does not have a target for housing prices. But a return to more sustainable growth in housing prices does reduce the medium-term risks. These risks have not gone away, but the fact that they are not building at the rate they have been is a positive development.
Monetary Policy
I would like to conclude with what all this has meant for monetary policy over the past year or so.
As you are aware, the Reserve Bank Board has kept the cash rate unchanged at 1.5 per cent since August last year.
In the early part of that period, a central issue was balancing the need to support the economy in the final days of the transition to lower levels of mining investment against the risks stemming from rising household debt. Lower interest rates might have provided a bit more support, but would have done so partly by encouraging people to borrow yet more money, thus adding to the risks. The Board's judgement was this would not have been consistent with its broad mandate for economic stability. Accordingly, with the economy expected to pick up and the unemployment rate to come down gradually as the mining investment transition came to an end, the Board judged it appropriate to hold the cash rate at 1.5 per cent. We were prepared to be patient in the interests of medium-term economic stability.
As the year progressed, we became somewhat more confident that the expected pick-up in growth would materialise. The strengthening in the global economy has helped here. So too has the lift in employment and the better outlook for investment. This improvement meant that the case for lower interest rates weakened over the year.
Also, as the year progressed, one issue the Board paid increasing attention to was the persistently weak growth in wages and household incomes and the implications for consumption. A related issue is the effect of increased competition on the wage and price dynamics in the economy. As I said earlier, we are still trying to understand this. It does, though, look increasingly likely that these factors will mean that inflation remains subdued for some time yet. We still expect headline inflation to move above 2 per cent on a sustained basis, but it is taking a bit longer to get there than we had earlier expected.
So, in summary, over the past year or so there has been progress in moving the economy closer to full employment and in having inflation return to the 2 to 3 per cent range. Both of these are positive developments and suggest a more familiar normal is still in sight. Progress on these fronts has been made while also containing the build-up of risks in household balance sheets.
We still, though, remain short of full employment, and inflation is expected to pick up only gradually and remain below average for some time yet. This means that a continuation of accommodative monetary policy is appropriate. If the economy continues to improve as expected, it is more likely that the next move in interest rates will be up, rather than down. But the continuing spare capacity in the economy and the subdued outlook for inflation mean that there is not a strong case for a near-term adjustment in monetary policy. We will, of course, continue to keep that judgement under review.
Thank you for listening and I look forward to answering your questions.
Endnotes
I would like to thank Andrea Brischetto for assistance in the preparation of this talk. [*]
Lowe P (2012), ‘What is Normal?’, Address to the Australian Business Economists Annual Dinner, Sydney, 5 December. [1]
Debelle G (2017), ‘Business Investment in Australia’, Speech at UBS Australasia Conference 2017, Sydney, 13 November. [2]
In contrast, the forecasts for GDP growth have been much closer to the actual outcomes and the unemployment rate has often been lower than forecast. [3]
