Bulletin – February 2000 The Economy and Financial Markets
Download the complete Statement 301KB
Introduction
The Australian economy recorded strong growth through the second half of 1999. Domestic demand was robust, led by household spending. In addition, demand for Australian exports began to recover, with the result that the growth of GDP remained above 4 per cent.
These trends parallel those seen overseas. The United States economy has maintained strong growth, the majority of countries in east Asia have recovered much more quickly than expected, and growth in Europe is also firming. Indicators for Japan are more mixed, but generally suggest a very gradual recovery is under way. Estimates of global growth outcomes in 1999 are higher than forecasts of a few months ago, and forecasts for 2000 have been revised up. A number of commodity prices have risen sharply as a result of these firmer trends, and central banks in a number of countries have raised interest rates from the low levels of recent years.
The extent of this strength through the past year, both at home and abroad, was unexpected. For Australia, the effects of the Asian crisis, and the ensuing decline in global growth, had been thought likely to result in a more noticeable and more prolonged slowing in the pace of activity. Exports did weaken during this period, but domestic demand surprised most forecasters by its resilience. Several factors have been at work in producing this outcome. Some of them, like the impact of demutualisations and privatisations, were only temporary. More persistent, and more substantial, support for household demand has come from gains in wealth across major asset classes, and inexpensive and freely available credit. This combination, together with income gains stemming from faster employment growth, has facilitated a strong expansion of consumption, and an increase in spending on housing. There has been an accompanying increase in gross household debt, but household balance sheets remain in reasonably good shape at this stage, since the rise in debt over the past several years came off a rather low base.
It is likely that relatively robust growth in activity will continue during the coming year. Even were some slowing of domestic demand to occur in the first half of 2000 – and there is little sign of that at present – growth is likely to be sustained at a strong pace, notwithstanding some tailing off in some areas of construction.
The strength of output growth has resulted in an acceleration in employment, which rose at an annualised pace of 3½ per cent during the second half of 1999, its strongest performance in more than four years. The rate of unemployment, just under 7 per cent on average in the December quarter, was at its lowest in almost a decade, with the prospect that a further decline will take place during the current year. Surveys of employers show some increased difficulty in attracting suitable staff. This suggests that while growth in labour costs has been moderate to date, some heightened pressure on wages could occur during the next year or two.
Price inflation has increased over the past year, despite the fact that wages growth has not picked up. The Consumer Price Index rose by 1.8 per cent through 1999, a little faster than the rise in 1998. Were it not for the effect of the changes to health insurance arrangements last March, the CPI increase would have been around 2¼ per cent. Some of the pick-up is due to the effect of higher international oil prices, which have flowed through to petrol prices at the pump in Australia as in other countries. But core measures of inflation, which are not distorted by the direct impact of changes in oil prices, have also been increasing, running at between 2 and 2½ per cent during 1999, compared with around 1½ per cent during 1998.
During the first half of 2000, the Bank expects CPI inflation on a year-ended basis to rise to around 2¾ per cent. Core inflation will probably be a little lower than that, but on any measure, inflation will be in the 2–3 per cent target zone, and probably in the upper half of it. During the September quarter, the CPI will record a sharp increase as a result of the introduction of the Goods and Services Tax. While CPI rises in subsequent quarters are likely to be quite modest, on a year-ended basis the rate of CPI inflation will exceed the 2–3 per cent target, by a large margin, for four quarters. The Bank will, however, abstract from the GST effect for the purposes of assessing the appropriate stance of monetary policy. The Bank is expecting inflation to decline back to 2–3 per cent after the initial GST impact has been seen. Prospects for this are still reasonable, though an environment of strong output and employment growth over the coming year could heighten risks of more persistent inflationary pressures.
Financial markets were relatively quiet during the closing months of 1999, with financing and risk-taking activities curtailed on account of the possibility of problems being encountered with the century date change. That event passed without incident, but so far in 2000, financial markets, both in Australia and overseas, have been volatile, reflecting the tensions between strengthening economic activity and rising interest rates. Bond yields have risen due to expectations of higher inflation, and as a result of recent tightenings of monetary policy.
In considering Australian monetary policy, the Bank judged that, notwithstanding the increase in cash rates in November, policy remained too accommodative. Given the unexpectedly strong growth outcomes in 1999, and improved prospects for 2000, that degree of support for the economy was clearly no longer necessary, particularly given that inflation was already gradually increasing. Looking ahead, moreover, the balance of risks on inflation is no longer tilted to the downside. Expectations of inflation are considerably higher than a year ago, the disinflationary forces from abroad, while still discernible in some areas, are more likely to wane than to intensify, and the extent of spare capacity in the domestic economy is gradually diminishing. In addition, the substantial increases in some asset prices and credit over the past couple of years raise a question mark. While asset prices per se are not a target of monetary policy, it is important that monetary policy not inadvertently sow the seeds of future instability by encouraging excessive use of credit. It could be, of course, that developments in asset markets are well-grounded and benign. If so, they will not be much affected by a modest rise in borrowing costs.
These considerations all pointed to the need for an adjustment to interest rates, to take them to an approximately neutral setting. The Bank raised cash rates by a further 50 basis points, to 5½ per cent, on 2 February. As with the previous adjustment in November, this change is not intended to end the economic expansion. Growth should be quite good, but by keeping interest rates aligned with the economy's changing circumstances, monetary policy will be reducing the likelihood of imbalances emerging which could impair the longevity of the expansion.
Overseas Economic Developments
The Americas
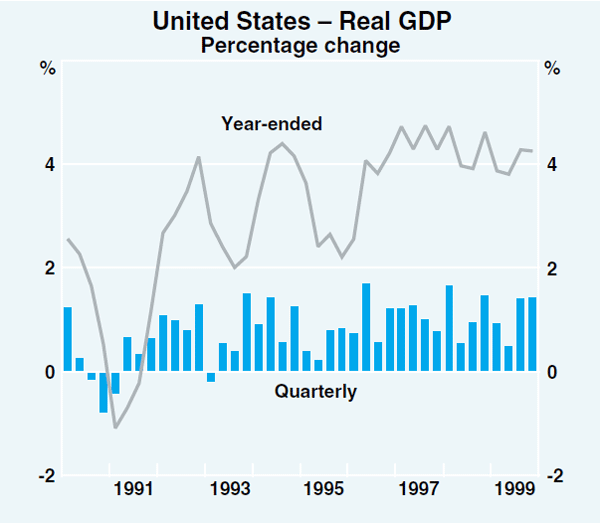
The United States economy continued to grow strongly during the second half of 1999. Output expanded at an annual rate of 5¾ per cent, with growth in consumer spending at around the same rate (Graph 1). The ongoing strength in consumption reflects continuing robust employment growth and high levels of consumer confidence. Consumer spending is also being supported by the rising levels of household wealth seen in recent years. Increases in longer term interest rates earlier in the year do not appear to have significantly slowed business investment, which grew at an annual rate of 6.6 per cent in the second half of 1999, although housing investment has weakened.
US export growth increased over the second half of last year, reflecting the continuing improvement in international conditions. As a result, manufacturing output is accelerating, with growth in this sector continuing to be dominated by the production of computers and communication equipment. Surveys suggest that businesses expect conditions in the manufacturing sector to improve further in coming months. Despite the pick-up in exports, the current account deficit is likely to have expanded in the December quarter, with imports growing rapidly, reflecting the strength of domestic demand.
The ongoing strength in demand and tight labour market conditions may now be having a discernible impact on wage and price inflation (Graph 2). Growth in the employment cost index is showing renewed signs of increasing, although at 3.4 per cent over the year to December, it remains below rates prevailing during late 1998. The recent data show a pick-up in growth in non-wage benefits and confirm that the easing in wage and salaries growth, apparent during much of 1998 and early 1999, has now come to an end.
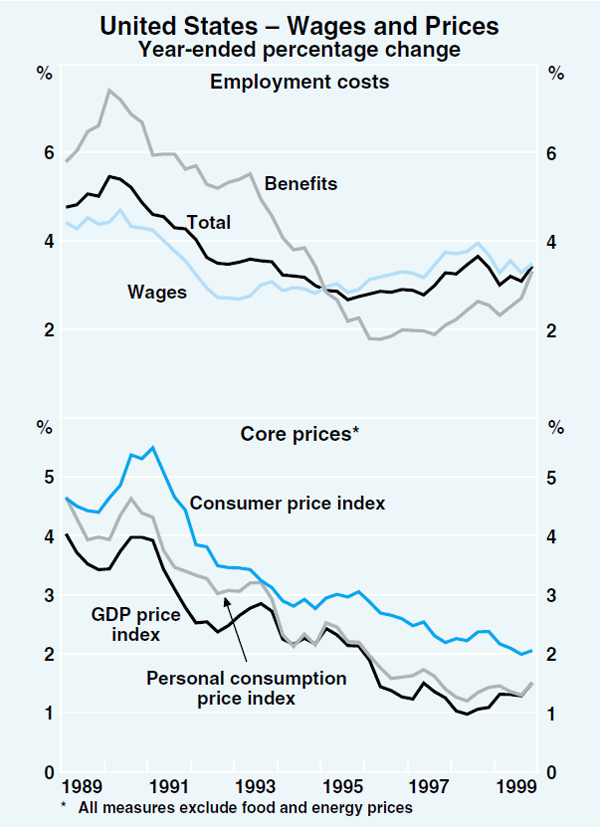
Headline consumer price inflation has also increased since early 1999, due primarily to increases in oil and tobacco prices. While the core measure of consumer price inflation continues to drift lower, other measures of core inflation, derived from the national accounts price indices for personal consumption and GDP, have increased a little from the rates prevailing in early 1998. During the past couple of years, part of the decline in core CPI inflation has been due to the methodological changes to its construction; these changes have now been completed.
Responding to the ongoing strength in domestic demand, and its assessment that inflationary pressures are building, the Federal Reserve has raised rates twice in the past three months, in November and February. This takes the Federal Funds rate to 5¾ per cent, 100 basis points higher than the low point reached in late 1998.
Elsewhere in the Americas, countries have generally experienced favourable economic conditions, in part reflecting the continuing strength of the US economy. In Canada, the unemployment rate has been below 7 per cent since November for the first time in almost two decades. Although Canada's inflation rate remains subdued, wages growth has clearly increased since the start of last year. The major Latin American economies are continuing to recover. Despite several recent months of relatively high price rises, Brazil succeeded in meeting its first inflation target; through 1999, inflation was slightly above the 8 per cent target midpoint, but well within the 6 to 10 per cent tolerance range. The Mexican economy continues to grow strongly, and the recovery of the Argentine economy, although weaker, is continuing.
Japan
Activity in Japan – especially private demand – was generally stronger than most observers expected over the first half of 1999, although GDP declined in the September quarter (Table 1). While overall demand conditions look to have improved, the recovery remains fragile, in part because of the uncertainties associated with the resolution of structural problems in the corporate and financial sectors. Nevertheless, there have been encouraging developments in this regard and macroeconomic policies continue to be supportive of growth.
| Quarterly |
Year to Sep qtr 1999 |
|||
|---|---|---|---|---|
| Mar 1999 | June 1999 | Sep 1999 | ||
| Private consumption | 0.5 | 0.7 | −0.2 | 0.9 |
| Residential investment | 0.0 | 0.5 | −0.1 | 0.2 |
| Business fixed investment | 0.4 | −0.3 | −0.3 | −1.3 |
| Change in inventories | 0.3 | 0.1 | 0.0 | 0.3 |
| Public demand | 0.6 | 0.1 | −0.7 | 1.0 |
| Net exports | −0.3 | −0.1 | 0.4 | −0.3 |
| – Exports | 0.0 | 0.2 | 0.6 | 0.5 |
| – Imports | −0.3 | −0.3 | −0.3 | −0.7 |
| GDP (per cent) | 1.5 | 1.0 | −1.0 | 1.0 |
|
Source: Datastream |
||||
A major source of the increase in demand has been exports, which have staged a strong recovery since the middle of 1999. To date, the revival in world growth, particularly across the rest of Asia, has outweighed any loss of competitiveness arising from the appreciation of the exchange rate. A pick-up in consumer spending from its low levels of late 1998 has also contributed to stronger demand, notwithstanding the fall in the September quarter. Consumer confidence continues to improve, reaching its highest level in three years in the December quarter. Business investment is yet to contribute to the recovery, reflecting the large degree of excess capacity in the economy. Investment intentions correspondingly remain weak.
Part of the pick-up in domestic demand is being absorbed by imports, which rose by 7 per cent over the year to the September quarter. On the other hand, the inventory overhang that was evident through much of the past two years appears to have been mostly unwound. Demand is thus increasingly stimulating production; industrial production rose at an annual rate just under 10 per cent over the second half of 1999. Employment began to increase in late 1999, following falls over much of the previous year and a half, although firms continue to report that their employment levels are excessive.
There remains considerable uncertainty as to the extent to which structural problems in the corporate and financial sectors will inhibit the recovery. There are, however, some encouraging signs. Despite the problems in the corporate sector, business confidence strengthened further in the December quarter and firms expect this trend to continue into the new year. Firms also reported an improvement in their financial position, suggesting that some progress is being made in the repair of balance sheets. Confidence in the financial restructuring program seems to be growing, with the ‘Japan premium’ (the difference between the interest rate at which Japanese banks can borrow US dollars in international capital markets and the US interbank rate) narrowing significantly since the announcement of the financial revitalisation program in October 1998. Moreover, while credit outstanding is still falling (even when loan write-offs are excluded), firms report that banks' lending standards are becoming more accommodative.
A fiscal package introducing new spending measures amounting to ¥5½ trillion (or 1 per cent of GDP) was announced in mid November. This package roughly maintains public spending at its 1998 level, and primarily comprises new spending in public works and further housing assistance. The series of fiscal packages introduced during the 1990s has substantially increased the level of public indebtedness in Japan; the OECD estimates that gross public debt outstanding was in excess of 100 per cent of GDP in 1999, up from around 60 per cent at the beginning of the decade.
Non-Japan Asia
The economies of non-Japan Asia grew strongly during 1999. In general, domestic activity in the region continues to be supported by a strong rebound in private consumption, while investment remains quite weak. The recent strength in activity has carried over into the labour market, with employment picking up across most of the region.
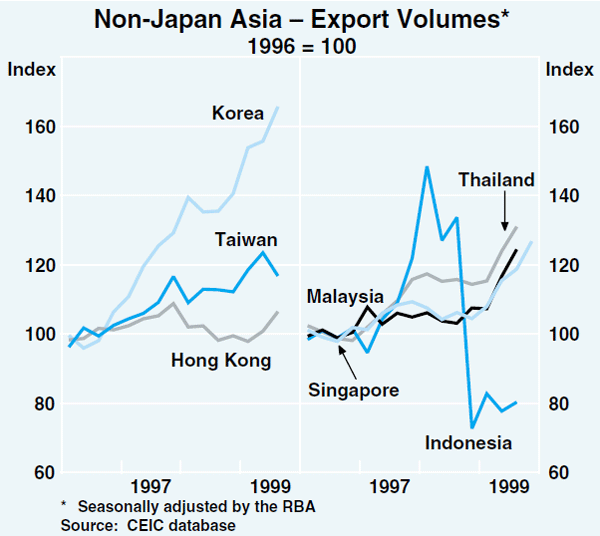
The strength seen in domestic demand has been complemented in recent quarters by a sharp rebound in exports, particularly to other countries in the region, including Japan (Graph 3). Over the first three quarters of 1999, export volumes for the region rose at an annualised rate of 16 per cent. Initially, the rebound in exports was concentrated in electronic goods, which began picking up in the September quarter of 1998. While these continue to increase rapidly, the recovery in exports broadened to other sectors during the second half of 1999.
Import demand across the region has also strengthened in conjunction with the increase in output growth. Further growth in imports is expected, as inventories have been run down and demand for output, from both domestic and foreign sources, is expected to remain strong. As a result, Asian demand for Australian exports should strengthen in coming quarters.
While the recovery across the initial crisis economies continues to consolidate, credit growth remains weak, largely reflecting the still fragile state of these economies' banking sectors. Current estimates of non-performing loans range from 25 to 60 per cent of GDP, and according to the World Bank, the estimated recapitalisation requirements of these economies' financial sectors are substantial (Table 2). Although the bulk of these costs will be met by the public sector, raising public debt considerably, public debt post-recapitalisation is currently expected to remain below the average for OECD countries (70 per cent of GDP) in all countries except Indonesia, since most countries entered the crisis with very low levels of public debt.
| Indonesia | Korea | Malaysia | Thailand | |
|---|---|---|---|---|
| Estimated recapitalisation costs | 58 | 16 | 10 | 32 |
| Public debt – 1996 | 24 | 8 | 35 | 4 |
| Public debt – 1998 | 73 | 10 | 36 | 15 |
| Estimated public debt after recapitalisation | 107 | 27 | 43 | 47 |
|
(a) These estimates of the cost of recapitalisation are, according to the World Bank, indicative only. They are based on assumptions about the likely peak in non-performing loans, the future value of the underlying assets, and the interest costs incurred by the government on recapitalisation funds. Source: World Bank, Global Economic Prospects 2000, December 1999 |
||||
Activity in Hong Kong reached a trough early in 1999, and has subsequently increased quite strongly. Output increased by 5 per cent between the March and September quarters 1999, following a contraction of 8 per cent over the previous 18 months. Growth has been assisted by public spending, a pick-up in financial services and continued strong growth in tourist arrivals. In contrast, output growth in China slowed to 7.1 per cent in 1999, the lowest growth rate recorded since 1990. Activity continues to be driven by public investment, with exports also growing strongly. Private demand remains weak, although there were signs of retail sales picking up during the latter part of the year.
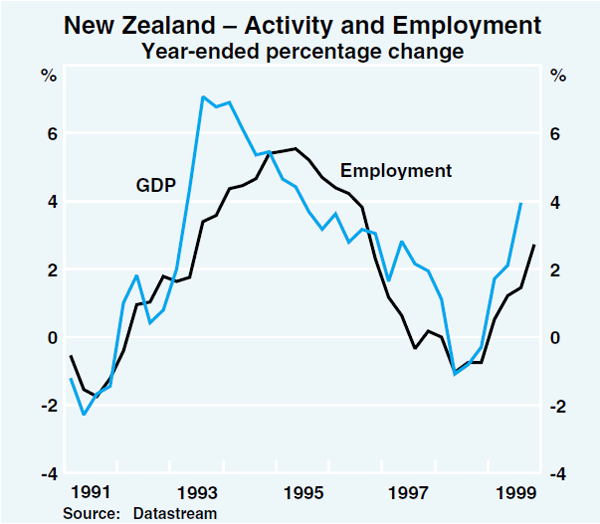
The New Zealand economy is growing strongly. Real GDP rose by 2.3 per cent in the September quarter, having fallen slightly in the previous quarter, to be 4 per cent higher than a year earlier (Graph 4). Growth has been particularly strong in consumption and housing construction, and, more recently, exports have shown signs of recovery. Inflation, at 1.3 per cent over the year to the December quarter, remains comfortably within the RBNZ's target. However, given the strength of domestic demand and the RBNZ's assessment of the amount of spare capacity remaining in the economy, the RBNZ has increased the official cash rate by 75 basis points, to 5.25 per cent, since November to avoid a future increase in inflationary pressures.
Europe
Growth in the euro area picked up during the second half of 1999 (Graph 5). The pick-up was most notable for Germany and Italy, which had until recently been considerably weaker than the remainder of the euro area. The smaller euro area economies continue to expand at a faster rate than their large neighbours. The recent increase in activity largely reflects a sharp increase in export volumes. Exports are being supported by the rebound in growth of the region's trading partners along with the boost to competitiveness afforded by the depreciation of the euro over the past year. Domestic demand is growing at around trend rates for the region as a whole, with consumption growth being supported by growth in incomes. Investment growth remains quite strong.
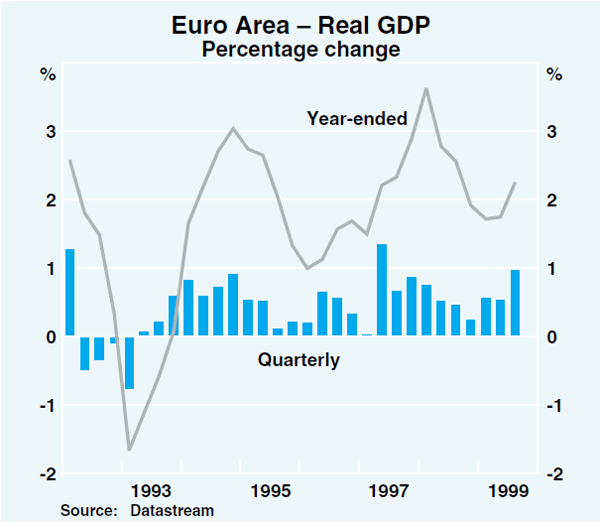
Price pressures in the euro region have picked up somewhat, although this mainly reflects the impact of increased oil prices. CPI inflation rose to 1.7 per cent over the year to December; excluding food and energy prices, it was 0.8 per cent. The European Central Bank increased interest rates in early February, reflecting concerns about the inflationary risks posed by the rise in oil prices, the lower euro, the strength of the world economy, and the ongoing strong growth in credit and money.
Activity in the United Kingdom progressively strengthened over the course of 1999. Domestic demand, with the exception of housing investment, continues to grow at around trend rates, and since the June quarter, this has been supported by a sharp increase in exports. The strength in demand has contributed to a fall in the unemployment rate to its lowest level in nearly 20 years, and a noticeable increase in wage pressures. This led the Bank of England to raise interest rates by a further 25 basis points at its January meeting, the third rise since September. Core inflation in the UK is currently slightly below the target rate of 2½ per cent.
International Financial Markets
In the closing months of 1999, concerns about Y2K-related problems had been a major influence on financial markets around the world, but with the century date-change passing without any significant mishap, the focus of markets immediately returned to the underlying strength of the global economy.
The effects of Y2K concerns were most evident in short-term yields. The desire by borrowers to secure funding over the end of the year, and the unwillingness of lenders to commit funds over this period, meant that short-term market yields in late 1999 jumped once their maturity spanned the year-end. In the United States, for example, yields on 90-day securities rose sharply in early October, while those on 30-day bills spiked higher in early December (Graph 6).[1] While this rise was almost fully reversed in the last couple of days of December, as markets became confident that year-end pressures would be comfortably handled, the structure of short-term interest rates still implied an early tightening in US monetary policy.
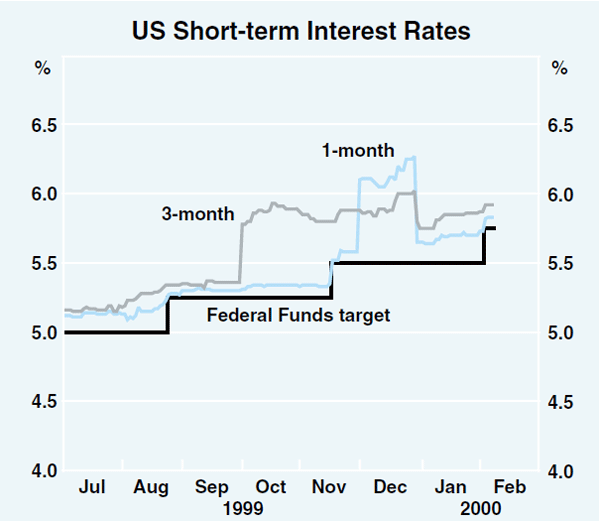
These expectations about monetary policy were reinforced by the fact that the Fed had explained its decision to leave rates unchanged at its late-December meeting as being designed to help markets cope with year-end pressures. With Y2K out of the way, markets saw no further obstacles to further Fed tightening, fully pricing in the subsequent move of 25 basis points announced by the FOMC in early February, with expectations of more to come in the following months.
Other central banks in industrialised countries have also tightened monetary policy again. In January, central banks in the United Kingdom and New Zealand each tightened monetary policy by 25 basis points, the third tightening for the UK in this cycle, and the second for New Zealand (Graph 7 and Table 3). Canada followed the Fed in early February, raising official rates by 25 basis points, while the European Central Bank, citing risks of increasing inflationary pressures, pushed up rates by the same amount. Denmark and Sweden also raised official rates by 30 and 50 basis points, respectively. Switzerland increased its target interest rate by 50 basis points. While the increase in rates has been broadly similar across countries, the level of short-term interest rates in English-speaking countries is somewhat higher than in European countries. This is largely because the former group is at a more advanced stage of the business cycle.
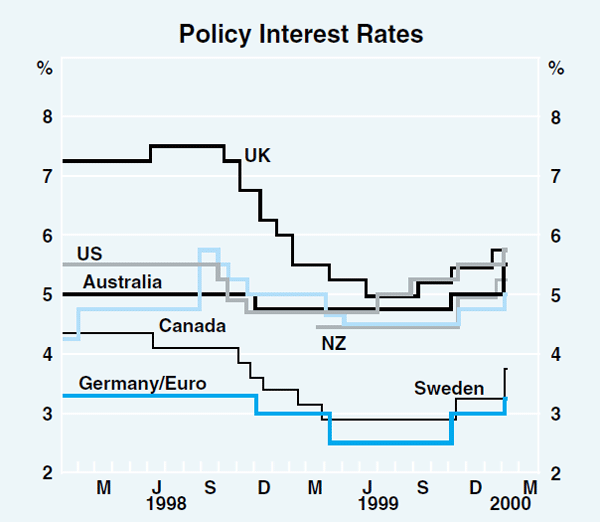
|
Increases since 1999 low Basis points |
Level now Per cent | |
|---|---|---|
| US | 100 | 5.75 |
| UK | 75 | 5.75 |
| Australia | 75 | 5.50 |
| New Zealand | 75 | 5.25 |
| Canada | 50 | 5.00 |
| Europe | 75 | 3.25 |
| Sweden | 85 | 3.75 |
| Denmark | 75 | 3.60 |
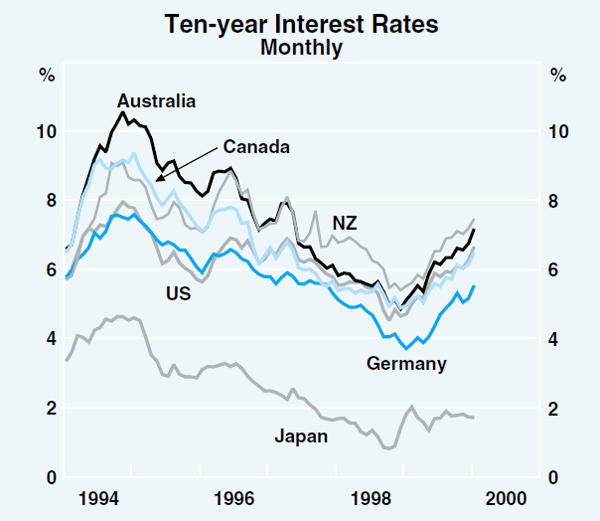
Reflecting concerns about the build-up of potential inflationary pressures in many countries as economic growth strengthens, bond yields have continued their upward trend (Graph 8). In the US, yields on 10-year bonds have risen about 50 basis points in the past three months, to 6.6 per cent. In Germany, 10-year bond yields moved by a similar amount to 5.5 per cent. The exception to this global pattern of rising long-term interest rates is Japan, where the yield on 10-year bonds has been steady at about 1.8 per cent.
Share markets have been volatile, with periods of optimism about the outlook for profits, particularly in the ‘technology’ sector, interspersed by periods of weakness caused by rising market interest rates. Overall, even though the S&P500 and Dow Jones indices in the US hit new highs in January, falls since then mean that these measures of share prices are no higher than they were nine months ago. The main area of strength in the US share market has been the ‘hi-tech’ stocks. The NASDAQ index, which contains a high weighting of such stocks, has risen by over 50 per cent since early October 1999 and by 90 per cent over the past year.
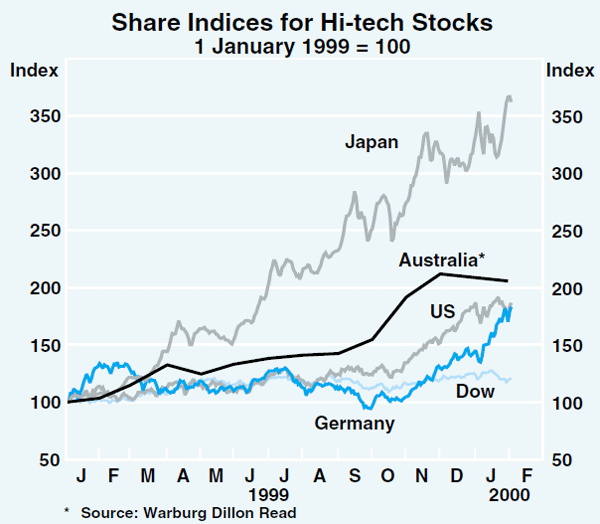
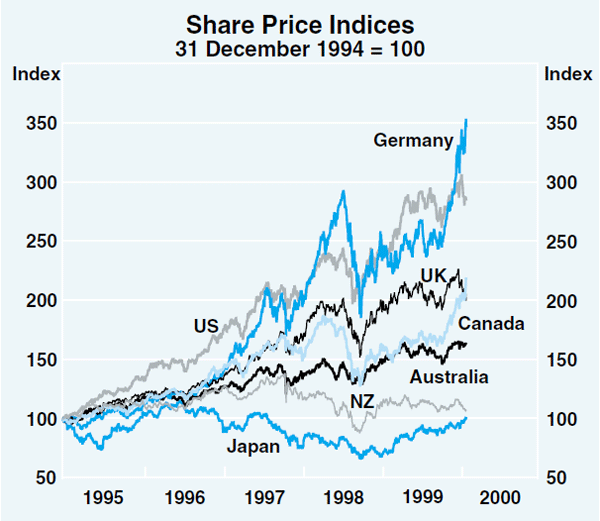
Share markets in other countries have followed the pattern in the United States, with hi-tech stocks leading the way in industrial countries. Japanese technology stocks (JASDAQ) have risen more than threefold since the beginning of 1999 (Graph 9). More broadly based indices of Japanese share prices have also risen strongly over recent months, as pessimism about the Japanese economy subsides (Graph 10). The share market in Germany has been stronger than most, helped by the announcement in December of the abolition of capital gains tax on certain share transactions.
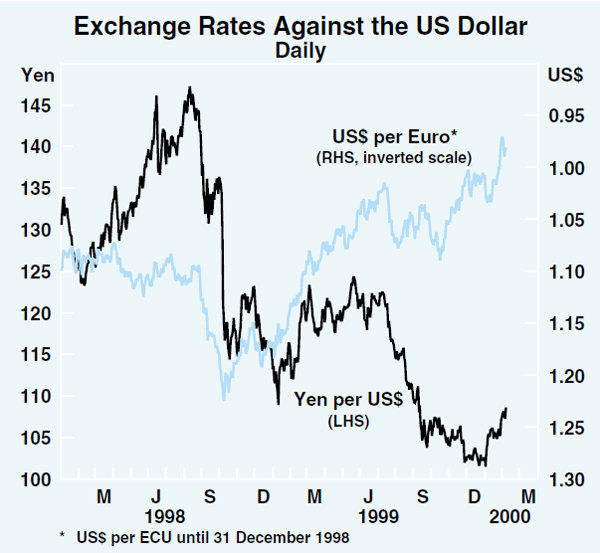
The sharp appreciation of the yen during the second half of 1999 has been partly reversed more recently, reflecting intervention by the Bank of Japan and widening interest differentials in favour of the US (Graph 11). The euro has continued to show signs of weakness as it fell to a low of US$0.9665, prior to the ECB's monetary policy announcement. While the increase in interest rates lent some support to the euro, it remains below parity to the US dollar, at about 16 per cent lower than the rate at which it came into existence a little over a year ago.
Emerging markets have continued to perform well over the past few months, consistent with the brighter outlook for global economic activity. While these economies were perceived as being vulnerable to Y2K problems, in the event no economy encountered any significant glitches. Short-term interest rates have remained broadly unchanged or have moved a little lower. The benign environment has also been reflected in stronger share markets. Share markets in some of these countries – e.g. Hong Kong, Brazil, Chile and Mexico – reached new peaks, although several have fallen back somewhat recently. Longer-term yields moved lower throughout the December quarter, but signs of stronger economic growth and increased government debt issuance has seen yields rise a little in recent weeks. Emerging-market credit spreads, which had fallen to their lowest level since the upheaval in financial markets in August/September in 1998, have risen about a percentage point to 9 percentage points in early February.
Domestic Economic Activity
The Australian economy continued to grow strongly throughout 1999. The September quarter national accounts recorded growth in GDP of 1.6 per cent in the quarter and year-ended growth of 4½ per cent (Table 4), as the economic expansion continued into its ninth year (Graph 12). More recent information suggests that the strong expansion continued through the closing months of the year, and the economy appears to have entered 2000 with considerable momentum. Exports are now recovering, having been relatively weak for much of the past two years. More generally, the improved outlook for the world economy, the availability of credit on attractive terms and buoyant asset markets are supporting growth in demand and activity at present.
|
September quarter 1999 |
Year to September 1999 |
|
|---|---|---|
| Private final demand(a) | 2.2 | 4.2 |
| Consumption | 1.3 | 4.3 |
| – Goods | 1.3 | 2.8 |
| – Other(b) | 1.4 | 5.4 |
| Dwelling investment | 0.1 | 0.8 |
| Business investment(a) | 8.1 | 4.9 |
| – Machinery and equipment(a) | 12.7 | 6.6 |
| – Buildings and structures(a) | −3.1 | −8.1 |
| – Other(c) | 11.6 | 24.0 |
| Public final demand(a) | 1.5 | 7.0 |
| Change in inventories(d) | 0.1 | 1.3 |
| Gross national expenditure | 2.1 | 6.1 |
| Net exports(d) | −0.4 | −1.6 |
| – Exports | 4.2 | 4.9 |
| – Imports | 5.8 | 12.4 |
| Gross domestic product | 1.6 | 4.5 |
|
(a) Excluding transfers between the public and private sectors (b) Excluding dwelling rent (c) Includes investment in software (d) Contribution to growth in GDP |
||
Consumption growth, in particular, has continued at a faster than average pace, supported by the gains in employment in the second half of 1999, the high level of consumer confidence and further increases in household wealth. These factors, together with the anticipation of the GST, are also generating an increase in activity in the housing sector. The outlook for business investment has improved over recent months, as business confidence and profits remain at high levels and financing costs remain relatively low.
Household consumption, income and wealth
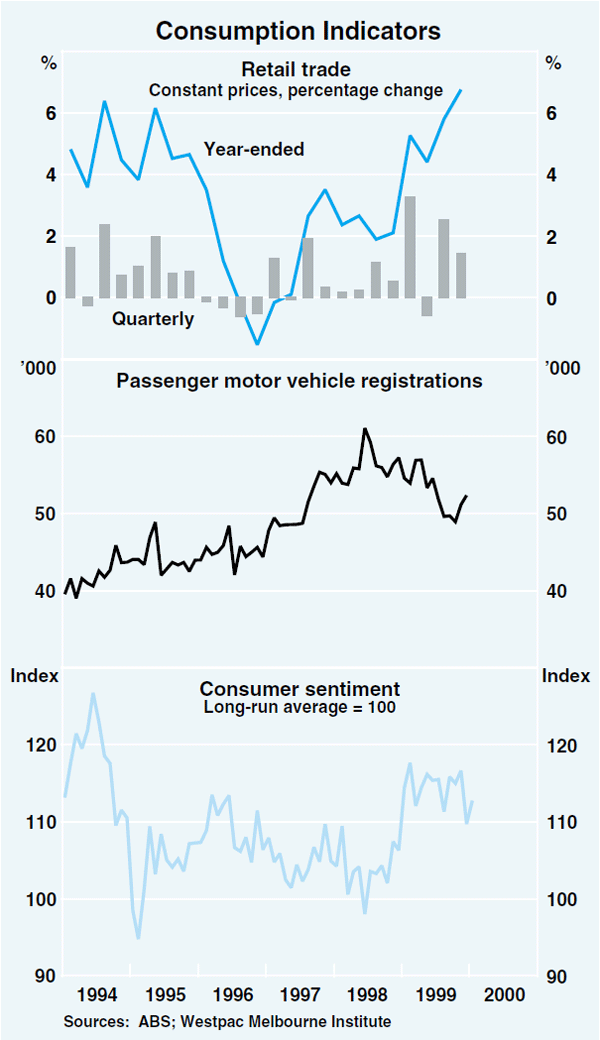
Consumption spending advanced strongly in the September quarter, after a slight pause in mid year. More recent indicators suggest that the strong growth has continued in the closing months of the year. Over the year to the December quarter, retail sales increased by nearly 7 per cent in constant price terms, with a large part of the increase occurring in the second half of the year (Graph 13). The growth in retail sales in 1999 was broadly based across most categories of retailers. Sales of household goods were particularly strong in the latter part of the year, consistent with the pick-up in housing activity, following a period of weaker growth in 1998. Most states recorded strong growth in retail sales in 1999, particularly Victoria where sales increased by 10 per cent over the year (Table 5).
|
Dec qtr 1999 |
Year to Dec qtr 1999 |
|
|---|---|---|
| New South Wales | 1.3 | 6.4 |
| Queensland | 2.8 | 6.8 |
| South Australia | 1.6 | 3.9 |
| Tasmania | −1.5 | 4.3 |
| Victoria | 0.4 | 10.0 |
| Western Australia | 2.6 | 2.6 |
| Australia | 1.4 | 6.8 |
In contrast to the strength in retail trade, sales of motor vehicles were lower in 1999 than in 1998, despite a rebound in November and December. Some of the weakness has been attributed to the anticipated decline in new car prices when the existing wholesale sales tax on cars is replaced by the GST. However, some decline in sales from the peak reached in 1998 was probably to be expected. The extensive discounting and promotion of motor vehicles during 1998 and early 1999, especially at the cheaper end of the market, eased in the September quarter as producers and distributors sought to rebuild margins, though there was some resumption of discounting later in the year.
The overall strength in consumption has reflected a high level of consumer confidence. Consumer sentiment, as measured by the Westpac-Melbourne Institute survey, rose in January to be well above its long-term average, although slightly below the level in the middle of 1999.
Rising consumption has been partly supported by the ongoing increase in household incomes. Gross household income increased by 1.2 per cent in the September quarter and by 4.5 per cent over the year to September – around the same pace as the past two years. Much of this growth has been underpinned by increases in the compensation of employees, consistent with the performance of the labour market. Reflecting the larger equity holdings of households, dividend income rose sharply in the September quarter, following similarly strong growth in the June quarter. Nonetheless, this remains a relatively small share of household income.
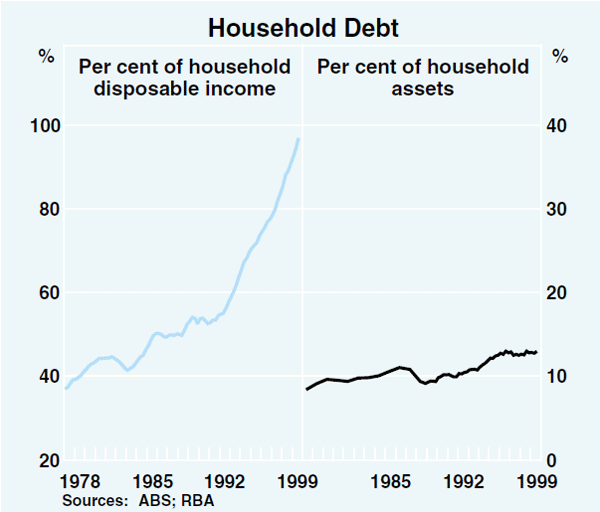
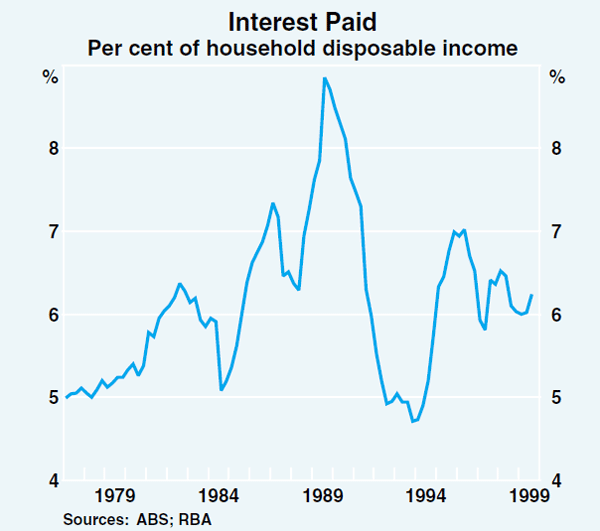
Consumption has continued to grow faster than income, so that the household saving rate, as measured in the national accounts, has declined further. This has been associated with an ongoing increase in household indebtedness (Graph 14). Despite this, the leverage of the household sector has not increased much over the past few years as the growth in household assets has kept pace with the increase in household debt. Household assets are estimated to have increased by 1.9 per cent in the September quarter, and by 13.2 per cent over the year to September, underpinned by an increase of 15.8 per cent in dwelling assets over the year to September (Table 6). The rise in debt pushed up the household interest repayment burden slightly in the September quarter (Graph 15). While this servicing burden remains relatively low, the high ratio of household debt to income implies that a rise in interest rates of a given size may have a greater impact on household cash flows than in the past.
| Level $b |
Share of total assets |
Year-ended growth |
Average annual growth since June 1995 |
|
|---|---|---|---|---|
| Per cent | ||||
| Dwellings | 1,535 | 56.3 | 15.8 | 10.8 |
| Consumer durables | 120 | 4.4 | 4.2 | 3.4 |
| Financial assets | 1,072 | 39.3 | 10.7 | 10.1 |
|
of which: – Currency and deposits |
243 | 8.9 | 2.8 | 6.3 |
| – Equities | 187 | 6.9 | 29.3 | 15.4 |
| – Superannuation and life offices | 552 | 20.2 | 10.2 | 10.2 |
| – Other | 90 | 3.3 | 3.8 | 11.0 |
| Total assets | 2,727 | 100.0 | 13.2 | 10.1 |
|
Sources: ABS; CBA/HIA Housing Reports |
||||
The housing market
There is considerable strength in the housing market. Investment in new dwellings increased by nearly 2½ per cent in the September quarter and the forward indicators of housing activity suggest continuing strength in the sector. The number of monthly loan approvals for owner-occupied housing, after being flat for most of 1997 and 1998, was about 29 per cent higher in the three months to November than a year ago. The value of loan approvals was 45 per cent higher over the same period, as the average value of a new housing loan approval increased by nearly $15,000 to around $136,000. Lending for investor housing has also increased strongly.
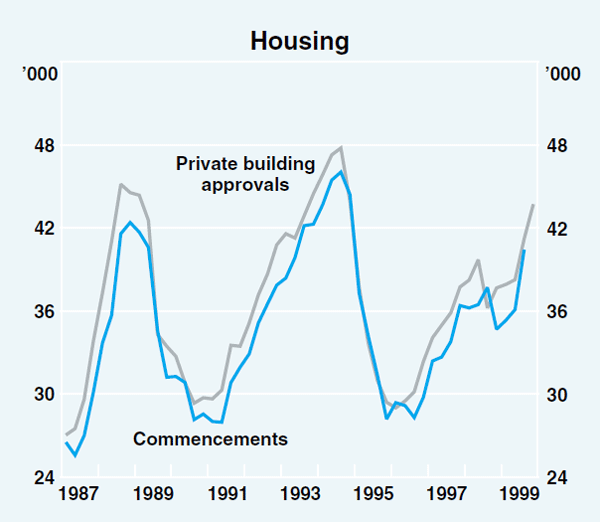
The number of private building approvals issued by local governments has accelerated, and was about 16 per cent higher in the December quarter than a year earlier, although it remains around 10 per cent below the mid 1990s peak (Graph 16). The average value of approvals has continued to increase, reflecting an increase in building costs and an ongoing increase in the size and quality of the average new home.
These indications of strength in the housing sector probably, in part, reflect the anticipated price impact of the introduction of the GST later this year. The construction and sale of new homes, repairs and renovations to existing homes and transaction costs will be subject to the GST from 1 July 2000, thereby providing some incentive for households to complete, if possible, their construction and repairs before that date. However, it is difficult to ascertain just how much of the current strength in housing activity is GST-related. The First Home Owners Scheme – which provides a grant to first-home buyers of $7,000 for purchases after 1 July – reduces the incentive for that group to bring forward house purchases. There is also some evidence that demand pressures are increasing the cost of getting building work done before 1 July 2000, thereby reducing the incentive to get work done before the introduction of the GST. In any case, most of the impact of the GST should soon be completely reflected in the approvals data, given the lead times between obtaining an approval and completing a housing project.
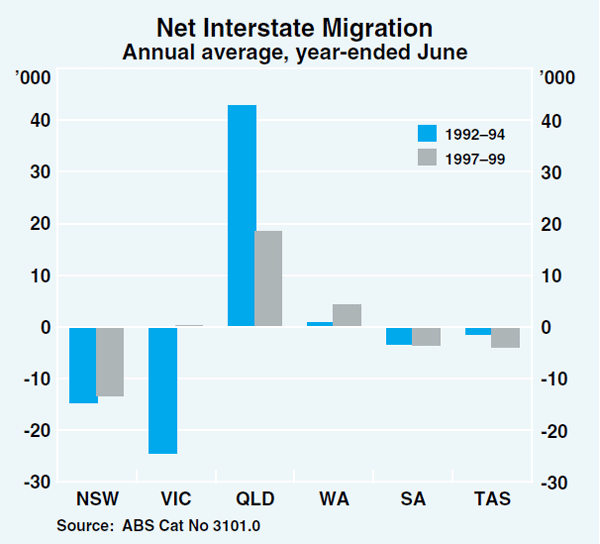
The recent strength in housing demand has been broadly based across Australia (Table 7). The number of loan approvals has increased by more than 20 per cent over the past year in every state. Growth in private building approvals has also been very strong in all states, except New South Wales where housing activity has been relatively steady, although at a high level, for the past two years. In Queensland, housing activity in 1999 was weaker than in previous years, in part reflecting the slowdown in net interstate migration to that state (Graph 17). This coincided with a large decline in net emigration from Victoria, which helped boost housing activity there. However, the strength of loan approvals and a recent upturn in building approvals in Queensland suggests that demand there is again increasing.
|
Private building approvals(a) |
Loan approvals(b) |
|
|---|---|---|
| New South Wales | −0.2 | 35.5 |
| Victoria | 28.5 | 21.8 |
| Queensland | 17.9 | 27.2 |
| Western Australia | 25.6 | 20.4 |
| South Australia | 52.7 | 36.4 |
| Tasmania | 43.0 | 20.3 |
| Australia | 16.1 | 28.6 |
| (a) Number; houses and medium-density dwellings (b) Number; for owner-occupation |
||
The pick-up in demand for housing across the country has been reflected in rising house prices (Table 8). While most of the growth over the past three years has been in Melbourne and Sydney, more recently house prices have picked up in other states. Over the year to September 1999, median house prices increased by around 13 per cent in Adelaide and by 5 per cent in Canberra and Perth. According to the Real Estate Institute of Australia, median house prices across Australia were around 10 per cent higher in the September quarter than they were a year ago. The house purchase component of the CPI has also reflected the strength of housing activity, increasing by 3.2 per cent in the December quarter and by 7.9 per cent over 1999.
| Sydney | 9.6 | |
|---|---|---|
| Melbourne | 20.7 | |
| Brisbane | −2.1 | |
| Adelaide | 13.3 | |
| Perth | 4.8 | |
| Hobart | 7.1 | |
| Darwin | 4.3 | |
| Canberra | 5.3 | |
| Australia | 10.3 | |
|
Source: Real Estate Institute of Australia |
||
The business sector
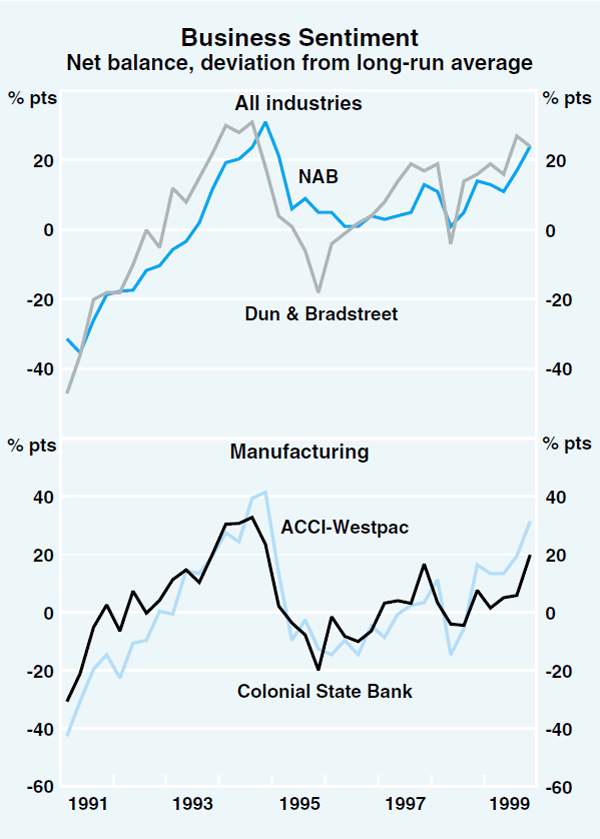
Business conditions and sentiment continued to improve over the course of 1999, following declines in the two previous years, as fears of sharply reduced external demand and slower domestic growth subsided (Graph 18). The National Australia Bank survey for the December quarter showed that overall indicators of business conditions are at their highest levels since 1994. Corresponding to the improved outlook for the world economy, expectations of export sales have improved and are close to their long-run average. The Dun & Bradstreet survey confirmed the general improvement in confidence across most industries. More specialised surveys of the manufacturing sector – the ACCI-Westpac and Colonial State Bank surveys – also suggest that conditions have improved noticeably in terms of both sales and exports. The results of these surveys generally accord with data suggesting strong output growth, sound profitability and the ready availability of funding.
Output, as indicated by the production measure of GDP, increased by 1.6 per cent in the September quarter, underpinned by strong growth in the service industries. Growth was particularly strong in the property and business services sector, at nearly 5 per cent in the quarter and 12 per cent over the year. Mining output was 3.2 per cent higher than a year earlier after declining throughout 1998, as a number of large projects commenced production.
According to the national accounts, some of the increased production in the September quarter was absorbed by stock-building. The run-up in inventories suggested in the national accounts appears relatively large compared with the indications from other surveys. Much of it was concentrated in the manufacturing industry, where the inventories-to-sales ratio rose back to the levels of the early 1990s. This largely reflected an increase in the inventories held by machinery and equipment manufacturers. Inventory-to-sales ratios of the retail and wholesale industries did not point to any significant imbalances, despite a build-up in inventories of motor-vehicle wholesalers. Early in the December quarter, the ABS conducted a survey that suggested that less than 10 per cent of businesses were expecting Y2K concerns to affect their level of inventories or sales in the second half of 1999.
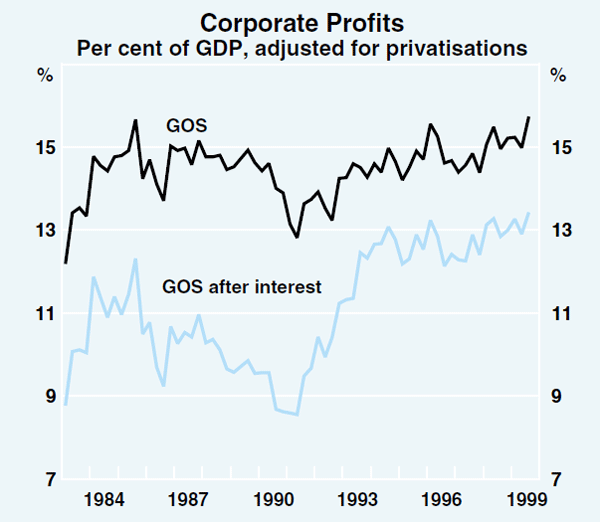
Corporate profits, as measured by gross operating surplus (GOS), rose by 6.9 per cent in the September quarter, and by 11 per cent over the year, to stand at 15.7 per cent of GDP, slightly higher than the mid 1980s peak (Graph 19). The recent increase primarily reflected improved profitability due to continued growth in sales and subdued wages growth, although an increased tendency for businesses to incorporate may also have contributed to the growth of this measure of profitability. Despite a minor increase in net interest payments as a percentage of GOS, the interest burdens of both corporates and unincorporated businesses remain well below their historical averages. While increasing slightly over the past two years, corporate gearing also remains well below the levels of the early 1990s.
Total business external funding has remained strong in recent quarters. While there was some easing in growth of intermediated credit, this was offset by strong growth in other sources of external finance. Excluding privatisations and raisings by financial institutions, equity raisings reached a new high in 1999. They represented almost half of the external funds raised by businesses over the year, with placements by listed companies contributing almost half of this. Non-intermediated debt raisings were also strong in 1999; corporates returned to these markets after the international financial crisis of late 1998. Much of this growth was in promissory notes and Australian-dollar-denominated bonds. The increased proportion of external funding obtained through non-intermediated sources continued the trend that has occurred over the past twenty years, as financial markets have become larger and more sophisticated.
There has been a decline in the growth of business investment over the past 18 months, as had been foreshadowed in surveys of business investment intentions. In the September quarter 1999, investment increased by 8.1 per cent, but this followed a decline of similar magnitude in the June quarter. Annual figures give a clearer picture of the trend. Over the year to September, business investment increased by 4.9 per cent in real terms, compared with growth of 9 per cent over the previous year and average growth rates well over 10 per cent per annum over the previous four-year period, as the economy recovered from the early 1990s recession.
A significant decline in mining investment over recent quarters accounts for some of the weakness in investment growth (as discussed in the November Semi-Annual Statement). The decline in mining investment came from an exceptionally high level by historical standards, and reflected the completion of a number of large projects and the impact of lower commodity prices in the period since the onset of the Asian crisis. At the same time, there was a significant scaling back of planned growth in investment across the economy more widely, particularly in the second half of 1998, reflecting widespread expectations of lower growth in demand and deteriorating export opportunities at that time.
Recently, business investment plans have undergone some modest upward revisions, suggesting that these intentions may have begun responding to the more general improvement in business sentiment. According to the ABS Capital Expenditure survey, the expected level of spending on plant and equipment for 1999/2000 was revised upward in the September quarter. Despite the upward revision, the latest survey still implies spending in 1999/2000, on this measure, at around the level recorded in the previous year.
Other components of investment spending offer a mixed picture. Forward indicators of construction investment continue to point to declines in spending in the period ahead. Approvals for construction projects have declined over the past year and, if maintained at current levels, would imply some decline in activity. The Capital Expenditure survey also points to a decline in intentions for this kind of investment, although the extent of the anticipated decline has diminished in the past couple of surveys. The third component of investment, spending on fixed intangible assets (mainly computer software), has continued to grow strongly. This component added almost half a percentage point to total domestic expenditure growth over the year to September and now represents around 12 per cent of total business investment spending. While some part of the recent strength undoubtedly reflected expenditure to address Y2K concerns, the strong growth in this component of expenditure has continued a trend that was evident over much of the 1990s.
Notwithstanding the flatness in a number of indicators of current investment intentions, conditions still appear to be favourable to further growth in investment spending in due course. As noted above, indicators of general business conditions have been steadily improving and are close to the levels seen at the time of the growth peak in 1994. In the past, high levels of business confidence have tended to be accompanied by strong investment growth. Also noteworthy is that current levels of business investment are well in line with historical averages in relation to the size of the economy. This contrasts sharply with the late-cycle experience of a decade ago, when there was significant over-investment in some areas which limited the scope for growth and eventually led to a sharp correction in investment spending. At present, business investment is running at around 12 per cent of nominal GDP, close to the average for the period since 1980. Hence there would appear to be scope for investment to continue to grow as the economy expands, particularly given the high levels of capacity utilisation being recorded in business surveys at present.
The labour market
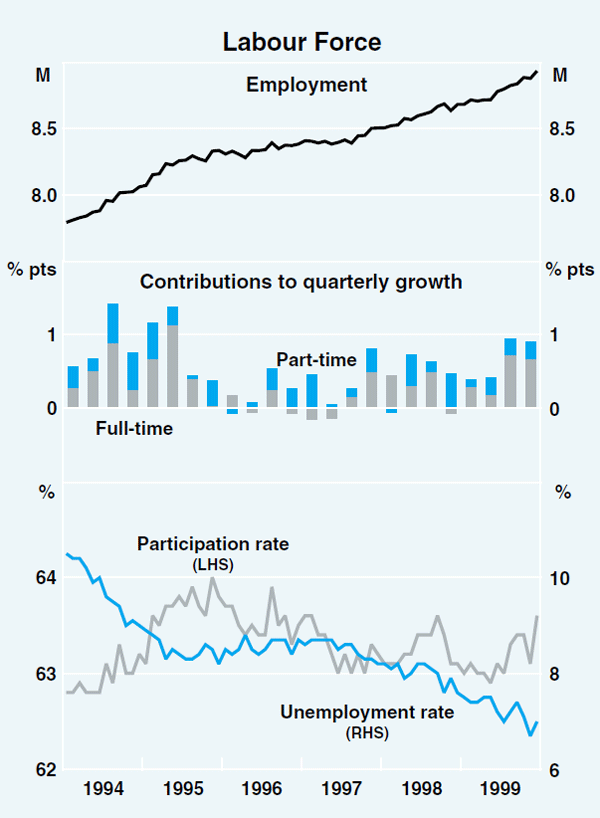
Employment growth has picked up since the middle of 1999 (Graph 20). Over the course of 1999, employment increased by about 250000 or 2.9 per cent; three-quarters of the increase was in full-time employment. Growth was concentrated in the second half of the year, with employment increasing at an annual rate of 3½ per cent over the six months to December. Despite some month-to-month volatility, the participation rate has moved upwards since mid 1999, in line with the pick-up in employment growth and the continued expansion of the economy more generally, to reach 63.6 per cent in December. The unemployment rate declined by around three-quarters of a percentage point over the year to the December quarter 1999, to fall below 7 per cent in the quarter for the first time since mid 1990.
The employment gains in 1999 were shared nationally, with employment growth over the year 2 per cent or higher in most states (Table 9). Employment increased particularly strongly in South Australia and Western Australia over the second half of the year. Over the course of the current expansion, the most rapid employment growth has been in Queensland and Western Australia. Unemployment rates in all the states and territories continued to fall during 1999, to reach their lowest levels in more than eight years.
| NSW | VIC | QLD | SA | WA | TAS | Australia | |
|---|---|---|---|---|---|---|---|
|
Employment growth (percentage change) |
2.9 | 2.6 | 2.0 | 2.9 | 3.4 | 1.7 | 2.7 |
|
Change in unemployment rate (percentage points) |
−1.1 | −0.8 | −0.1 | −1.2 | −0.5 | −0.9 | −0.8 |
Measures of job vacancies suggest good prospects for strong employment growth in the near term. The ANZ Bank measure of job vacancies advertised in major newspapers continued to rise strongly through 1999, although it fell sharply in January, a month in which there is often volatility in this series. The employer-based ABS vacancies survey reported vacancies in excess of the levels recorded in 1994. The latest business surveys indicate that firms' employment intentions for the March quarter 2000 remain at above-average levels (Graph 21).
The major business surveys reveal some signs of tighter labour markets, with labour shortages being reported as a constraint on production by a small but increasing proportion of businesses. The December quarter NAB survey recorded a further rise in the proportion of firms describing this constraint as ‘significant’ – this measure is at its highest level since the late 1980s. The ACCI-Westpac survey of manufacturers reported that 25 per cent of firms are finding it more difficult to find labour than three months ago, the highest level in more than a decade.
Balance of Payments
In the second half of 1999 there was a marked improvement in Australia's export performance. In large part, this was driven by an improvement in trading partner growth, although the opening of several new resource projects and high levels of agricultural production also underpinned the pick-up. While imports continued to grow strongly, in line with the strength of domestic demand, there was a noticeable improvement in the trade balance (Graph 22).
Export revenues increased by more than 15 per cent between the June and December quarters of 1999. Revenues were boosted by the export of an ANZAC frigate in October, and continued strong growth in re-exports of gold. Nevertheless, even excluding those items, export revenues increased by over 10 per cent, and more than unwound the falls recorded since mid 1998. Exports to all major destinations grew strongly for the first time since the Asian crisis (Graph 23), reflecting both the pick-up in trading partner demand and the improvement in export prices in A$ terms.
The value of resource exports (excluding re-exported gold) increased by 17 per cent over the second half of 1999. This reflected both stronger volumes and prices, and was spread across most major trading partners. In part, the strength in resource exports can be attributed to the increase in the world price of crude oil, combined with the recent development of substantial new crude oil production capacity off Australia's northwest coast. There have also been some significant rises in the exports of other major resource commodities; recent new project openings, the continuing improvement in trading partner growth, and the sustained price rally in base metal markets, for example, have all boosted the value of metal ore and processed metal exports since mid 1999. Although the recent pick-up in world steel production has fed through into stronger export volumes of iron ore and coking coal since June 1999, prices for these commodities remain weak.
The improvement in world growth has also supported a recovery in rural and manufactured exports over the second half of 1999 (Graph 24). Strength has been recorded in most categories of rural exports, but particularly for cereals and a broad range of other rural goods. Manufactured export earnings increased by almost 20 per cent over the second half of 1999, boosted, as noted above, by the export of an ANZAC frigate. Excluding the frigate, manufactured exports increased by just under 10 per cent, to reach levels in excess of their previous peak. Stronger exports of transport equipment accounted for much of this growth. Manufactured exports to the European Union and the Middle East have continued to grow strongly, and manufactured exports to South Korea are now more than double their level of eighteen months ago.
Service exports increased only modestly in the second half of 1999. There was a recovery in travel service exports, consistent with the slight pick-up in overseas arrivals from Asia and continued strength in arrivals from other parts of the world (notably the United Kingdom). There is expected to be a continuing pick-up in tourism exports over coming quarters in the run-up to the Olympics.
The value of imports of goods and services continued to rise strongly during the second half of 1999, to be 8½ per cent higher than a year earlier. In recent quarters, there have been significant imports of lumpy items, among them various defence and oil-drilling equipment, and strong imports of gold, fuel and lubricants. Excluding these, the value of imports increased by about 4 per cent over the year to December, and the volume of imports is estimated to have increased by around 10 per cent, in line with the strength in domestic demand.
Capital imports have grown strongly since early 1999, in contrast to the volatility of machinery and equipment investment over the same period. In late 1999, there was again a notable increase in imports of telecommunications equipment, fuelled by the continued expansion and upgrading of the domestic telecommunications sector; imports of computer equipment also increased strongly. Intermediate imports have also continued to grow strongly, consistent with the performance of the economy more generally. Growth in the volume of consumption imports, however, appears to have weakened somewhat over the second half of 1999, as falls in motor vehicle imports more than offset a slight pick-up in growth of other consumption imports.
With the value of exports growing by more than 8 per cent in the December quarter, and the value of imports growing by around 4 per cent, the balance of trade on goods and services improved by around ¾ of one per cent of GDP. Assuming an unchanged net income deficit as a proportion of GDP, the current account deficit would have narrowed in the December quarter by a similar amount.
Net foreign debt liabilities increased in the September quarter, reflecting both new borrowing and a depreciation in the exchange rate. The ratio of net foreign debt to GDP increased to just under 40 per cent, partly reversing the fall in this ratio over the previous year. Net equity liabilities fell in the quarter, resulting in a small fall in the ratio of total net external liabilities to GDP, to just under 60 per cent. The ratio of net income payments to exports increased a little, to 16½ per cent, in the September quarter.
Commodity prices
The Bank's index of commodity prices increased in January, in SDR terms, to be slightly above the level that has prevailed since late 1998 (Graph 25). Since August last year, a fall in the price of rural commodities has been more than offset by rising non-rural commodity prices.
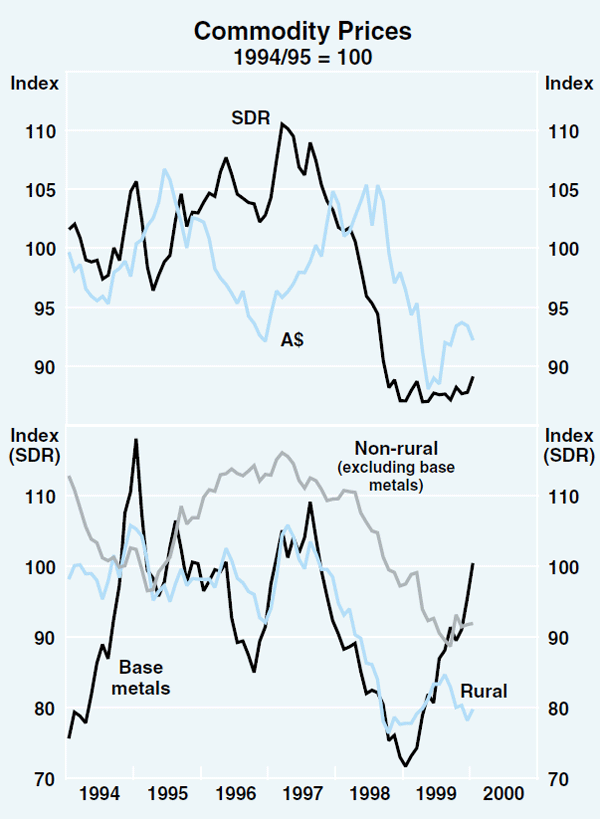
The weakness in rural prices in the second half of 1999 was spread across most components, with beef, cotton and rice prices all falling by more than 5 per cent in the December quarter. The cotton price fell sharply in response to forecasts of major production increases in the United States and Pakistan, and a substantial increase in exports of cotton by China. Wheat prices, which fell for the fourth successive quarter, were influenced by favourable production conditions in Australia and the three major American producers (Argentina, Canada and the United States). Wool prices have recovered and are now around 20 per cent higher, in Australian dollar terms, than their trough in late 1998.
The price index for non-rural commodities (excluding base metals) weakened late in 1999, driven largely by falls in the price of gold. These falls followed the sharp increase in the gold price in late September, when a number of European central banks announced their intention to limit further gold sales. The gold price rose again in early February after one of the world's major gold producers announced that it was suspending its forward-selling program. The prices that Australian exporters receive for both coking and steaming coal have continued to weaken, pushed down by increased competition in the spot market. The negotiations over Japanese fiscal year (April 2000 – March 2001) prices and volumes for the bulk commodities (iron ore and coal) are currently under way in Tokyo between Australian, Brazilian and Canadian producers and their Japanese customers. BHP has announced that negotiations over premium hard coking coal contracts have been concluded, and these incorporate an average price reduction of around 5 per cent, in US$ terms.
The prices of most base metals have continued to rally strongly. Aluminium, copper and zinc prices have all increased by more than 25 per cent over the past year. Nickel prices have roughly doubled, reflecting stronger world demand that has cut substantially into stocks accumulated as a result of the Asian crisis. Cutbacks to production both in Australia and abroad, industrial disputes at some major overseas mines, and slower than expected commissionings at the three new nickel producers in Western Australia have also affected the market.
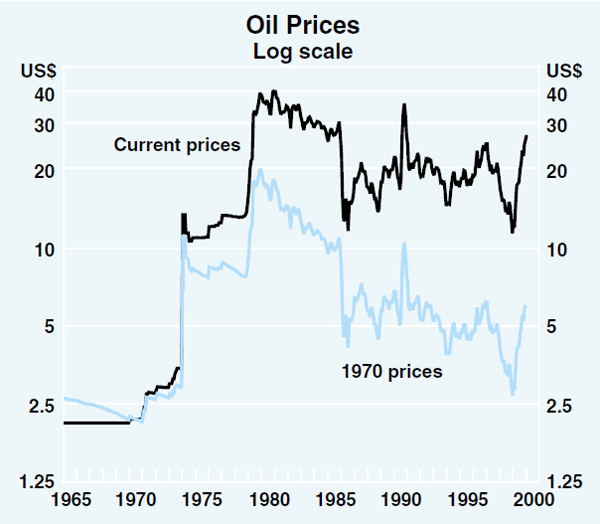
Crude oil prices increased again in the December quarter by more than 10 per cent and, at their current level of around US$28 per barrel, are more than double their price at the same time last year (Graph 26). Industry reports suggest that OPEC producers are holding to their production quota agreements, with the group to meet in late March to discuss the next set of production targets.
Domestic Financial Markets
Market interest rates
Short-term interest rates in Australia over late 1999 were affected by Y2K concerns in a similar way to that described for other countries in the chapter on ‘International Financial Markets’ (Graph 27). But, even abstracting from this, yields on short-term securities have consistently traded above the prevailing cash rate, reflecting expectations of monetary tightening. Since mid 1999, yields on 90-day bank bills have risen about 100 basis points to 5.8 per cent. Around half this increase has taken place since November.
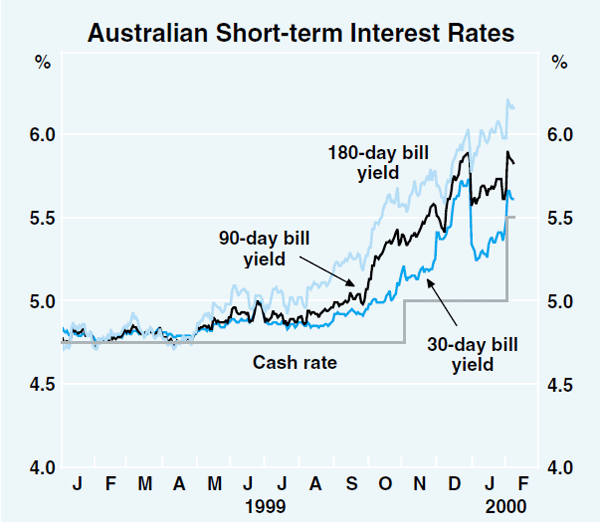
Bond yields in Australia have generally moved up in recent months broadly in line with those in the United States, although the combined effect of the early February tightenings in Australia and the US was a drop in bond yields in both countries of about 10 basis points, as these moves added to market confidence that central banks would act to keep inflationary pressures under control. In net terms, the yield on 10-year bonds is up by 50 basis points since early November, to about 7.1 per cent. As has been the case for much of the past six months, this is about 50 basis points higher than the yield on bonds of similar maturity in the United States.
This spread has remained much tighter than was the case in the global phase of rising bond yields in 1994. In both episodes, bond yields in the US rose by 2½–2¾ percentage points. Yields in Australia, however, have behaved very differently in the two episodes. The increase of about 2.2 percentage points since December 1998 – about the same amount as that in the US – compares with a rise of almost 4.5 percentage points in 1994. The smaller increase in the more recent episode suggests greater market confidence in Australia's inflationary outlook.
Credit spreads on non-government paper have fallen over the past quarter; the spread above Commonwealth Government securities on high-grade corporate paper is around 60 basis points, compared with about 70 basis points three months earlier. Some of this fall, although pre-dating year-end, appears to reflect the moderation of Y2K-related concerns.
Intermediaries' interest rates
The rises of a quarter of a percentage point on 3 November 1999 and of half a percentage point on 2 February in the Bank's target for the overnight cash rate were followed by similar increases in interest rates on most categories of variable-rate lending (Graph 28).
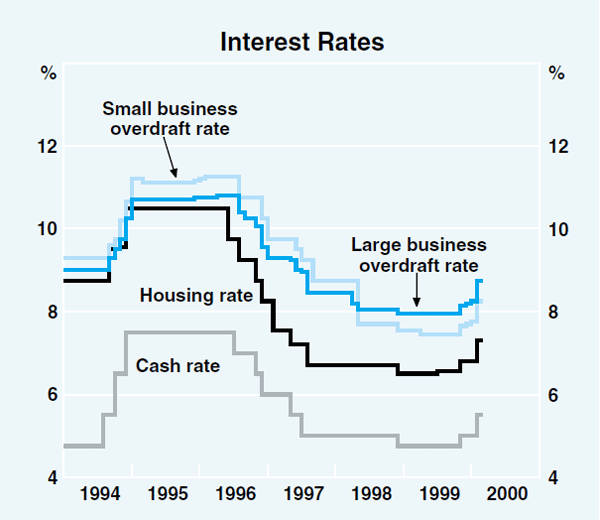
In the housing market, the cumulative rise of 75 basis points in interest rates on banks' standard variable and basic housing loans has lifted these rates to 7.3 per cent and 6.75 per cent respectively. At the time of writing, few mortgage managers had announced increases in their lending rates in response to the February tightening. Those which had done so, however, had moved, on average, by more than the rise in the cash rate. Since June 1999, large mortgage managers have, on average, raised interest rates by almost 100 basis points. The larger rise in these rates than in those of banks reflects the fact that since they do not borrow from retail depositors, mortgage managers tend to be more affected than banks by increases in the cost of wholesale funds in money markets. Housing rates offered by several large mortgage managers are now only slightly lower than those of banks.
Banks also raised the interest rates on most other forms of lending to the household sector by a total of 75 basis points in response to the two tightenings, bringing the interest rate on secured personal overdrafts to an average of around 7.4 per cent. Most banks have not announced increases in credit card interest rates following either tightening, but rates on these products were not reduced following the last easing of monetary policy in 1998.
Indicator rates for business borrowers were also typically increased by the full extent of the two monetary policy tightenings (although one major bank is yet to announce any increase in business rates in response to the latest tightening) (Table 10). In addition, one bank raised overdraft rates, though not term rates, by 25 basis points in January independent of any moves on monetary policy. The cumulative increases, since last November, in overdraft rates of the major banks therefore range from 75 basis points to 100 basis points, with the average around 80 basis points.
|
Average cumulative increases since November tightening |
Current average level |
|
|---|---|---|
| Household | ||
| Housing | ||
| Standard variable | 0.75 | 7.30 |
| Basic | 0.75 | 6.75 |
| Personal | ||
| Residential-secured overdraft | 0.75 | 7.40 |
| Business(a) | ||
| Small business | ||
| Residential-secured | ||
| – Overdraft | 0.80 | 7.85 |
| – Term | 0.75 | 7.35 |
| Other(b) | ||
| – Overdraft | 0.80 | 8.55 |
| – Term | 0.75 | 7.90 |
| Large business | ||
| – Overdraft | 0.80 | 8.75 |
| – Term | 0.75 | 8.60 |
|
(a) Based on figures for the three major banks which have so far announced increases
in business rates following the February tightening. (b) Both secured by other assets and unsecured. |
||
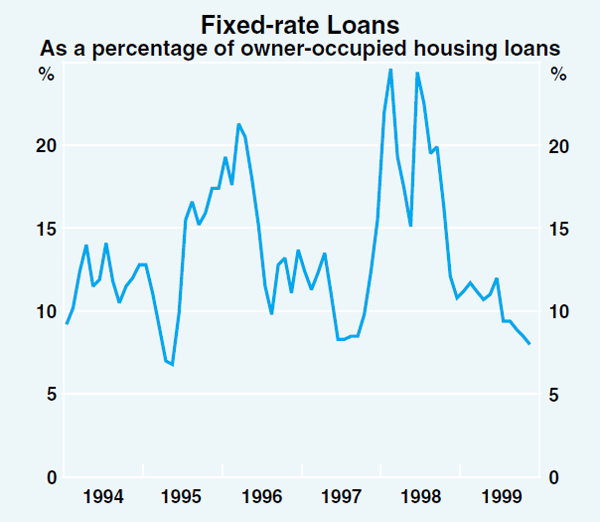
Increases in interest rates on new loans at fixed rates have been larger than those on variable-rate loans. These increases mirror the rise in capital market yields, which parallel banks' funding costs for such loans (Graph 29). For housing borrowers, the interest rate on a mortgage fixed for three years is currently 7.70 per cent, around 130 basis points above the trough of last year. Reflecting this rise, the proportion of new housing loans being taken out at fixed rates is at its lowest level in over four years (Graph 30).
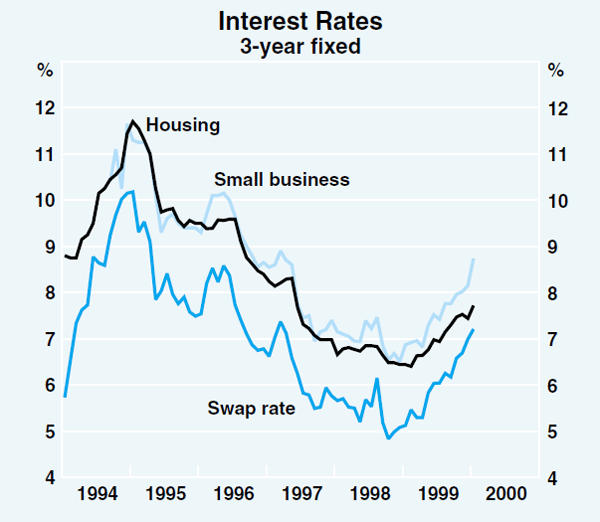
Small business borrowers have seen a greater increase in the cost of fixed-rate loans, with a three-year fixed-rate loan currently available from around 8.75 per cent, or more than 200 basis points higher than the December 1998 trough. Like borrowers for housing, many small businesses have responded to the increased cost of fixed-rate funding by switching back into variable-rate loans.
On the liabilities side of banks' balance sheets, funding costs in wholesale markets, proxied by bill yields, have increased by more than the cash rate but the cost of retail funds has typically gone up by less than this. For example, banks increased the interest rate on transaction accounts with balances of less than $10,000 by up to 20 basis points (in total) in response to the two tightenings; the rate on cash management accounts with balances of up to $100,000 was increased by up to 45 basis points. The relatively small rises in interest rates on transaction accounts following the tightenings of monetary policy largely mirrors the earlier pattern when monetary policy was being eased; in that episode, interest rates on retail deposits generally fell by less than the cash rate. Increases in interest rates on retail fixed deposits have been larger than those on transaction accounts (and in some cases larger than the rise in the cash rate).
It is not clear what overall impact these moves in deposit and lending rates will have on banks' interest margins. In the three years to late 1999, however, the relative movements of lending rates and deposit rates resulted in banks' margins falling by about 100 basis points.
Share market
The Australian share market has to a large degree reflected the swings in the US share market, although the amplitude has generally been smaller. Like the US market, the Australian market reached a new record in early January, but it has since retraced somewhat, in part due to the impact of rising bond yields, and is only about the same level as nine months ago.
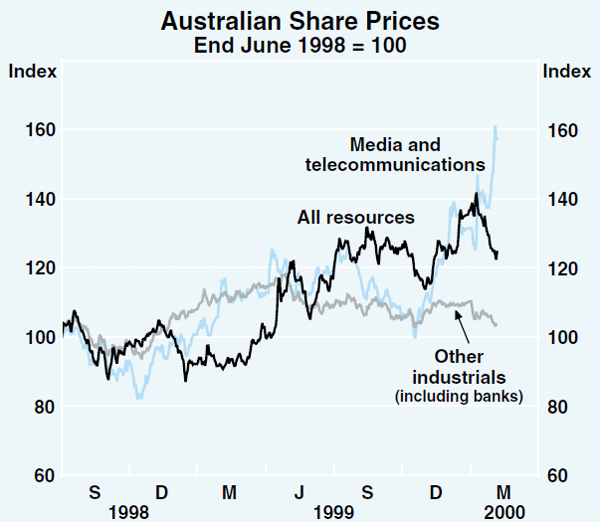
Prices of resources stocks have risen, buoyed by rises in commodity prices due to the improved outlook for world growth (Graph 31). Within the industrial stocks grouping, the main area of growth was the media and telecommunications sectors, which have various linkages to the technology/ internet sector. Technology/internet stocks themselves have a very small weight in the All Ordinaries Index, although a number of such companies have been floated in recent months and have seen a strong rise in their share prices. The prices of other industrial shares, including banks, showed little or no gains in recent months.
Australian dollar
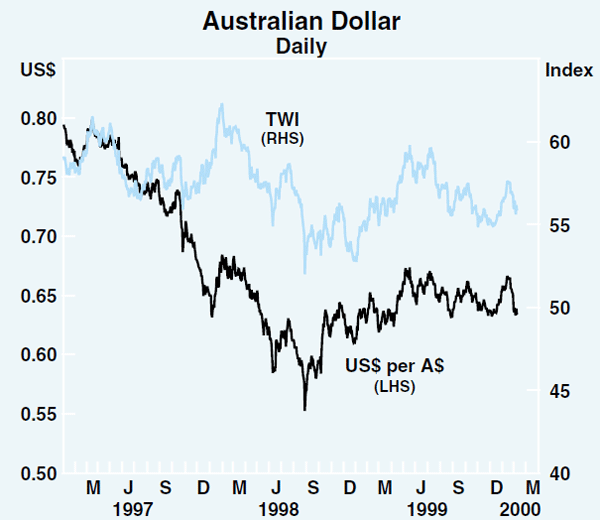
The Australian dollar for the most part has continued to trade within the range US63 to US67 cents, in which it has moved since early in 1999. The exchange rate fell towards the bottom of this range in the closing months of 1999, as overseas market participants seemed to reduce their exposures ahead of Y2K. It moved higher temporarily early in the new year, as investors rebuilt their holdings. The exchange rate was volatile ahead of the policy decisions of early February, initially dropping in late January by US3 cents overnight to a low of US62.2 cents. The catalyst for this sharp fall was the release of favourable CPI data in Australia, which reduced market expectations of monetary policy tightening, at the same time as data releases in the US pointed to the possibility that monetary tightening in that country might be greater than had been expected. Such a combination of moves would have resulted in interest differentials moving in favour of the US. In the event, with the early-February tightening in monetary policy larger in Australia than in the United States, the currency recovered to around US63.5 cents, though it remained well below its earlier level.
The trade-weighted index in recent months has behaved in a similar way to the rate against the US dollar (Graph 32). The index is currently about 56, around the middle of the range that has prevailed over the past year.
Financial aggregates
Growth in credit picked up in the December quarter, following a brief slowdown in the September quarter. In the three months to December, credit grew at an annual rate of 12½ per cent, a little above the rates seen in the first half of the year. This pick-up reflected a partial recovery in business credit and the continued acceleration of credit provided to households. Personal credit grew by 4½ per cent over the three months to December. Two components of this, margin lending for the purchase of shares and credit card lending, increased particularly strongly. Margin lending (including lending by brokers) rose by 12 per cent over the December quarter to stand at $5.8 billion. At year-end, margin lending by banks accounted for 11 per cent of personal loans outstanding (excluding credit cards). Personal credit card lending rose by 6½ per cent over the December quarter and by 22½ per cent over the year; in part, this strength reflects the increasing use of credit cards as a means of payment.
The 8 per cent growth in currency over the year to December reflected the strength of the economy. In contrast to currency, growth in the broader monetary aggregates slowed in the December quarter, with annualised growth in M3 and broad money of 3.7 per cent and 3.0 per cent over the quarter. The growth in these aggregates over the second half of the year was well down from that over the six months to June 1999 and the six months to December 1998, primarily reflecting slower growth in the holdings of certificates of deposit. These fluctuations reflect the effects of intermediaries changing their funding sources in response to changing relative costs. There also appears to have been a shift to bank deposits away from NBFIs in the December quarter.
Funds under management increased marginally in the September quarter, following growth of 4.6 per cent in the June quarter, and have increased by 14.3 per cent over the year to the September quarter (Table 11). The slower growth in the September quarter reflected the negative valuation effects arising from falls in share prices in the quarter. Nevertheless, managed funds increased their holdings of domestic equities despite the fall in share prices. Within the total, cash management trusts recorded the strongest quarterly growth in assets, while assets of public unit trusts fell during the quarter, mainly due to the reorganisation of some trust assets as companies. Managed funds increased their exposure to long-term securities in the September quarter, reversing a sustained trend away from this asset class, and decreased their exposure to short-term securities. Funds' exposure to overseas assets continued its trend increase.
|
Quarterly percentage change |
Annual percentage change |
Share of total Per cent |
|
|---|---|---|---|
| By institution: | |||
| Superannuation funds | 1.4 | 17.5 | 45 |
| Life insurance offices | −1.5 | 7.6 | 31 |
| Public unit trusts | −0.5 | 22.9 | 18 |
| Cash management trusts | 3.5 | 9.9 | 4 |
| Other | −1.5 | −1.4 | 2 |
| By asset: | |||
| Cash, deposits and loans | 1.5 | 11.7 | 13 |
| Short-term securities | −9.4 | 6.2 | 11 |
| Long-term securities | 5.2 | 4.6 | 14 |
| Equities and units in trusts | 1.6 | 19.3 | 29 |
| Assets overseas | 2.9 | 26.3 | 18 |
| Other | −3.7 | 10.3 | 14 |
| Total | 0.2 | 14.3 | 100 |
Non-government bond market
The Australian non-government bond market as a whole (i.e. issues of bonds by financial, non-financial and non-resident issuers), continues to show strong growth. Issues tapered off in November and December due to seasonal influences and Y2K concerns but rebounded in January. The value of non-government bonds outstanding was $64 billion at end January (Graph 33).
Inflation Trends and Prospects
Recent developments in inflation
Consumer prices
Measures of consumer prices suggest that inflation increased during the course of 1999. The Consumer Price Index increased by 0.6 per cent in the December quarter, and by 1.8 per cent over the past year (Graph 34). The increase over the year was reduced by the net effect of a number of changes to tax arrangements; in particular, the health insurance rebate, which reduced the CPI in the March quarter 1999, and reductions in wholesale sales taxes and increases in cigarette taxes, which affected the CPI in the December quarter. Excluding these effects, the CPI rose by around 2¼ per cent over the course of 1999, compared with 1.6 per cent over the previous year. A range of measures of core or underlying inflation also indicate price increases of around 0.6 per cent in the December quarter and 2¼ per cent over the year, up from their recent trough of around 1½ per cent (Table 12).
| Quarterly | Year-ended | ||||
|---|---|---|---|---|---|
| September 1999 |
December 1999 |
September 1999 |
December 1999 |
||
| Headline CPI | 0.9 | 0.6 | 1.7 | 1.8 | |
| – Tradeable component | 0.7 | −0.2 | 1.6 | 1.3 | |
| – Non-tradeable component | 1.1 | 1.2 | 1.8 | 2.3 | |
| Private-sector goods and services | 0.6 | 0.6 | 2.0 | 2.2 | |
| Weighted median price change(a) | 0.7 | 0.6 | 2.1 | 2.4 | |
| Trimmed mean price change(a) | 0.8 | 0.5 | 1.9 | 2.2 | |
| (a) For details on the calculation of these measures, see ‘Measuring Underlying Inflation’ , Reserve Bank of Australia Bulletin, August 1994. | |||||
A sharp increase in petrol prices contributed to the CPI increase over the past year. Petrol prices rose by 0.6 per cent in the December quarter, and by 12.2 per cent over the year. These increases have flowed from the substantial rise in the international price of crude oil, which has more than doubled since early 1999. The increase in petrol prices in the December quarter was somewhat smaller than might normally have been expected to flow through from the rise in crude oil prices. If oil prices remain at current levels, some further increase in petrol prices at the retail level can be expected in the near term (Graph 35). Petrol prices contributed 0.5 percentage points to the increase in the CPI over the past year, although this effect is largely excluded from underlying inflation measures.
House purchase prices have also been contributing strongly to CPI increases recently. The measure of house purchase prices used in the CPI, which captures the price of new project homes excluding land, increased by 3.2 per cent in the December quarter and by 8 per cent over the past year. This was well in excess of increases in building materials prices, and reflects the strong demand conditions prevailing in the residential construction sector at present. To some extent, demand in this sector is likely to have been boosted by the anticipated impact of the GST on building costs, although as noted above in the chapter on ‘Domestic Economic Activity’, the strength of housing demand has also reflected more general factors, including the growth of household incomes and wealth and the low cost of borrowing. Prices of some other items likely to be affected by the forthcoming introduction of the GST have also moved significantly in recent quarters; for example, the costs of house, home-contents and vehicle insurance all recorded strong rises in the December quarter.
The increases in these prices in the December quarter were partly offset by declines in the prices of fresh fruit, motor vehicle repair and servicing, audio, visual and computing equipment, clothing and motor vehicles. Part of the decline in the prices of audio, visual and computing equipment recorded in the December quarter was related to the reduction in the wholesale sales tax rate applied to these items last July.
The price of the basket of tradeable goods and services measured by the ABS fell by 0.2 per cent in the December quarter and increased by 1.3 per cent over the year, with much of that increase attributable to the rise in fuel prices. Within the basket, prices for motor vehicles have declined further over the past year, although at a slower pace than in previous years. Motor vehicle prices picked up briefly in the September quarter, reflecting efforts to rebuild margins in the industry, but more recently there is evidence of further discounting, with prices declining again in the December quarter. The renewal of discounting may be related to the stronger exchange rate seen in the first half of 1999 and the influence of the forthcoming reduction in sales tax on cars.
Prices of other goods with a high import penetration, including clothing, household appliances, and audio, visual and computing equipment have also fallen both in the December quarter and over the past year. While, as noted above, the decline in this latter category was partly in response to tax changes in the second half of last year, this component of the CPI has been declining for some years and fell by more than 18 per cent during 1999.
The prices of non-tradeables, which are mainly services, increased by 1.2 per cent in the December quarter, a similar increase to that recorded in the previous quarter, to be 2.3 per cent higher over the past year. The government's health insurance rebate, introduced in the March quarter 1999, has held down this annual rate of increase; over the past two quarters, private-sector services prices, which exclude the health insurance rebate, have risen at an annual rate of more than 4 per cent (Graph 36).
Producer prices
Producer prices in the manufacturing industry picked up strongly in the December quarter. Prices of inputs used by manufacturers increased by 4.9 per cent in the quarter (the highest quarterly increase in nine years) and were 7.4 per cent higher than a year earlier (Table 13). Almost half of the increase in the quarter was attributable to higher oil prices, although increases in other commodity prices and a weaker exchange rate also contributed to higher prices of imported inputs late in the year. Reflecting these increases in costs, output prices of manufacturers picked up noticeably in the second half of 1999, rising by more than 3 per cent over the two quarters. Petrol prices contributed strongly, although there were more broadly based increases in a range of other output prices. Excluding petrol, manufacturers' output prices increased by just over 2 per cent over the two quarters; significant price increases were recorded for basic metal products, which rose in line with world market prices, and food, beverages and tobacco. Buoyant demand in the housing industry led to a further increase in house-building materials prices in the December quarter, of close to 1 per cent, although prices of other building materials remained subdued.
|
Dec qtr 1999 |
Year to Dec qtr 1999 |
|
|---|---|---|
| Manufacturing | ||
| Input prices | 4.9 | 7.4 |
| – Domestic | 6.1 | 11.4 |
| – Imported | 3.0 | 1.8 |
| Final prices | 1.4 | 3.1 |
| – Excluding petroleum | 1.2 | 1.5 |
| Construction | ||
|
Materials used in house building |
0.8 | 1.5 |
|
Materials used in other building |
0.2 | 0.2 |
| Merchandise trade | ||
| Export prices | 4.3 | −1.5 |
| Import prices | 2.2 | −2.8 |
Labour costs
Indicators of aggregate wage costs available up to the September quarter suggest that wages growth remained moderate (Table 14). The Wage Cost Index (WCI), excluding bonuses, increased by 3 per cent over the year to the September quarter, continuing a run of observations around 3–3¼ per cent per annum. Average weekly ordinary-time earnings (AWOTE) rose by just 0.3 per cent over the three months to August 1999, and by 2.1 per cent over the year to August. The August data recorded a decline in private-sector male AWOTE, which is likely to have reflected compositional change rather than an actual decline in wage rates for that group. This suggests that overall AWOTE growth is probably understating the increase in wage rates, and the WCI, which is less affected by compositional change, is likely to be providing a more reliable reading.
| Mar 1999 | June 1999 | Sep 1999 | Year to Sep 1999 | |
|---|---|---|---|---|
| Quarterly | ||||
|
Wage Cost Index (total pay, excluding bonuses)(a) |
||||
| Private | 0.7 | 0.6 | 1.0 | 2.9 |
| Public | 1.5 | 0.3 | 0.9 | 3.4 |
| Total | 0.9 | 0.6 | 0.9 | 3.0 |
| AWE survey | ||||
|
AWOTE – Private |
0.0 | 1.6 | −0.1 | 1.8 |
| – Public | 1.3 | 0.0 | 1.2 | 3.9 |
| – Total | 0.2 | 1.1 | 0.3 | 2.1 |
| AWE | 0.0 | 1.3 | −0.9 | 0.4 |
| Annualised | ||||
| New federal enterprise agreements | ||||
| Private | 3.9 | 3.8 | 3.6 | |
| Public | 3.5 | 3.5 | 3.5 | |
| Total | 3.8 | 3.6 | 3.5 | |
| (a) Not seasonally adjusted | ||||
Average annualised wage increases from new federal enterprise agreements remained at around 3½ per cent in the September quarter (Graph 37). The increase in public-sector agreements was unchanged in the quarter, while the increase for private-sector agreements fell slightly. Replacement agreements in the September quarter yielded lower wage increases than the expiring agreements they replaced.
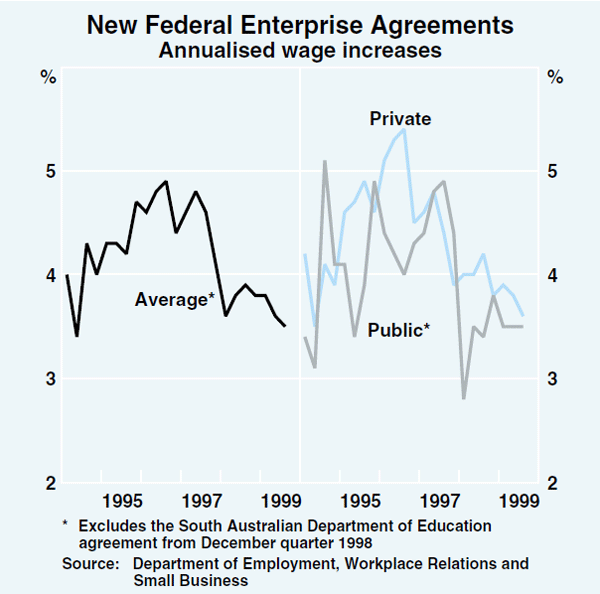
During 2000, a number of enterprise agreements in key sectors of the economy will be up for renegotiation, especially in the manufacturing sector. On recent indications, the process of negotiation appears likely to be conducted more at the industry level than has typically been the case in recent years. Wage increases being sought by some unions are greater than those specified in current enterprise agreements, though they are not dissimilar to the initial claims in previous campaigns. In Victoria, construction unions are also seeking a reduction in standard working hours. In the manufacturing sector, a common expiry date for all manufacturing agreements is being sought. In some instances, claims seek to introduce clauses that would allow for either renegotiation of agreements or additional wage rises if the effect of the GST on the price level is larger than expected.
Growth in executive pay, as recorded by the Mercer Cullen Egan Dell survey of around 500 companies, has been relatively stable. The December quarter survey estimates the growth in the base salaries of executives to have been around 4¾ per cent over the past year. The recorded pay increases in this survey do not include any bonuses received or returns from participation in corporate share schemes.
In the December quarter NAB survey of non-farm businesses, expectations of labour cost increases were broadly in line with the average quarterly increases reported in the survey over the past two years. Nonetheless, as discussed earlier, the survey points to some tightening in labour market conditions, with businesses reporting that they are finding it increasingly difficult to attract suitable labour (see Graph 21).
The Australian Industrial Relations Commission will begin hearings for the 2000 Safety Net Review in March. The Australian Council of Trade Unions is seeking a $24 increase in weekly award rates between the federal minimum wage ($385.40 per week) and $537.80, and a 4.5 per cent increase in award rates between $537.80 and $930 per week. The Australian Chamber of Commerce and Industry has argued that the current federal minimum wage should be maintained.
Inflation expectations
Most measures of inflation expectations have risen noticeably since the first half of last year, as the increase in the price level associated with the introduction of the GST in mid 2000 has entered the forecast horizon. The rise in inflation expectations appears also to reflect, in part, an increase in expected ongoing inflation.
The past few surveys of consumers' inflation expectations, conducted by the Melbourne Institute, have reported a median year-ahead inflation expectation of over 5 per cent (Graph 38). This result has increased from a low point of 3 to 3½ per cent in the early part of 1998. Part of the increase is likely to have reflected the general strength of the economy and the gradual upward drift in inflation itself. More recently, the prospective implementation of the tax package has also become a factor. As well as the general rise in the median expectation of inflation, there is some evidence of increased uncertainty about future price developments. Around one-fifth of consumers surveyed in January expected prices to rise by the GST rate of 10 per cent over the year ahead, almost double the percentage of respondents expecting a 10 per cent increase a year ago. These responses do not appear to have allowed for the offsetting price reductions from the abolition of some indirect taxes as part of the overall package.
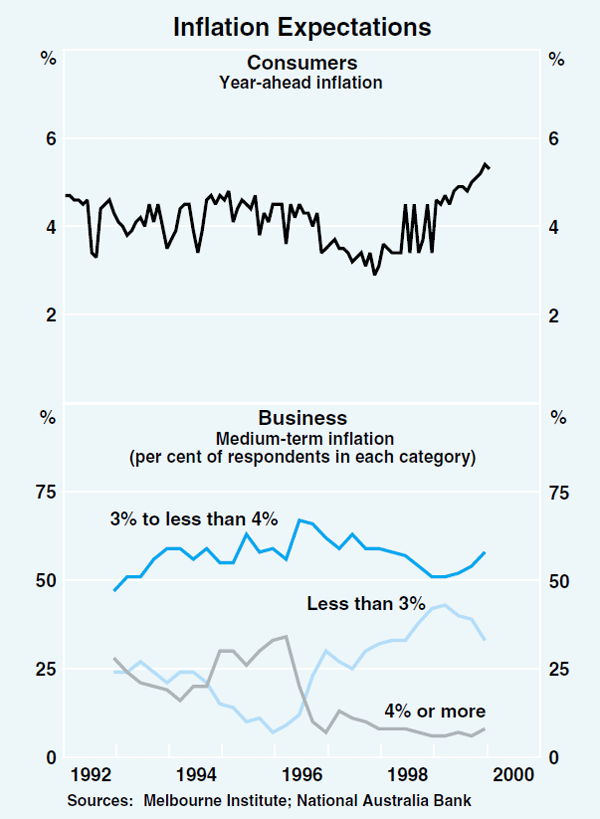
The inflation forecasts of financial market economists, as surveyed by the Bank, indicate some slight upward revisions. Median forecasts for CPI inflation were revised up to 2.7 per cent for the year to June 2000, and 2.5 per cent (excluding the GST) for the year to June 2001 (Table 15). Most respondents have also revised up their expectations of the first-year effect of the GST on the price level, following the release of official estimates last November. Their median forecast for the first-year effect is now 2.8 per cent, with forecasts ranging between 2 and 3½ per cent.
| Year to June 2000 | Year to June 2001 | ||||||
|---|---|---|---|---|---|---|---|
| July 1999 |
October 1999 |
January 2000 |
July 1999 |
October 1999 |
January 2000 |
||
| Market economists(a) | |||||||
| CPI | 2.2 | 2.6 | 2.7 | 4.2 | 4.9 | 5.2 | |
| – Excluding GST | 2.2 | 2.4 | 2.5 | ||||
| Union officials(b) | |||||||
| ‘Inflation’ | 2.0 | 2.1 | 2.2 | 2.5 | 3.3 | 3.5 | |
|
(a) RBA survey of financial market economists. (b) ACIRRT survey of trade union officials. |
|||||||
Trade union officials, as surveyed by the Australian Centre for Industrial Relations Research and Training (ACIRRT), have also revised up their forecasts slightly. The majority of respondents have now incorporated a GST effect in their forecasts.
Business surveys suggest that price increases are expected to be slightly higher in the near term than they have been in recent years. The December quarter ACCI-Westpac survey of manufacturers reported a further increase in the net balance of firms expecting to raise prices in the quarter ahead. The quarterly NAB survey reported a pick-up in actual price rises in the September and December quarters of 1999, with this trend expected to continue in the quarter ahead. The growth of actual purchase costs has also picked up in recent quarters, and is expected to rise further in the current quarter. In a special question included in the latest NAB survey, respondents were asked to estimate the impact of the GST on their own prices by the end of 2000; this yielded a weighted average response of 4 per cent.
Medium-term inflation expectations of businesses have increased a little over the past year. The majority of respondents to the quarterly NAB survey expect inflation in the medium term to be 3–4 per cent per annum, with the proportion of respondents in this category increasing over the past year; the proportion reporting that they expect less than 3 per cent inflation in the medium term has correspondingly declined (Graph 38). Longer-term inflation expectations of financial market participants, as implied by the difference between yields on nominal and indexed 10-year bonds, have risen to nearly 3¾ per cent in early 2000, about ¾ of a percentage point higher than the average prevailing in the second half of 1999. While the differing liquidity characteristics of the nominal and indexed bond markets can be important in interpreting movements in this yield differential, there appears to have been a significant increase in inflation expectations in recent months, only part of which can be attributed to the likely impact of the GST.
Inflation outlook
Most measures of underlying inflation have edged upwards over the past year, from a trough of around 1½ per cent to between 2 and 2½ per cent at present. CPI inflation has been more volatile but has also shown a clear upward trend. Excluding the health insurance rebate introduced in early 1999 and the net effect of other recent tax changes, the increase in the CPI over the past year was 2¼ per cent, about the same rate as shown by the underlying measures.
Part of this pick-up in inflation, as discussed above, has reflected sector-specific influences, notably the sharp increase in international oil prices and the strength of demand in the housing sector. But more generally, the increase in inflation pressures appears consistent with the overall strength of domestic demand conditions. Over the past three years, output has increased at an average annual rate of over 4 per cent, a pace that probably exceeds the longer-run growth in the economy's productive potential and implies a gradual absorption of surplus productive capacity. This has been evident in declining unemployment and rising levels of capacity utilisation, which are now approaching previous cyclical highs. Demand has continued to increase strongly in the recent period, supported by rising wealth and low borrowing costs, and businesses in most industries are reporting very favourable trading conditions. In these circumstances, some pick-up in price pressures is not surprising.
To date, the increase in inflation has remained relatively mild. Despite the strength of demand, product markets remain highly competitive, and the economy does not, in general, appear to have run up against significant capacity constraints. The inflation performance has also benefited from the continued modest rate of increase in labour costs. Up to the September quarter last year (the latest official data available), wage increases remained well contained, and available data on federal enterprise agreements have continued to point to wage settlements around the 3½ per cent mark. In addition the economy has sustained a relatively high average rate of productivity growth in recent years, contributing to the containment of unit labour costs and boosting growth of the economy's productive potential.
While it is possible that these factors will continue to restrain inflation in the period ahead, the balance of risks at present is that inflation will increase further. Demand is likely to continue to grow strongly, a prospect that will be enhanced by the strengthening international environment. Labour markets are clearly tightening, with job vacancies at high levels and some businesses beginning to report increased difficulty in obtaining suitable labour. Inflation expectations of consumers and, to a lesser extent, businesses, have also increased. As noted above, petrol price increases are likely to contribute further to the CPI over the next couple of quarters, and they will also contribute indirectly to production costs over a more protracted period. At the same time, high rates of productivity growth may remain a moderating influence on inflation pressures.
The Bank's assessment is that a further gradual increase in inflation is likely over the period ahead. The year-ended increase in the CPI should show a noticeable increase in the March quarter 2000 as the decline in the March quarter 1999 drops out of the calculation. By the June quarter 2000, the annual CPI inflation rate should be around 2¾ per cent. Some of this will be due to higher oil prices, so that underlying inflation should be around 2½ per cent.
Beyond that time, the ongoing trend in inflation will be obscured temporarily by the once-off effect of the introduction of the GST. It will therefore become more difficult in the short term to assess whether the tendency for inflation to rise in 1999/2000 is continuing into the following year. Nonetheless, the Bank will seek to abstract from the once-off GST effect on the CPI for the purposes of decisions on monetary policy.
At this stage, the Bank's assessment is that inflation will return to the target zone after the GST effect has passed. This depends crucially on the assumption that there will be no second-round effects of the GST on wages and prices, arising through opportunistic pricing decisions or through additional compensation being reflected in wage agreements. Should that assumption prove unfounded, inflation would pick up more quickly, with the attendant risk of a more general increase in ongoing inflation expectations. This is a risk that will require close watching in the period ahead. Other uncertainties surrounding the inflation outlook are associated with prospects for demand and growth. There is some risk that demand pressures may intensify further, particularly given the strength of the global economy, although that risk will have been reduced by recent moves to a less accommodative monetary policy stance in Australia and abroad.
Footnote
For more detail, see ‘The Impact of Y2K on Financial Markets in Australia’, Reserve Bank of Australia Bulletin, January 2000. [1]