Speech Economic Issues in 2004

Malcolm Edey
Assistant Governor (Economic)
Address to Australian Industry Group
Economy 2004 – Forecasting Industry Prospects Forum
Sydney –
I thank the Australian Industry Group (AIG) for the invitation to speak today on economic issues in 2004.
I would like to start by reviewing the international economy and then move on to look at the current situation in Australia.
The Global Economy in 2003: A Year of Two Contrasting Halves
When I spoke at this conference a year ago, it was a time when risks to the global economy seemed to be increasing. Broadly speaking, the first half of 2003 was a period of disappointing results in the major countries, and generally declining confidence about the prospects for recovery. The point of maximum pessimism, at least among mainstream economic forecasters, occurred at about the middle of the year. Since then, economic conditions, and expectations about future growth, have been steadily improving, so that prospects now are quite a bit better than at this time last year.
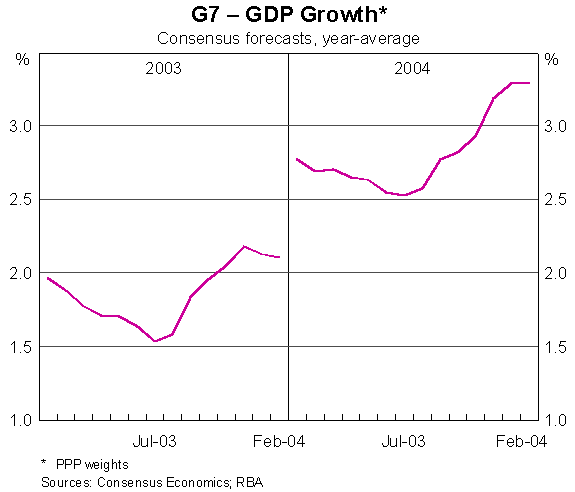
We can track these trends by looking at the evolution of Consensus forecasts for the major economies. They show virtually continuous downward revisions to expected growth rates in each month during the first half of 2003. By June, growth for the Group of Seven Countries (G7) group of countries in 2003 was expected to be around 1½ per cent – a disappointing outlook particularly when we consider that below-average growth had also been recorded in each of the two previous years. Growth in 2004 was expected to pick up to 2½ per cent, or around its long-run average, but I suspect this expectation was not held with much conviction; forecasters routinely predict a return to average growth in future years, but at the time there was not much concrete evidence that the projected pick-up was getting started.
There were several reasons for this drift towards pessimism:
- The first was a run of rather disappointing data in the early and mid months of 2003, especially in the US, suggesting that growth was faltering;
- Another was that confidence in the early months of last year was affected by the conflict in Iraq;
- A third factor was the Severe Acute Respiratory Syndrome (SARS) outbreak, which had a big effect on a number of east Asian countries in the second quarter.
All of these negative factors dissipated in the second half of 2003: so, looking at the same forecasts, we can see a clear turnaround in the outlook since mid-year. With most of the figures for 2003 now in, growth in the major economies is estimated to have been 2.2 per cent for the full year, or about half a percentage point higher than the mid-year expectation. More importantly, given the recent gain in momentum, 2004 is now expected to be an above-average year. This is the case whether we measure performance in terms of the major industrial economies, as shown here, or using a broader group of Australia's most important trading partners.
With that background, let me look at conditions in the main economic regions in more detail.
The United States
A lot of this recent turnaround has been driven by developments in the United States. At various times during the last couple of years, the US has been subject to some quite gloomy analysis about whether their recovery would be sustained. This sort of thing is not unusual when a recovery is still at an early stage. The same thing happened during the initial recovery period in the early 1990s – even though, with hindsight, that proved the start of an impressive expansion through the rest of the decade.
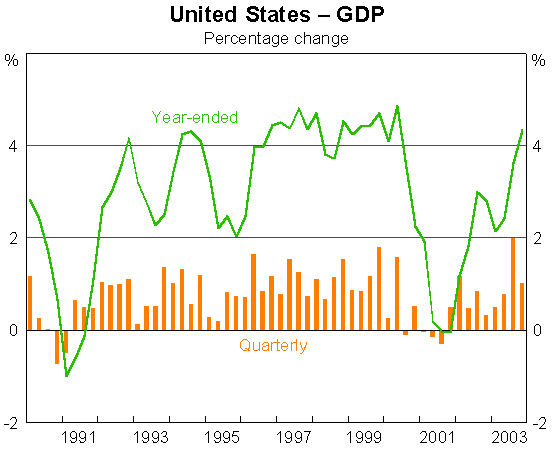
In the current cycle, the US economy returned to growth just over two years ago – in the fourth quarter of 2001. The recovery did look quite hesitant for a while, and growth seemed to falter in the first half of 2003. But it then accelerated sharply in the second half. The overall pace of growth in the US during the year picked up to 4.3 per cent, and an annualised pace of 6 per cent in the second half.
We can get a better sense of the forces driving the US business cycle by comparing the spending patterns in the household and business sectors. US households continued to expand their spending throughout this recent cycle, with the rate of growth falling only modestly during the downturn. In contrast, there was a very pronounced cycle in business investment. This went from growing at 10 per cent or more a year during the late 1990s, to falling at that pace when the economy went into recession – a very sharp reversal. So, if we analyse the US cycle in terms of the contributions made by the spending of the major sectors, the downturn was primarily accounted for by the sharp cutback in business spending. This comparison points to the deeper imbalances that brought on the US recession in the first place – namely, the equity market correction, balance-sheet stress in the US corporate sector, low profitability, and an investment overhang, particularly in Information Technology (IT) and communications, all of which weighed on the ability of US businesses to invest.
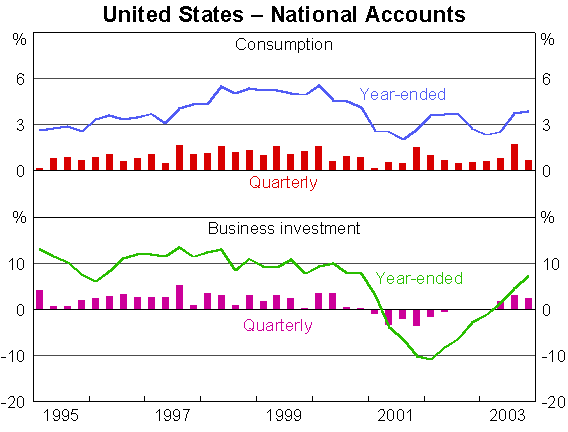
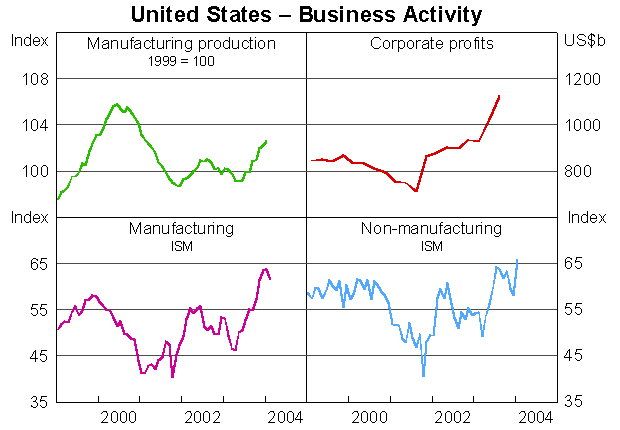
In the early stages of the US recovery, business investment bottomed out, household spending continued to grow, and the economy received a substantial boost from macro policy settings. All this was sufficient to generate a modest pace of growth through 2002 and the first half of 2003. Debate then focused on the durability of the recovery. In particular people were looking for evidence of the recovery becoming more broadly based, which in turn would require that the imbalances in the business sector start to be wound back. We are now seeing this occurring, on several fronts:
- Profitability has rebounded. On a national accounts basis, which is the measure least distorted by options-based incentives, profits of US corporations have increased by 25 per cent over the past year;
- Indicators of business confidence have improved, to levels normally associated with above-average growth in the economy;
- The manufacturing sector, which contracted sharply during the recession, has returned to fairly solid growth;
- Business investment is now expanding again, growing by 7 per cent over the past year.
The one missing element in all this is still a convincing pick up in employment, although even in that area there have been some more encouraging signs recently. Overall, the prospects for the US economy are looking firmer than they have been for some time. This is reflected in the US Fed's most recent policy report, released earlier this month, which forecasts growth this year of around 4½ to 5 per cent.
Japan
Stronger conditions in the US have obviously been a big part of the global pick-up over the past six months or so, but it certainly has not been confined to the US. In particular a number of economies in the east Asian region are now performing more strongly.
Japan's economic performance during 2003 was surprisingly good, and the most recent news confirms that the economy was picking up speed towards the end of the year. The latest national accounts show the economy growing by 1.7 per cent in the December quarter (which was faster than the US) and by almost 4 per cent over the year as a whole.
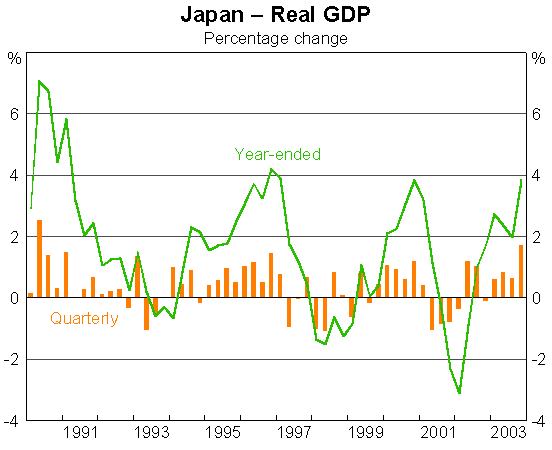
Most analysts would be inclined to discount these figures to some extent, owing to some quirks in the construction of the national accounts; but even so, there is no doubt that the Japanese economy is doing better now than it was six months or a year ago. Even discounting the official Gross Domestic Product (GDP) numbers, a broader range of indicators is telling the same story:
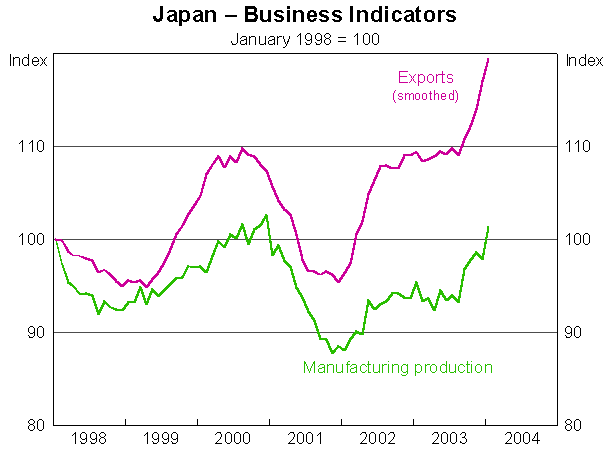
- Industrial production has been rising over the past year, and seemed to accelerate towards the end of the year. Business confidence also improved;
- Closely related to that, Japan's exports have picked up quite sharply over the last six months or so, especially to China. In fact, international trade across the east Asian region has been expanding rapidly during this period;
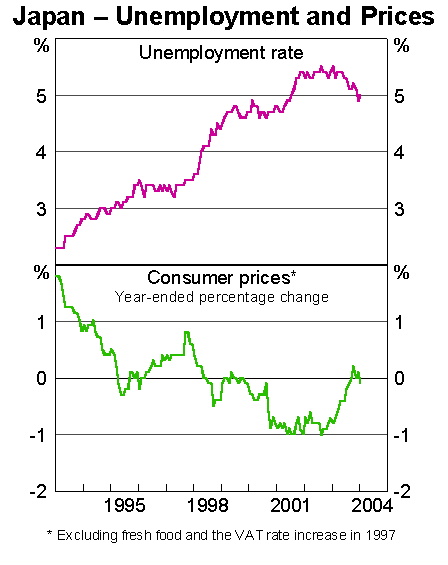
- The unemployment rate has been coming down gradually over the past year, consistent with the economy growing at an above-trend pace;
- It also seems that the rate of deflation has been declining. Over the latest year, core consumer prices in Japan were broadly flat, whereas until fairly recently they were falling at a rate of around 1 per cent a year.
To put all this in perspective, the growth spurt comes at the end of a decade of sub-par performance, when growth has been held back by some serious structural imbalances, especially in the form of excessive debt. I don't want to give the impression that the Japanese economy is suddenly in the clear. But even during this decade of underperformance, Japan has gone through cyclical fluctuations around that trend, and it is at least clear that they are in the upward phase of one of these cycles at the moment. We should also recognise the potential for positive interaction between the debt overhang and growth – a growing economy, as it is now, is more likely to be one in which debt imbalances are being wound back and balance sheets are being repaired. We are seeing some signs of that occurring at the moment, with business debt falling in Japan and profitability recovering.
East Asia
Elsewhere in east Asia, as I already alluded to, there was a strong upswing in the second half of 2003. China's economy is taking on increasing importance as it continues to expand year by year. A few figures can quickly convey this:
- The Chinese economy in purchasing-power-parity terms is now 80 per cent larger than that of Japan;
- It is also larger than the rest of the east Asian economies (outside Japan) combined;
- China now accounts for around 5 per cent of global trade, up from about 2 per cent at the beginning of the 1990s, and at current growth rates will soon overtake Japan on that score.
| Share of World GDP* | Share of World Trade | |||
|---|---|---|---|---|
| 1990 | 2002 | 1990 | 2002 | |
| Japan | 8.7 | 7.1 | 7.5 | 5.8 |
| China | 5.9 | 12.7 | 1.6 | 4.8 |
| Rest of east Asia | 5.8 | 7.1 | 10.3 | 12.8 |
|
*PPP weights Source: Thomson Financial |
||||
Another important development, as well as the growth of China's absolute weight in the world economy, has been the growth of intra-regional trade within east Asia, of which trade involving China accounts for a rapidly growing share. All of this makes China an increasingly important driver of business conditions for the region as a whole. In the latest year, China's economy has been growing at an exceptional pace, and accelerating in the second half. Official figures for GDP show annual growth of just under 10 per cent last year. In the industrial and internationally traded part of the economy, growth was much faster: industrial production was up by almost 20 per cent during the year, and growth of China's international trade was faster again.
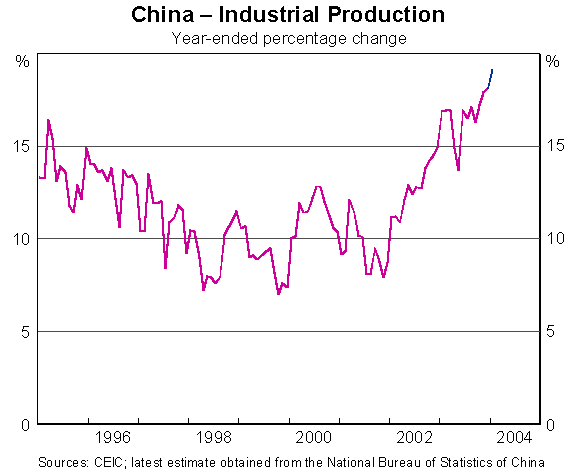
The second-half pick-up in the US last year will have assisted in this. In particular the revival of US business spending has contributed to an upswing in global Information Technology and Communications (ITC) demand, which has been to the benefit of producers in east Asia. But I also note that much of China's growth is domestically generated, with investment spending, in particular, surging during the past year. All up, the Chinese economy looks to have carried considerable momentum into the early part of this year. The same is true, though on a less spectacular scale, for the smaller east Asian economies, a number of which have bounced back strongly from the weakness seen in the first half of last year.
Euro Area
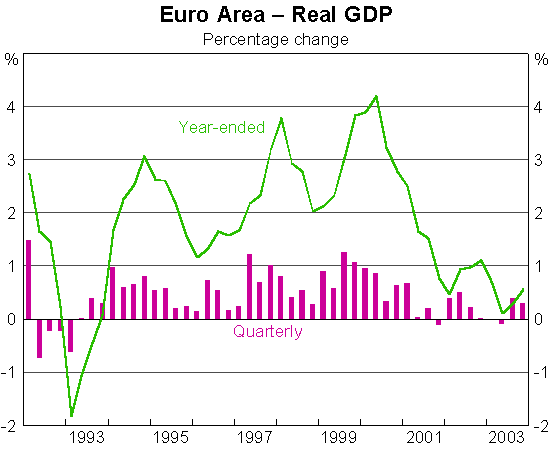
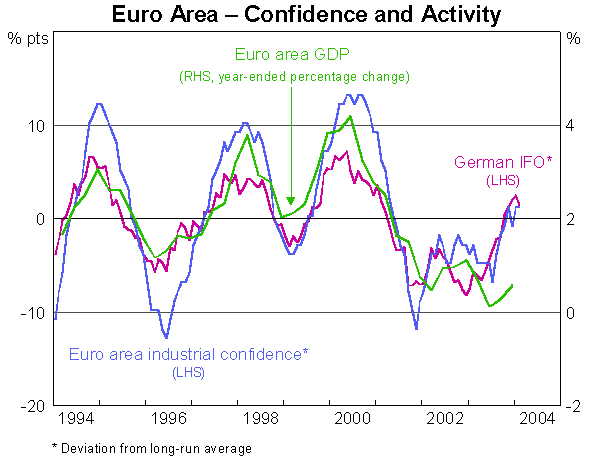
Let me make a few observations about Europe before moving on to Australia. Growth in the euro area in the last couple of years has been, by any standard, disappointing. I don't have time for a detailed analysis of why that might have been the case, but I think a couple of points can usefully be made. One is that this clearly has a structural dimension, reflecting the economy's underlying lack of flexibility and its capacity to grow: Europe has under-performed in comparison with the US and other major economic regions for some time, and that's unlikely to change quickly. A more immediate source of difference at the moment is that the European economy has had much less assistance from stimulatory economic policies than is the case in the US. For the last two years, growth in the euro area averaged less than 1 per cent, and the quarterly growth rates were negative in the first half of 2003. On the latest figures, there has been some improvement since then, but the recent growth is still only quite modest. One encouraging sign, though, is that business confidence in Europe has been improving for some months, which may be an indicator of better times ahead.
The Australian Economy
Turning to Australia now, I would like to make some general observations about our medium-term performance, and then say a few things about the current situation.
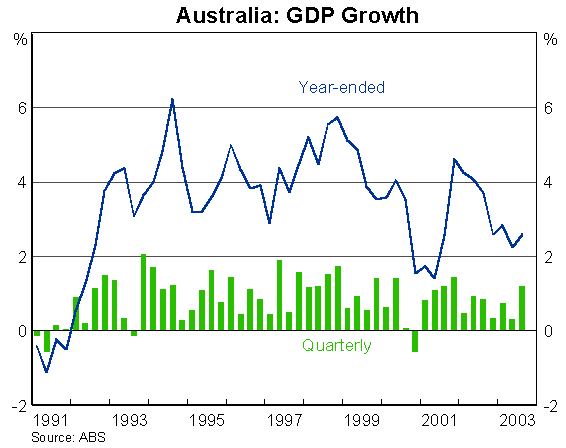
- First, to get some perspective on the present, it is worth reminding ourselves of the long-running nature of Australia's current economic expansion. The current expansion has been going since 1991, so it is now in its 13th year. During that time, the pace of growth has inevitably gone up and down, but no one, I think, could argue with the proposition that the average performance has been good, both in comparison to earlier experience in Australia and also compared with other advanced countries. Average real growth of the economy in the past ten years has been just under 4 per cent, exceeding the growth of most of the advanced countries with whom we would normally compare ourselves. (I haven't had the benefit of studying today's national accounts figures, but they certainly won't have materially changed that calculation.)
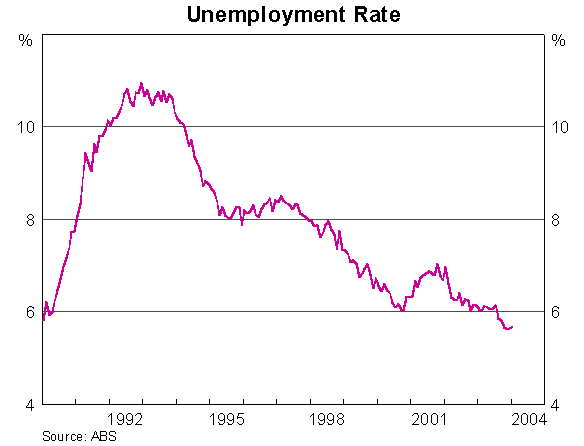
- Consistent with these strong average growth outcomes, this has been a period of falling unemployment. At the moment, the unemployment rate is close to its lowest level in more than 20 years. Last year, it moved down by a further half a percentage point.
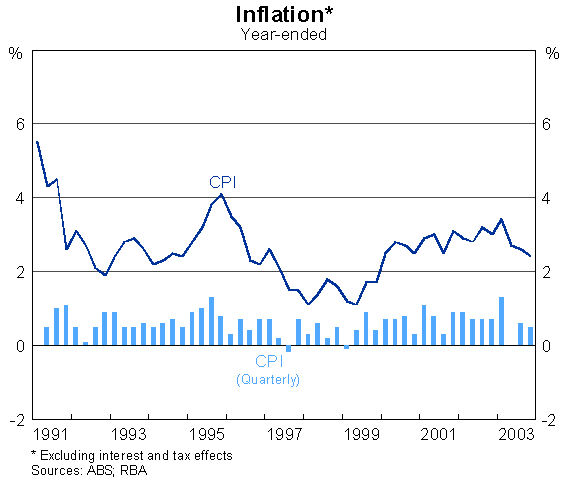
- This has also been a period in which inflation has been well contained. Since 1993, when the RBA first articulated the objective of 2–3 per cent average inflation, the actual average inflation rate has been 2.4 per cent. So, notwithstanding a degree of scepticism by some observers in the early part of this period, the objective for average inflation has been met.
In the most recent few years, the Australian economy has continued to perform relatively well, despite some periods when international conditions were highly unfavourable. In particular, the economy kept growing both through the east Asian crisis in 1997 and 1998, and then through the recessions in the US and Europe in the early part of this decade.
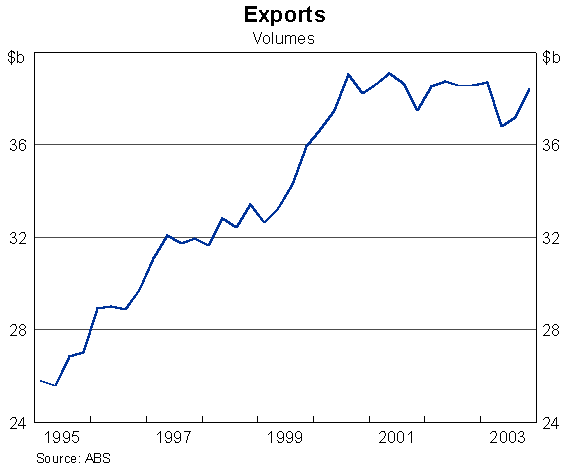
These outcomes reflected the net effect of two contrasting forces. On the one hand, the weak global environment in the early years of this decade formed a large cumulative drag on exports. Export growth during the period from mid-2000 to the end of 2002 was roughly zero, which means there was a significant loss of income and production compared with the sort of growth that would normally be expected. On top of this, exports weakened further in the first half of 2003, with the drought and the SARS outbreak both having a major impact at that time. Since mid 2003 the outcomes have been somewhat better in aggregate, but there were still some significant divergences across different parts of the export sector. Rural exports have picked up, benefiting from improved growing conditions. Resource and service exports have also begun to do better, though manufactured exports weakened. Overall, we are starting to see some benefits from the global pick-up that I talked about earlier, but the process is still at an early stage.
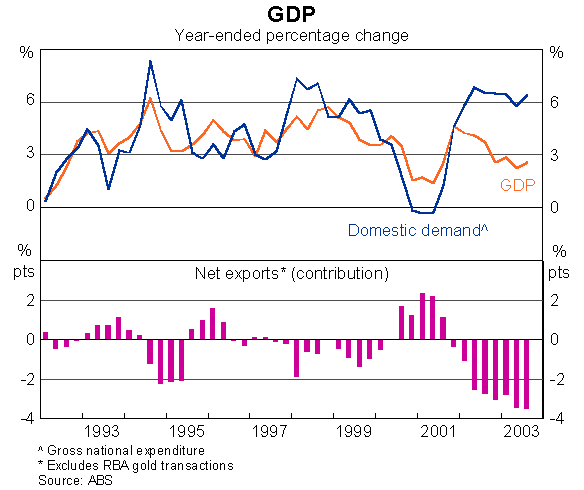
In contrast to the export sector, the domestically oriented parts of the economy posted well-above average growth in recent years. Over the last two years, domestic demand grew at an average rate of about 6 per cent a year – well above the medium-term growth in the economy's productive capacity. Once again, I don't have the benefit of having studied today's national accounts, but the information already to hand indicates that private spending continued to grow rapidly through to the end of last year. This was a result of several factors: solid business investment in the second half of the year, some further growth in housing construction, and particularly strong growth in household spending during this period. The boom in housing construction over the last couple of years has also had flow-on effects to other parts of the economy, including construction-related manufacturing businesses.
Concluding Comment
The net result of all this is that the Australian economy has generally grown at a pretty good pace over the last few years, despite an unfavourable international climate for much of that time. But prospects for the external sector seem to be improving. As I indicated earlier, the global scene has been looking more encouraging in the last six to nine months. In particular we are now seeing a solid pick-up in growth in a number of Australia's most important export markets, including the US, China, Japan and other parts of Asia. Over time these trends, if they continue, will be of benefit to our exporters, and offer the prospect of more balanced growth outcomes in Australia in the future.