Speech Some Comments on Securitisation

Ric Battellino
Assistant Governor (Financial Markets)
Talk to Australian Credit Forum 2004
Sydney –
Introduction
I am very pleased to be able to take part in this Third Australian Credit Forum. Australian debt markets are continuing to evolve at a rapid pace and forums such as this provide a valuable opportunity for market participants to gather and exchange views.
A lot of the credit for the development of the Australian debt markets can in my view be traced back to the decision of the Australian Government in 1982 to deregulate long-term interest rates and start issuing its bonds by tender. Government bonds are a very simple product compared with the debt instruments that are available today, but it was that simplicity that made them such an ideal product around which to develop a market infrastructure. Many of our neighbours in Asia are currently seeking to follow the same path towards the development of their bond markets.
Our government bond market has largely come full circle: it began modestly with a $350 million tender in 1982; bloomed to tenders as large as $1.6 billion in the early 1990s; and has since fallen back again, with recent tenders of around $300 million. But the infrastructure that it spawned remains, providing the basis for the diverse range of debt products that we see today.
In thinking about what to say to kick off the conference today, I quickly came to the view that there would not be much point in my talking to market practitioners about the details of the market. Rather, I thought a more productive approach might be to provide a macro perspective of recent trends in the market, which might serve as background to your discussions during the course of the day.
At the Reserve Bank, we tend to think of the Australian dollar non-government bond market as having four segments:
- bonds issued by financial institutions;
- bonds issued by Australian corporates;
- asset-backed bonds; and
- Australian dollar bonds issued in Australia by non-residents.
The mortgage-backed market
This first graph shows these four market segments. Three of the segments are of roughly equal size, each with outstandings of around $30 billion. But one – the asset-backed market – is roughly twice that size, having grown very quickly over the past five years. It is this market segment that I want to focus on in my talk today.
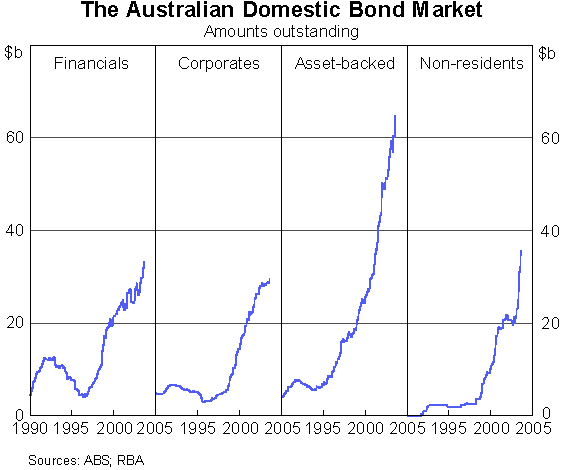
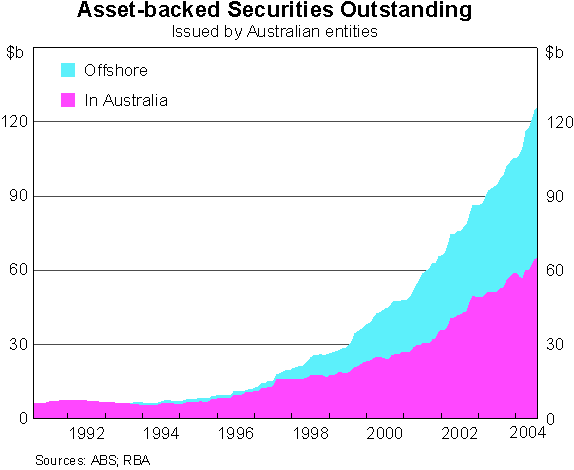
The bonds outstanding shown in Graph 1 relate only to those issued in Australia. Australian entities are also active in issuing bonds offshore. In the case of asset-backed securities, in addition to the $60 billion or so issued in Australia, a similar amount has been issued in offshore markets. If anything, offshore issues have been growing even more quickly than domestic issues recently (Graph 2).
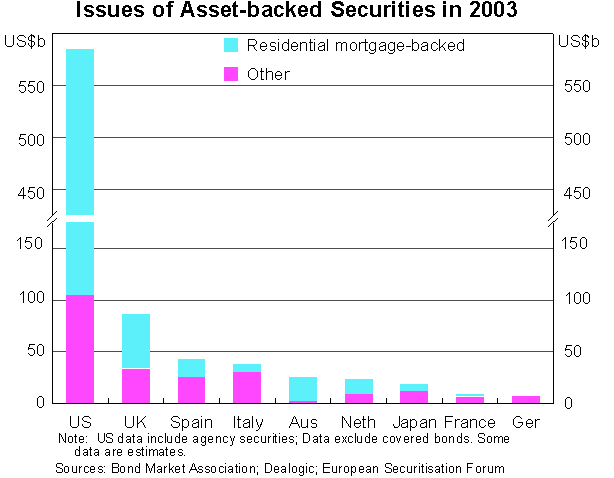
The Australian asset-backed market is now quite large by international standards. If we measure the market by the amount of bonds issued last year, the Australian market ranked fifth largest in the world after the US (which clearly dwarfs all other countries) the UK, Spain and Italy (Graph 3). The great bulk of asset-backed bonds issued in Australia are backed by residential mortgages. If we focus only on this segment, Australia ranks third, after the US and the UK.
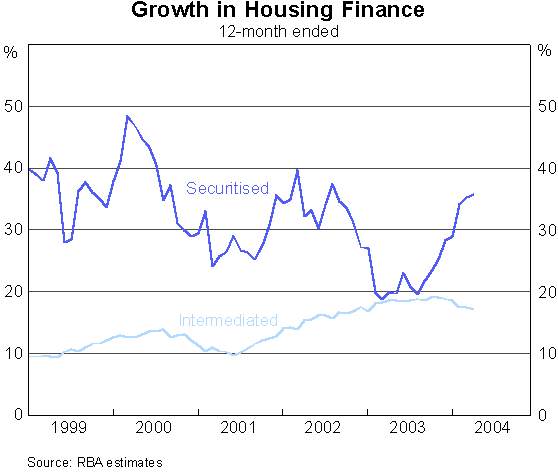
What is driving the rapid growth of this market in Australia? An obvious part of the answer is that the demand for residential mortgage finance has been growing at an exceptional rate in recent years. But this is only part of the story, as finance provided through mortgage-backed securities has been growing on average about twice as fast as mortgage finance provided through the balance sheets of financial intermediaries (Graph 4).
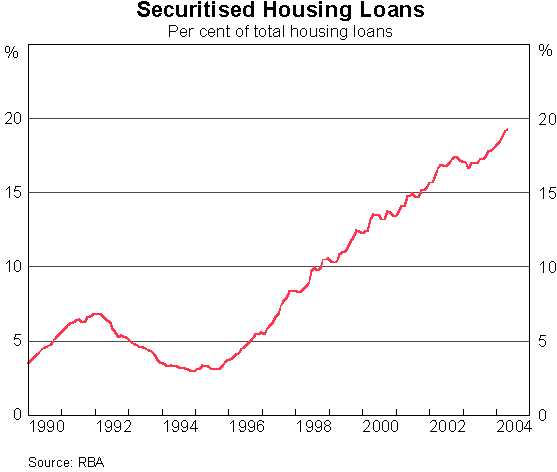
It is not surprising, therefore, that the share of housing loans that are securitised has risen substantially in recent years, from under 5 per cent in the mid 1990s to 20 per cent today (Graph 5). This is second only to the US, where over 50 per cent of mortgage loans are securitised, reflecting the activities of institutions such as Freddie Mac and Fannie Mae.
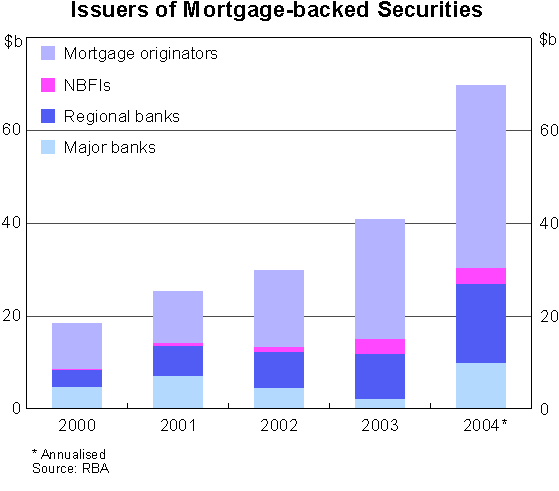
Some clues as to why there is a growing trend to securitisation of mortgages can be gathered by looking at who has been issuing the securities (Graph 6):
- The largest issuance has been by mortgage originators. These gained a foothold in the market in the mid 1990s after the fall in the general level of interest rates reduced the competitive advantage banks had enjoyed by being able to raise low-cost retail deposits through their branch networks.
- The second biggest source of securitised loans has been the regional banks. The amount of such loans generated by this group is roughly twice as large as that generated by the major banks. Given the smaller size of the regional banks, this obviously implies that regional banks are much more active than the major banks in securitising loans.
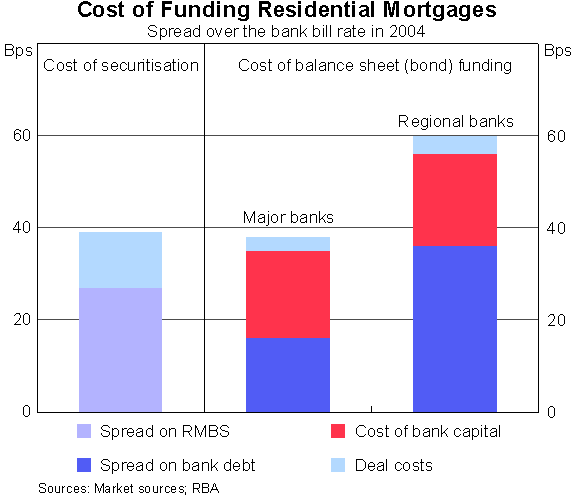
Regional banks are more active in securitising loans because they face higher costs in funding their balance sheets than do the major banks. For the major banks, the costs of securitising housing loans is broadly similar to the cost of funding such loans on their balance sheets (Graph 7). The spread on a bond issued by a major bank is in fact less than that on a mortgage-backed security and the deal costs associated with a bank bond are also lower, given the simpler nature of the transaction. However, after the bank allows for the cost of equity capital, the all-up cost of funding a housing loan on its balance sheet is broadly similar to the cost of securitisation. As such, major banks do not have a strong incentive to securitise loans and it is therefore not surprising that only a small fraction of their loans are securitised. For regional banks, on the other hand, the relative costs favour securitisation.
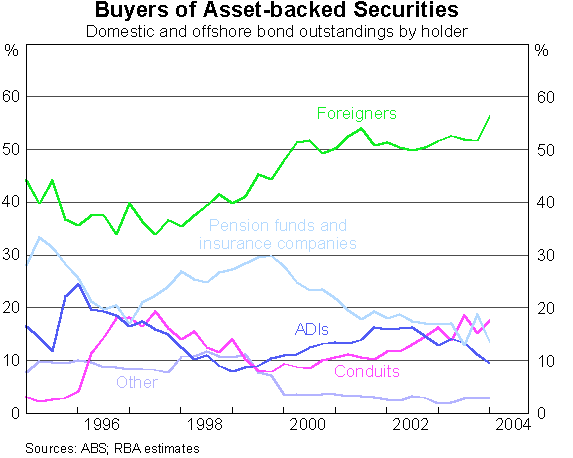
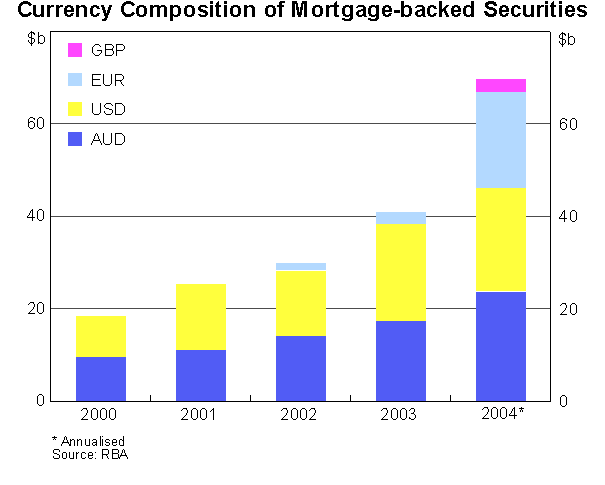
The second issue I would like to focus on is who is buying all the mortgage-backed bonds being issued. Taking account of offshore issues, more than half the bonds have been sold to foreigners (Graph 8). US dollar investors have traditionally been the main source of offshore demand, but recently there has been a marked shift into Europe as well (Graph 9). Australian banks have long found strong demand for their own debt securities in offshore markets, and issuers of asset-backed securities are now finding the same. Offshore investors seem to be very comfortable in taking on exposure to the Australian financial system in general and the residential housing sector in particular.
Domestic pension funds and insurance companies, in contrast, have become a less important source of demand for asset-backed bonds. Their share of bond holdings has halved over the past five years, from 30 per cent to 15 per cent. Given this, it is hard to conclude that the growth in the mortgage-backed market is being driven by demand for investments from the expanding funds management industry.
The other 30 per cent of mortgage-backed bonds on issue is held mainly by either the conduit vehicles associated with banks or authorised deposit-taking institutions themselves. A small proportion is held by private investors of various types, with this group having a particular demand for the lower-rated, higher-yielding securities.
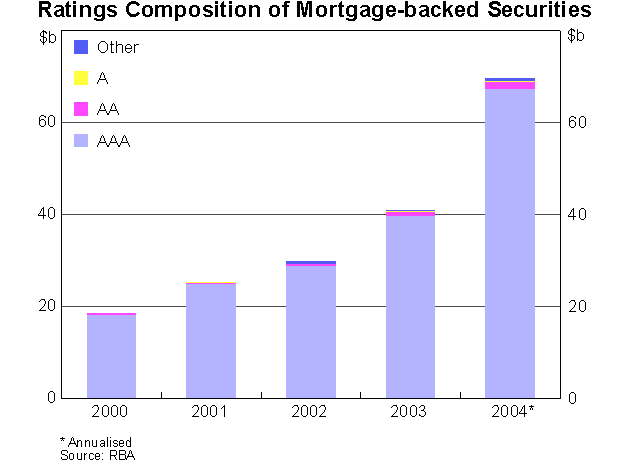
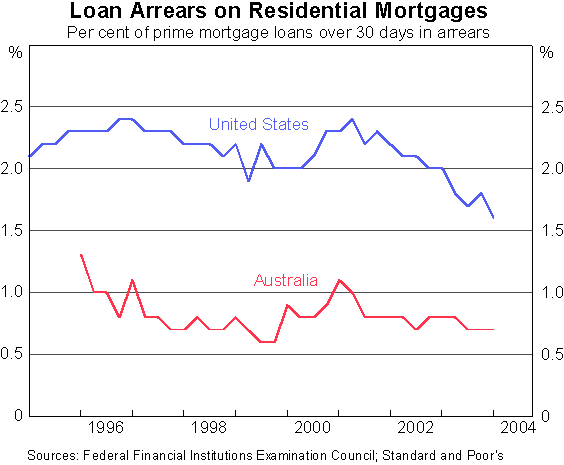
The credit quality of Australian residential mortgage-backed securities is very high, with the great bulk of the bonds rated AAA (Graph 10). No doubt, this is a factor in the strong offshore demand for these bonds. While the high credit rating is achieved in part through financial engineering, such as tranching and mortgage insurance, mostly it reflects the relatively sound nature of the mortgages that underpin them. Loan arrears of more than 30 days on prime mortgages in Australia have typically run at 0.75 per cent, which is only about half the figure in the US (Graph 11). Arrears of more than 90 days are much lower again.
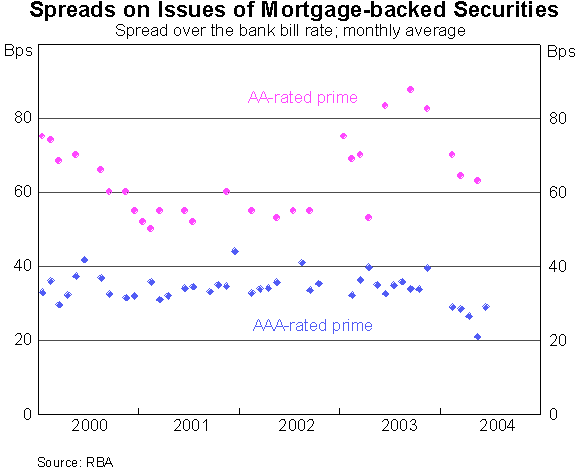
Spreads on mortgage-backed securities do not suggest that the appetite among investors for these securities is diminishing. Recent issues have, if anything, been made at lower spreads than those on bonds issued last year (Graph 12).
Implications
Let me end by drawing together some of the implications of these developments.
The surge in activity in the asset-backed securities market in recent years represents a further step in the evolution of Australian capital markets. It is another illustration of how the financial system has become much more efficient since the deregulation of the 1980s in providing finance to the economy. The result is that financing has grown fairly consistently faster than GDP over the past 20 years. In 1980, before deregulation began, total debt (both intermediated and non-intermediated) extended to the household and business sectors was equal to about 50 per cent of GDP. By 1990, this had risen to just under 100 per cent, and now the ratio is up to 150 per cent of GDP (Graph 13).
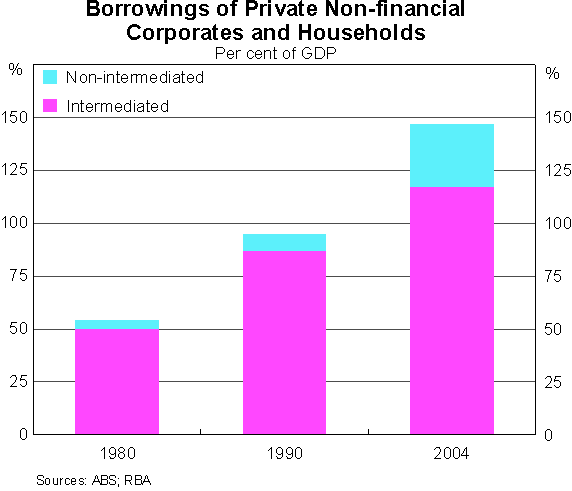
While early on the expansion of financing was heavily concentrated through the banking system, in more recent years there has been a shift towards the use of non-intermediated finance. Between 1980 and 1990, for example, non-intermediated finance accounted for less than 10 per cent of the total increase in total debt financing over the period, but since 1990 it has accounted for over 25 per cent of the increase in debt finance.
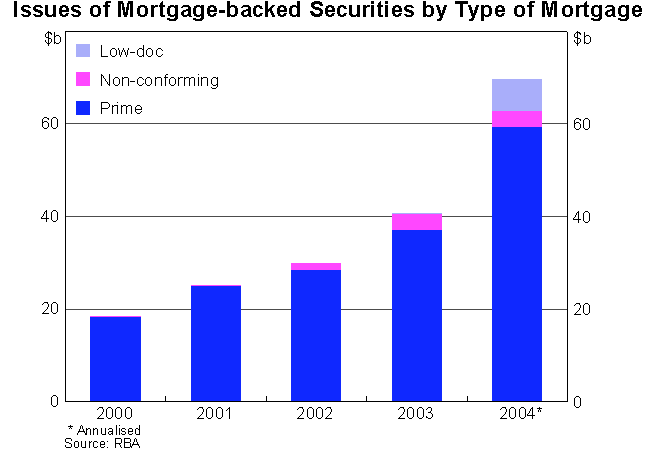
Associated with the expansion in the volume of financing has been a widening in the range of borrowers who can get access to finance. An illustration of this is the substantial issues this year of securities backed entirely by non-conforming loans or low-documentation loans (Graph 14). These types of bonds have accounted for around 15 per cent of all mortgage-backed securities issued so far in 2004.
For central bankers, these developments elicit mixed feelings. There is no doubt that an efficient and dynamic financial sector contributes importantly to the growth and development of the economy, but there can be the risk of too much finance being made available, leading to inflation and asset bubbles. It could be argued also that the sustained expansion of financing relative to GDP has made the economy more vulnerable to financial shocks, since it is now more highly geared than used to be the case.
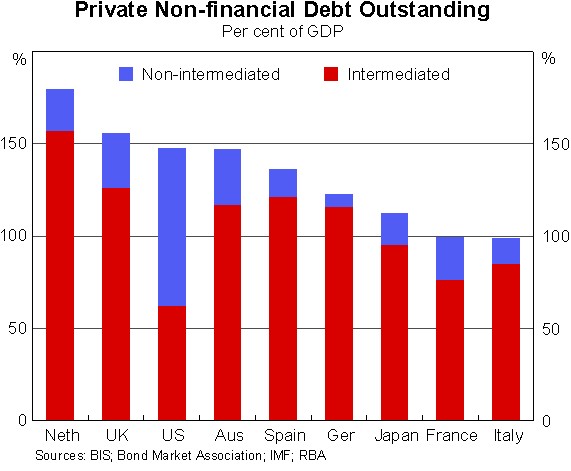
This expansion in financing relative to GDP is not something that is unique to Australia; it has been happening across all the developed economies. As can be seen in Graph 15, in most developed countries at present the ratio of debt financing (including both intermediated and non intermediated) is in the range of about 100 per cent to 175 per cent of GDP. When assessed in this international context, there does not appear to be anything unusual about the current position of Australia.