Speech Some Observations on Financial Trends

Ric Battellino
Deputy Governor
Address to Finsia-Melbourne Centre for Financial Studies
12th Banking and Finance Conference
Melbourne –
The topic I would like to talk about today is credit provided by intermediaries, or what is broadly its mirror image, the debt of the household and business sectors.
In many countries – including most of the English-speaking ones – credit has been rising strongly relative to GDP for many years now. This has been an ongoing topic of discussion among the world's central banks and financial commentators, as people try to understand whether this trend is sustainable, what it means for the performance of economies and what it means for financial stability.
I would like to touch on some of these issues today, particularly as they relate to Australia.
Some Facts
Let me start with a few facts.
This first graph shows two statistics for a range of developed economies:
- the orange bars are the annual average growth in credit over the past 30 years; and
- the purple bars are the annual average growth in nominal GDP over the same period.
In each of the 15 countries shown, credit has grown substantially faster than GDP over the past 30 years.
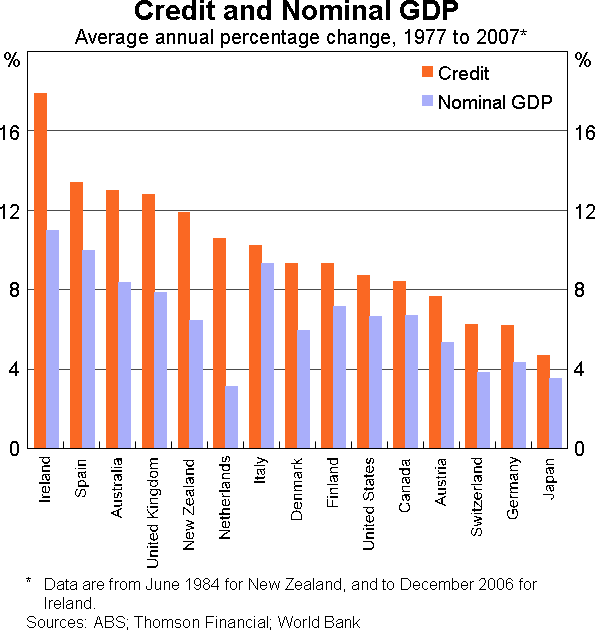
The gap between the growth of credit and that of GDP has been particularly large in countries such as Ireland, Spain, Australia, the United Kingdom, New Zealand and the Netherlands. Across these six countries, credit has grown on average about 5 percentage points a year faster than nominal GDP over the period covered by this graph.
It is a matter of arithmetic that if credit is growing faster than GDP, then the ratio of credit outstanding to GDP will rise. Across the 15 countries shown in Graph 1, the (unweighted) average ratio of credit to GDP has risen from about 60 per cent in 1977 to around 135 per cent today (Graph 2).
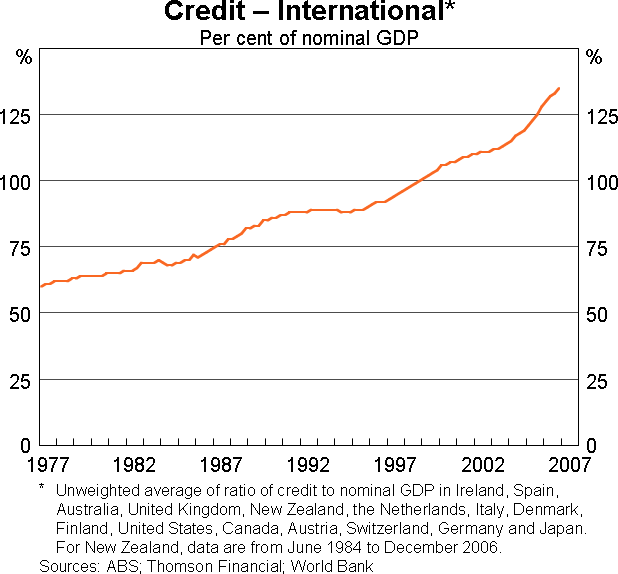
The extent of the upward trend in this ratio, and its persistence over such an extended period, is unusual from an historical perspective, if not unprecedented.
For Australia, we have data on credit going back 150 years and it is certainly the case that there is no domestic precedent for what has happened over the past 30 years (Graph 3).[1] The closest previous experiences were those in the 1880s and 1920s. In the former case, credit started to expand much more quickly than GDP in the early 1880s, but this trend lasted for less than 15 years, after which it reversed sharply. The surge in credit in the second half of the 1920s was less pronounced and shorter; it reversed after about five years.
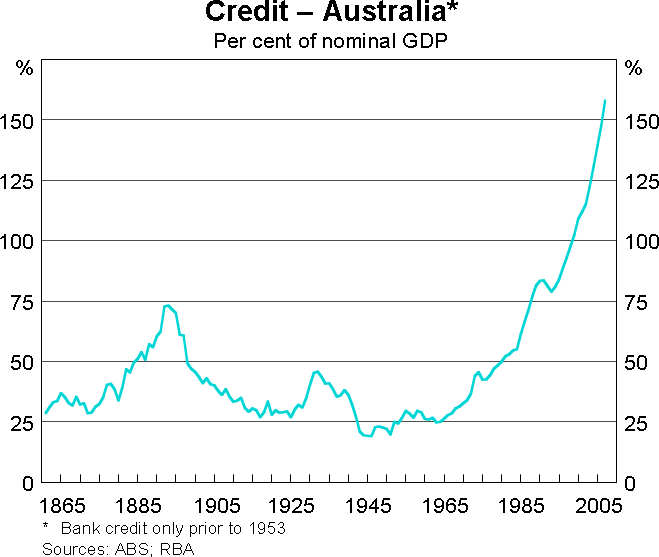
One of the clues as to why the recent episode of credit expansion has lasted longer is that it has been driven to an important extent by household borrowing rather than business borrowing.
We have estimates of household and business credit, of varying quality, going back to the 1920s. Before that, it is possible to get some guide to the split of borrowing between businesses and households by looking at which institutions were doing the lending. For example, credit extended by trading banks traditionally has mainly gone to businesses, while that extended by savings banks has mainly gone to households.
The next couple of graphs decompose the series for total credit shown in Graph 3 into its business and household components. In the case of business credit, Graph 4 shows that the ratio of business credit to GDP exhibits big cyclical and secular swings, but these have taken place around a flat trend over the 150 years shown on the graph. Periods when the financial sector has been relatively unregulated, such as the 1880s and the past couple of decades, have resulted in the ratio of business credit to GDP being elevated. The subdued credit growth in the 1950s and 1960s, a period when the financial sector was heavily regulated, also is noticeable.
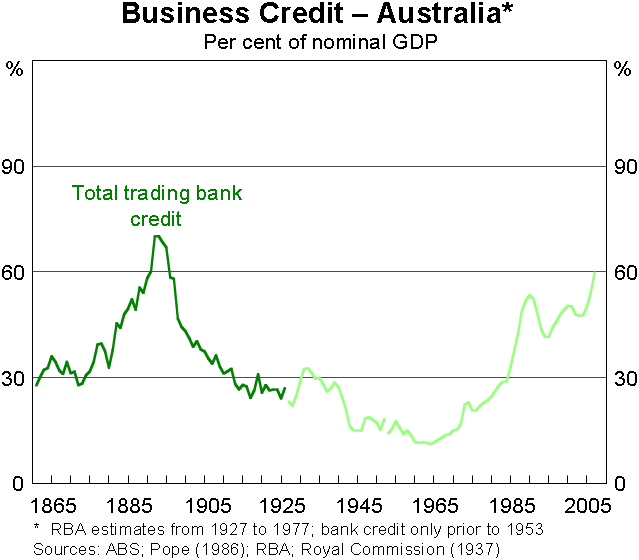
I don't think these outcomes are surprising. In the very long run, however, there are various economic relationships at work that tend to tie down the relationship between business credit and GDP. Specifically, business profits cannot consistently rise faster or slower than GDP, and in the long run the P/E ratio also cycles around a flat trend. The combination of these two facts means that growth in the value of business equity must also be tied to GDP growth in the long run. In turn, this works to tie down the relationship between business debt and GDP, as the gearing of companies (i.e. the ratio of debt to equity) cannot consistently rise or fall.
Let me now turn to household credit, as shown in Graph 5. Here the picture is very different. Up until the 1970s, households' access to credit was very limited. Those of us over 50 years of age can remember when, in order to qualify for a housing loan, people had first to establish a long and consistent record of savings with a bank, and even then there was a tight limit on how much the bank would lend. Many borrowers had to resort to ‘cocktail’ loans, at higher cost, to meet their needs.
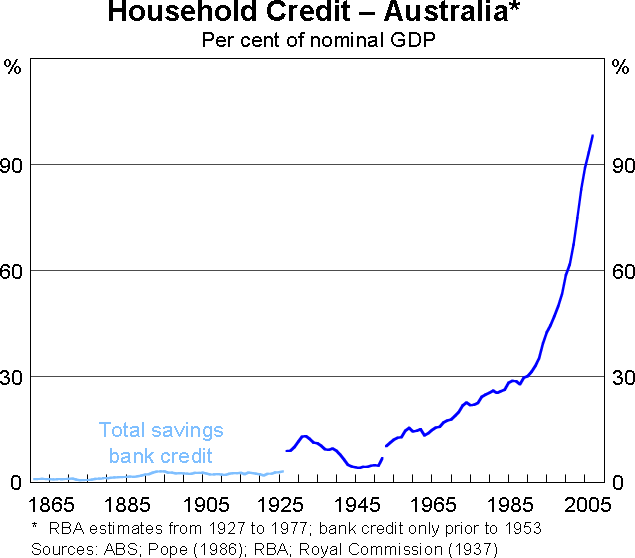
Over the past 30 years, however, deregulation and financial innovation have greatly increased the household sector's access to credit. This has been particularly so over the past 10–15 years as many banks focused their lending on the household sector after the credit losses on business loans in the early 1990s, and as financial innovations allowed non-bank lenders to enter the market for retail finance. The securitisation of loans, the development of numerous new loan products and the emergence of mortgage brokers were particularly important. Economic circumstances have also played an important role, just as they have for business credit. The decline in inflation and the resulting fall in interest rates have reduced the cost of debt, while the strong ongoing performance of the economy has made households more comfortable in taking on debt.
These and other factors contributing to the growth of household credit were examined in more detail in a couple of papers presented by some of my colleagues at the Reserve Bank's annual economic conference last month.[2]
In short, deregulation, innovation and lower inflation have simultaneously increased the supply, and reduced the cost, of finance to households, and not surprisingly households have responded by increasing their use of it. Household credit outstanding rose from 20 per cent of GDP in the 1970s to 30 per cent by 1990, and to around 100 per cent today. Household credit accounted for the bulk – 85 per cent – of the rise in overall credit to GDP over the past 15 years, and household credit now greatly exceeds business credit in terms of outstandings.
While some of the rise in household credit has gone to financing consumption, most of it has been used to acquire assets. If we take the past 10 years, for example, households have borrowed in total an additional $770 billion over the period. Of this, 90 per cent was used directly to buy assets, the main components being $420 billion for houses to live in, $240 billion for houses to rent and $40 billion for shares.
The primary effects of this borrowing were therefore on asset values, the most noticeable being the more than doubling in house prices. While there was also some spill-over into consumer spending, the expansion of household credit by and large has been a story about asset markets.
Similar developments have been experienced by many other developed economies over the past decade.
Looking Ahead
Has the expansion of household credit run its course? Will it reverse?
We cannot know the answer to these questions with any certainty, but my guess is that the democratisation of finance which has underpinned this rise in household debt probably has not yet run its course.
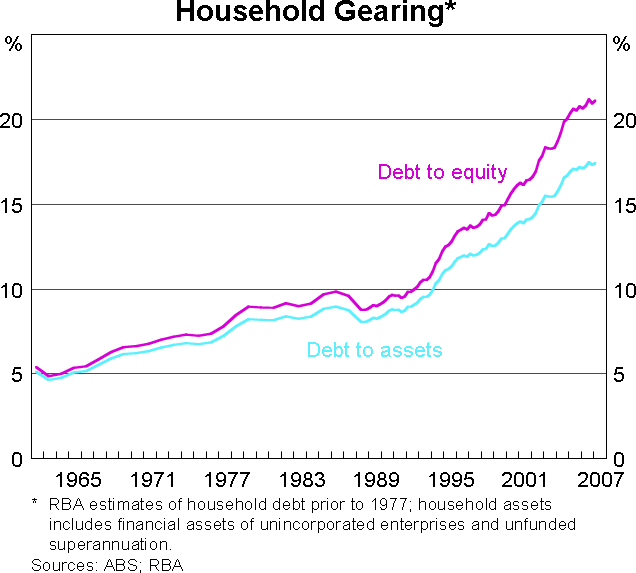
In the past, the lack of access to credit had resulted in Australian household sector finances being very conservative. Even as recently as the 1960s, the overall gearing of the household sector (taking account of all household debt and all household assets) was only about 5 per cent – that is, households owned 95 per cent of their assets, including houses, outright. This meant that the household sector had significant untapped capacity to service debt and large unencumbered holdings of assets to use as collateral for borrowings. Financial institutions recognised this and found ways to allow households to utilise this capacity.
The increase in debt in recent years has lifted the ratio of household debt to assets to 17½ per cent (Graph 6)[3]. I don't think anybody knows what the sustainable level of gearing is for the household sector in aggregate, but given that there are still large sections of the household sector with no debt, it is likely to be higher than current levels.
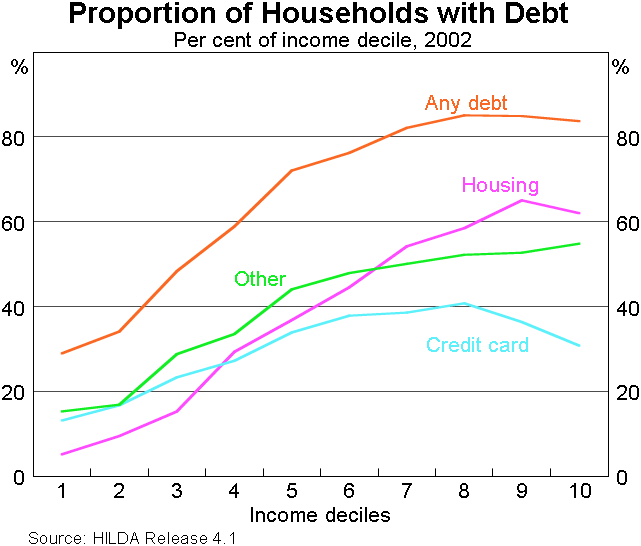
Cross-sectional data show that the rise in household debt has been driven primarily by middle-aged, and higher-income, households. Thus, while the build up of household debt is often portrayed as being driven by young couples trying to buy their first home, a more accurate description is that it is mainly being driven by older, higher-income households that are trading up to higher quality or better located houses, buying investment properties and taking out margin loans to buy shares. These are all signs of rising affluence, driven by a very prolonged economic expansion.
Over 80 per cent of households in the top half of the income distribution have some type of debt, compared with only 30 per cent of those in the lowest decile (Graph 7). Essentially, higher-income households are the ones that have the capacity and the financial security to take on debt. It seems that debt is one of those products, like education and health, which has a high income elasticity of demand – i.e. as income rises, demand for it rises more than proportionately. It would be a mistake, therefore, to conclude that a rising ratio of debt to income is necessarily a sign of financial stress among households.
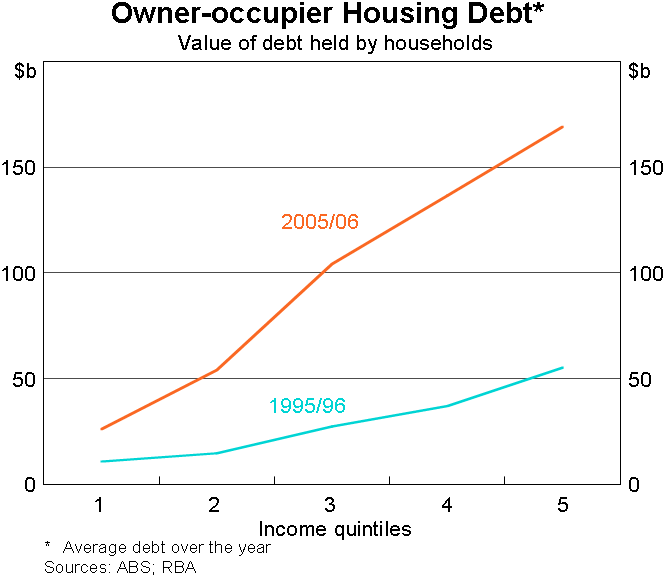
It is the high-income groups that have had the biggest increase in debt over recent years (Graph 8 ). About three quarters of the increase in owner- occupier debt over the decade to 2005/06, for example, was attributable to households in the top half of the income distribution. If comparable figures on debt associated with investment properties and margin loans were available, they would almost certainly further skew this distribution of debt.
Despite the rise in the debt of this group of households, their debt servicing burdens remain relatively low. For those households who are in the top half of the income distribution and who have an owner-occupied housing loan, housing loan repayments currently average a little less than 20 per cent of gross income. This has risen only marginally over the past decade, and it remains significantly lower than the figure of around 30 per cent for households in the bottom half of the income distribution. This suggests that the former group still has substantial capacity to service debt.
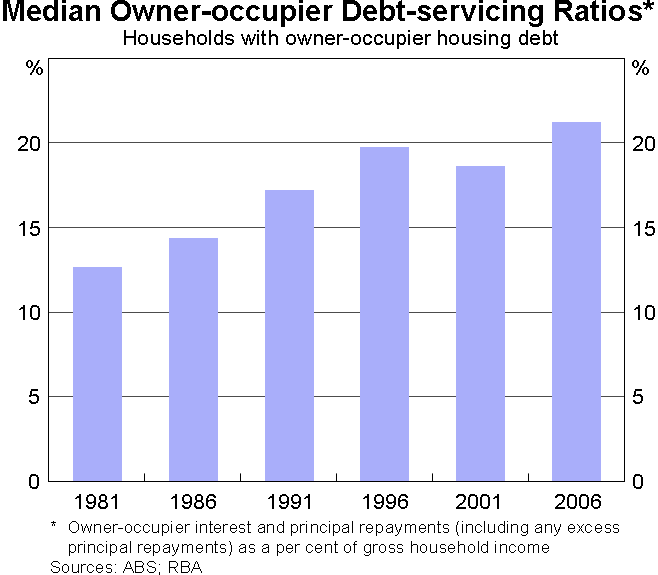
At the aggregate level across all households with owner-occupier housing debt, the median ratio of housing loan repayments to gross income, at about 21 per cent, is only marginally higher than a decade ago (Graph 9).
Another interesting feature emerges when the composition of debt is broken down by age group. This shows that a large contribution to the increase in household indebtedness has come from households aged 45–65. This group no doubt overlaps considerably with the high-income household group. Over the 10 years to 2006, the proportion of households aged 45–64 that are carrying owner-occupier debt increased very noticeably, from 25 per cent to 38 per cent (Graph 10). This has been encouraged by increased life expectancy, and the financial security that comes from a strong economy with low unemployment and the build up of substantial holdings of assets through superannuation.
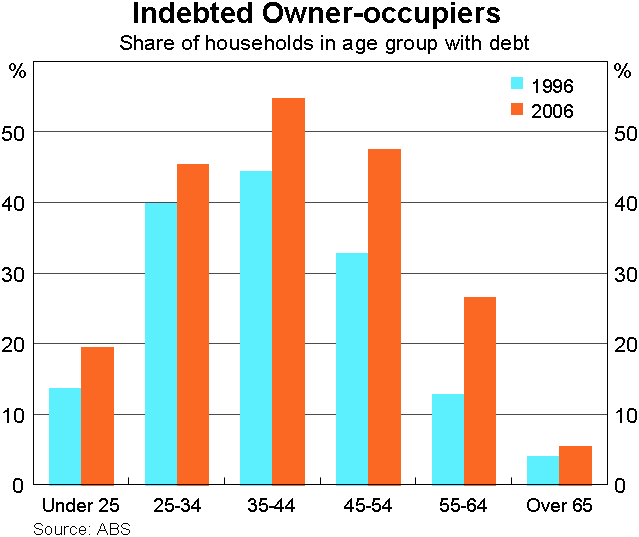
The trend for households increasingly to carry debt into older age may not yet have come to an end. At present, the great bulk of households still pay off all their debts by age 65, but the factors that encouraged or allowed 45 to 64-year olds to increase their debt over the past 10 years may in due course change behaviour further up the age scale. Recent financial innovations, such as so- called ‘reverse mortgages’, which allow older people to access equity in their houses in order to fund retirement, could be one vehicle that encourages higher debt among older households. The pool of housing equity owned by older households is very large and drawings against this by even a small proportion of this group could add substantially to household debt levels.
Some Implications
Let me end by drawing out some implications.
The first is that we may not yet have seen the end of the rise in household debt. The rise to date has been overwhelmingly driven by those households that had the greatest capacity to service it – the middle-aged, high-income group. It is not surprising, therefore, that this rise in debt has exhausted neither the collateral nor the debt servicing capacity of this group, or the household sector overall.
The factors that have facilitated the rise in debt over the past couple of decades – the stability in economic conditions and the continued flow of innovations coming from a competitive and dynamic financial system – remain in place. While ever this is the case, households are likely to continue to take advantage of unused capacity to increase debt. This is not to say that there won't be cycles when credit grows slowly for a time, or even falls, but these cycles are likely to take place around a rising trend. Eventually, household debt will reach a point where it is in some form of equilibrium relative to GDP or income, but the evidence suggests that this point is higher than current levels.
It is interesting to consider what factors might change the behaviour of households.
One such factor is demographics. It could be that the aging of the baby-boom generation will arrest the upward trend in household debt due to the effects of this group running down its assets and liabilities as it moves into old age. But whether this demographic effect is sufficient to offset the effects of other demographic shifts, such as the increase in longevity of the population in general, is not clear.
A second factor is monetary policy. Central banks could stop the rising trend in household debt by raising interest rates to levels that exhausted households' debt servicing capacity. But central banks around the world have generally concluded that the level of interest rates necessary to do this is higher than that needed to achieve monetary policy objectives in relation to inflation and economic growth, so this policy option has not been followed.
The final point I would like to talk about is the implications of rising household debt for financial stability.
There are two perspectives here.
The first is from the point of view of the lenders. Has the rise in household debt left lenders exposed to excessive risk? Any number of indicators – arrears rates on loans, exposure concentrations, capital ratios and profitability – suggest that the answer to this is ‘no’.
This was also the conclusion reached in the Financial Sector Assessment Program conducted under the auspices of the IMF last year. As explained in the September 2006 issue of the Bank's Financial Stability Review, even under the very extreme assumptions made in that stress test, banks remained profitable.
The second perspective is from the point of view of household finances. As outlined in the Financial Stability Review published yesterday, overall household sector finances remain in good shape: average real income is rising, even after interest payments; financial net worth has increased noticeably; gearing levels are not out of line with international standards; and the proportion of households experiencing financial difficulties, though higher than a couple of years ago, remains historically very low. There are some pockets of stress, but the low numbers involved – less than 20,000 of the 5,300,000 housing loans in Australia are 90 days overdue on repayments – mean that this is not a macroeconomic problem, even though it is no doubt causing distress among those households and communities directly affected.
At the macro level, there are two issues that arise from the developments in household finances over the past decade or two.
The first is that the rise in household debt has made the household sector more sensitive to changes in interest rates. This has meant that central banks have been able to achieve their monetary policy objectives with smaller interest rate adjustments.
Second, the household sector is running a highly mismatched balance sheet, with assets consisting mainly of property and equities, and liabilities comprised by debt. This balance sheet structure is very effective in generating wealth during good economic times, but households need to recognise that it leaves them exposed to economic or financial shocks that cause asset values to fall and/or interest rates to rise.
Endnotes
Before 1953, the series shown in the graph relates only to the credit provided by banks; after that it includes credit provided by all intermediaries. [1]
See Kent, C., C. Ossolinski and L. Willard (2007), ‘Household Indebtedness – Sustainability and Risk’, Reserve Bank of Australia Conference Paper, 20-21 August 2007; Ryan, C. and C. Thompson (2007), ‘Risk and the Transformation of the Australian Financial System’, Reserve Bank of Australia Conference Paper, 20–21 August 2007. Available at <https://www.rba.gov.au/publications/confs/2007/>. [2]
Measured on the same basis as corporate gearing (i.e. the ratio of debt to equity, rather than debt to assets) household gearing is marginally higher, at 21 per cent. [3]