Speech Some Observations on the Cost of Housing in Australia

Anthony Richards
[1]
Head of Economic Analysis Department
Address to 2008 Economic and Social Outlook Conference
The Melbourne Institute
Melbourne –
In recent years, there has been concern in many sections of the community about the cost of housing in Australia. This is not the first time that such concerns have surfaced: the 2003-04 Productivity Commission Inquiry on First Home Ownership was preceded by studies into housing issues in 1977–78 and 1990–92.[2] But the current episode of high housing costs has been quite prolonged, and there are few indications that any amelioration is in prospect in the near term.
In this talk, I will provide an update on some trends in housing prices and affordability, and discuss some of the factors that have influenced these outcomes.
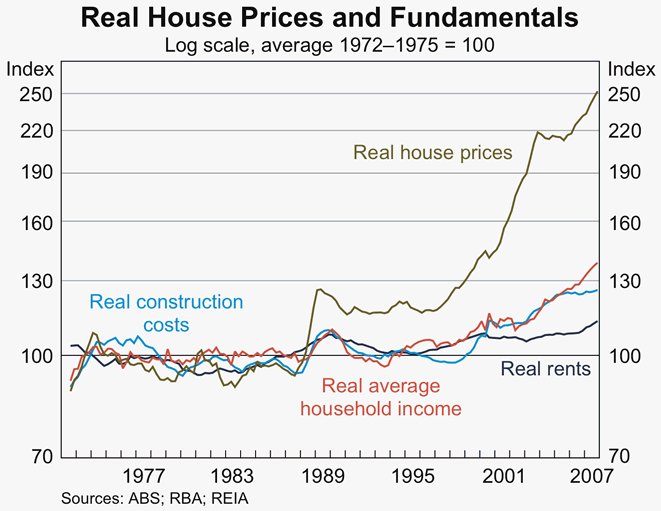
I will begin with a graph of housing prices and some housing-related ‘fundamental’ factors (Graph 1). One clear fact is that in the 35 years since 1972, nationwide house prices have risen significantly faster than average household incomes, house-building construction costs, and average rents. Most of the increase in real house prices occurred in two episodes, in the late 1980s boom and the subsequent boom in the late 1990s and into this decade. Growth in prices has been broad-based across the different states and territories. The run-up in prices is likely to mostly reflect an increase in the price of land.[3]
The increase in housing prices has been a mixed blessing for Australians. At one level, rising housing prices have made many people feel wealthier and have contributed to higher levels of consumer spending than might otherwise have occurred. But they have also resulted in concerns about housing affordability.
The difference in views reflects the fact that housing is not just an asset but also a consumption item. When housing is thought of purely as a consumption item, it would seem that in aggregate we would be better off if its price were lower. Because we all need to consume some level of housing services, either rented or purchased, a higher level of housing prices and rents allows less spending on other items.
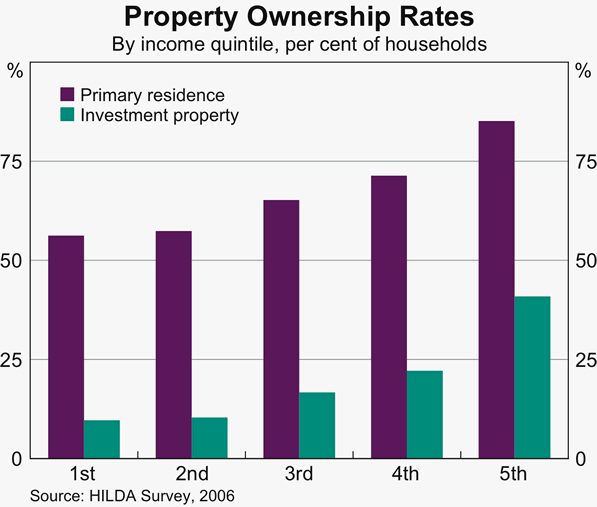
But housing is also a long-lived asset, and there are distributional aspects to changes in housing prices and rents. Renters will be worse off when housing prices rise whereas those who own rental property will be better off. Owner-occupiers may be largely unaffected, since they can be thought of as being ‘hedged’ against increases in the cost of housing. There are also generational differences. Younger people who have not yet bought homes will be hurt by higher housing prices. Older owner-occupiers may benefit from an increase in prices if they are intending to extract part of the increased value of their homes. Of course, if older people pass on some of their increased wealth to younger relatives, the gains and losses of these two age groups will be reduced. Indeed, the biggest difference may be between those who benefit from transfers from older relatives and those who do not. Both home ownership and ownership of rental property tend to rise with incomes (Graph 2), so it is lower income households that tend to suffer from rising housing prices and higher income households that tend to gain.
But although there are significant distributional effects across the age and income structure, one can make the case that the population in aggregate does not benefit from increases in housing prices.[4][5]
This discussion of housing as a consumption item leads us to the issue of housing affordability.[6]
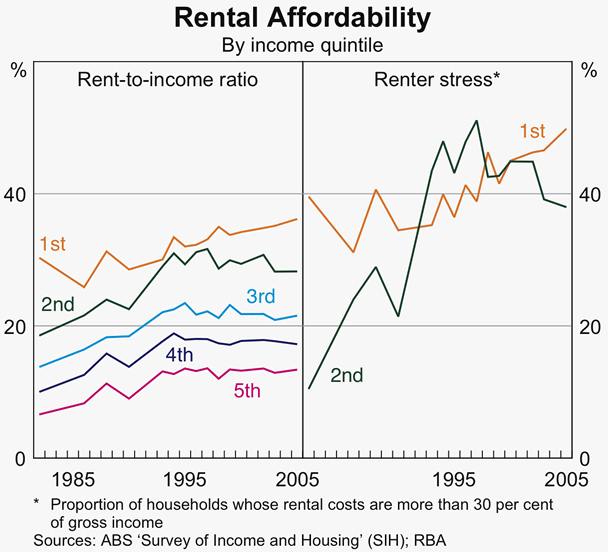
For renters, affordability is typically measured by the ratio of rent paid to household income (Graph 3). Survey data show that the proportion of income being allocated to rent payments has risen over the past two decades for renter households of all income levels.[7] In addition, the share of lower income households in ‘housing stress’ has tended to rise.[8]
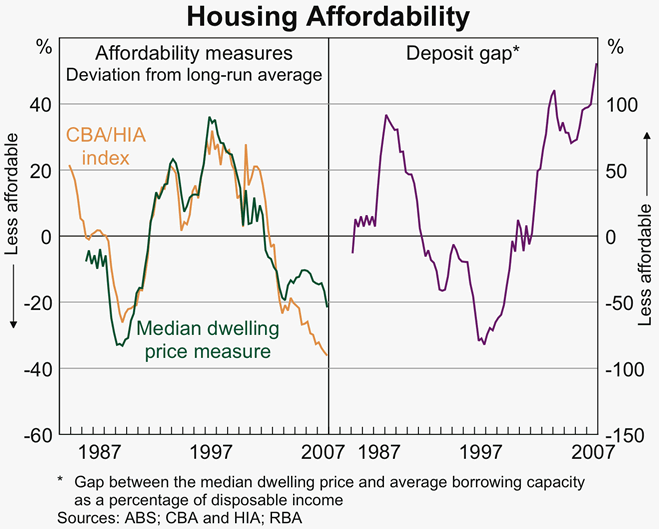
In the case of home buyers, concerns about affordability are typically about the accessibility of home ownership, or the ability of younger households to gain access to home ownership for the first time. The standard measures of accessibility show an improvement when average household income is growing faster than housing prices, or when mortgage interest rates are falling so that the borrowing power of households is increasing. Such measures suggest that there are cycles in affordability, but that it was at low levels by historical standards at the end of 2007 (Graph 4).[9]
But the existing measures of housing accessibility have a few shortcomings. Most importantly, they tend to focus on the average income level for all households rather than focusing on households in the age groups that are typically looking to purchase homes.
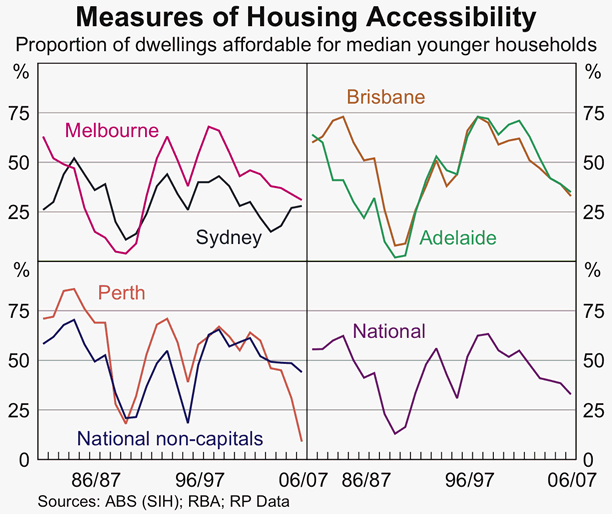
Accordingly, we have calculated an alternative measure which represents an estimate of the proportion of all dwellings (both houses and apartments) transacted in any year that would have been accessible to a typical household in the prime home-buying years, based on certain assumptions about bank lending behaviour.[10] We focus on households headed by persons aged between 25–39 years as potential home buyers. The estimates suggest that in four of the major capitals, around 30–35 per cent of transacted dwellings (houses and apartments) would have been accessible to the median household in the home-buying age groups in 2006/07 (Graph 5). Perth was the exception, where only around 10 per cent of dwellings would have been accessible. Taking account of accessibility outside the capital cities, we estimate that on a nationwide average basis around 33 per cent of transacted dwellings would have been accessible to the median young household in 2006/07, compared with a longer-run average of around 45 per cent. Of course accessibility would have been much lower for many lower-income households.[11]
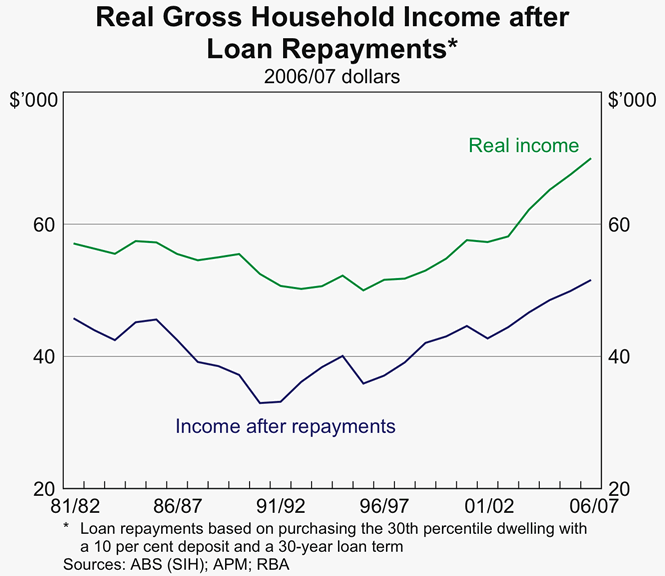
An alternative way of looking at affordability for younger households is to consider trends in the real income that this group would have had after servicing a mortgage of a given size (Graph 6).[12] The data indicate that real residual income of this group would have fallen between the early 1980s and early 1990s, but then would have increased through to 2006/07. For the 25-year period from 1982/83, expenditure on servicing a mortgage would have grown faster than income. But the real residual income available for other goods and services would nevertheless have grown, by around 0.5 per cent per annum. So the increase in housing prices has not in aggregate terms resulted in a fall in real spending on other goods.
I will turn now to the determinants of housing affordability and housing prices.
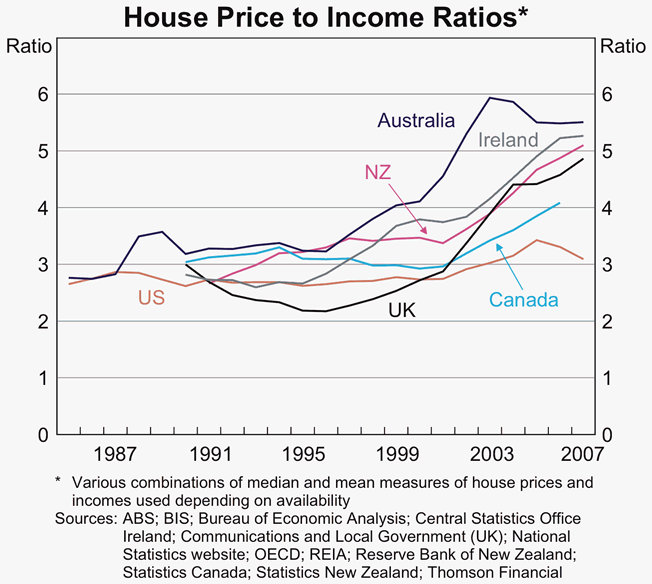
In any discussion of whether there is an affordability problem, we should remember that the run-up in housing prices in Australia has not occurred in isolation, with many other countries also experiencing housing booms. Admittedly there are problems of comparability when looking across countries, but the data suggest that Australia's median house price to income ratio is quite high by international standards (Graph 7).
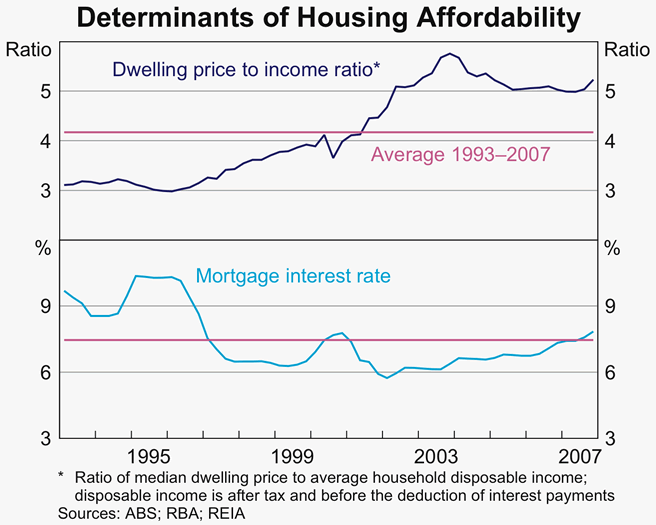
An additional perspective on this issue comes from the fact that the standard accessibility measures are driven by three variables: housing prices, household incomes and mortgage interest rates. So we can consider whether the relatively low levels of affordability in Australia over the past five or six years are more a function of housing prices being high relative to incomes, or to mortgage interest rates being relatively high. The data show that the recent period when affordability measures have been at low levels has been a period when the housing price to income ratio has been well above its average level for the low inflation period (Graph 8). Mortgage rates will of course fluctuate, but they could not be said to have contributed significantly to the persistently low levels of housing affordability over the past five or six years.
So looking either at the standard inputs into accessibility ratios or at an international comparison, it appears that the low level of housing accessibility in Australia can be thought of mostly as a reflection of the persistently high level of average housing prices. Given that houses and apartments can be either rented or owner-occupied, this high level of housing prices affects both home buyers and renters.
Of course, we must recognise that housing prices are not set exogenously, but reflect the interaction of demand and supply.
Certainly there are many well understood factors (the long economic expansion, the fall in inflation and interest rates, developments in the financial sector, etc) that have contributed to the household sector choosing to spend more money on housing.[13] Indeed, the experience of the past couple of decades suggests that, for a significant part of the population, housing may have been something of a ‘superior good’, that is the type of good to which consumers devote an increasing share of their income as incomes rise. To some extent, the recent experience might also suggest that in the earlier era of high interest rates and a regulated financial system, households were unable to spend as much on housing as they might otherwise have chosen.
In addition, a number of demographic and social trends have increased the demand for housing in the economy. And the effect of these ‘fundamental’ factors have probably been added to by increased demand for housing as an asset, due to aspects of the tax system and a broader shift in attitudes about housing.
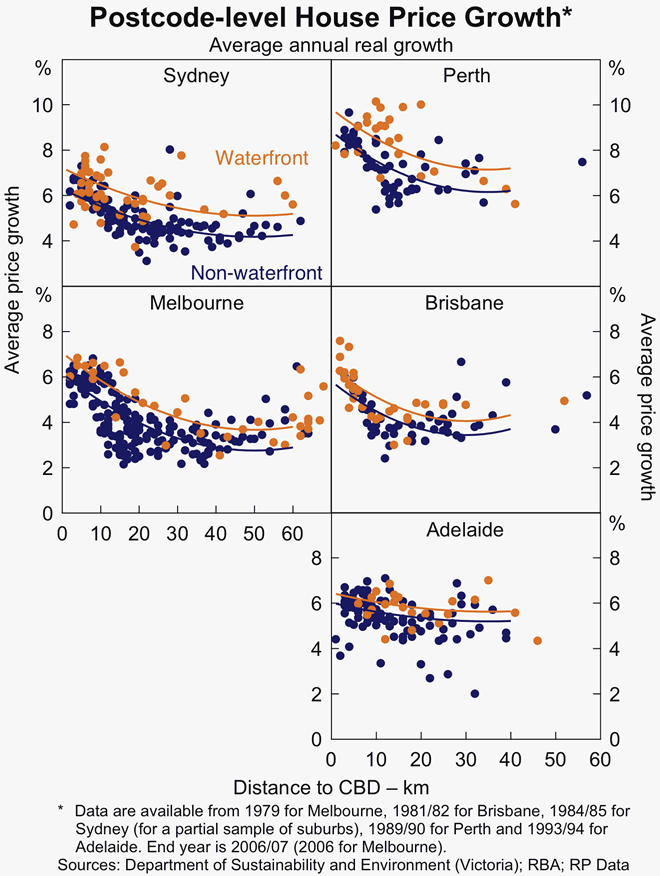
It should not be surprising that these demand-side factors have boosted housing prices, especially the price of more favourably located housing which is in limited supply.[14] Indeed, within our largest cities, house prices have increased more in closer-in suburbs than in more distant ones in recent decades (Graph 9).[15] In four of the five major capitals, average annual growth in house prices within five kilometres of city centres has been about 2 percentage points higher than for houses close to the edge of the cities: the exception is Adelaide where the difference is smaller. In addition, waterfront suburbs have had annual price growth around ½–1 percentage point higher than similarly proximate non-waterfront suburbs.[16] The greater run-up in closer-in and waterfront suburbs suggests that as the income and borrowing power of households has risen, there has been greater competition for housing that is viewed as more desirable.
So demand factors have played an important role in the run-up in housing prices. However, developments on the supply side should have worked to dampen the impact of demand pressures somewhat. As the value of land rises there is an incentive to increase the intensity of its use, for example by building townhouses on land that was previously used for single family houses or building high-rise apartments on land previously used for small blocks of units.
The demand factors discussed above would be expected to have contributed to some increase in real housing prices even far from the city centres. However, supply-side factors should have a much greater influence on prices towards the fringes of cities, where land is less scarce and accounts for a smaller proportion of the total dwelling price. In principle, the price of housing there should be close to its marginal cost, determined as the sum of the cost of new housing construction, land development costs, and the cost of raw land. And in the absence of any restrictions on supply, the price of raw land on the fringes should be tied reasonably closely to its value in alternative uses, such as agriculture. So unless there has been a marked increase in the value of this land when used for other purposes, the availability of additional land towards the edges of our cities should have limited increases in the cost of housing there.
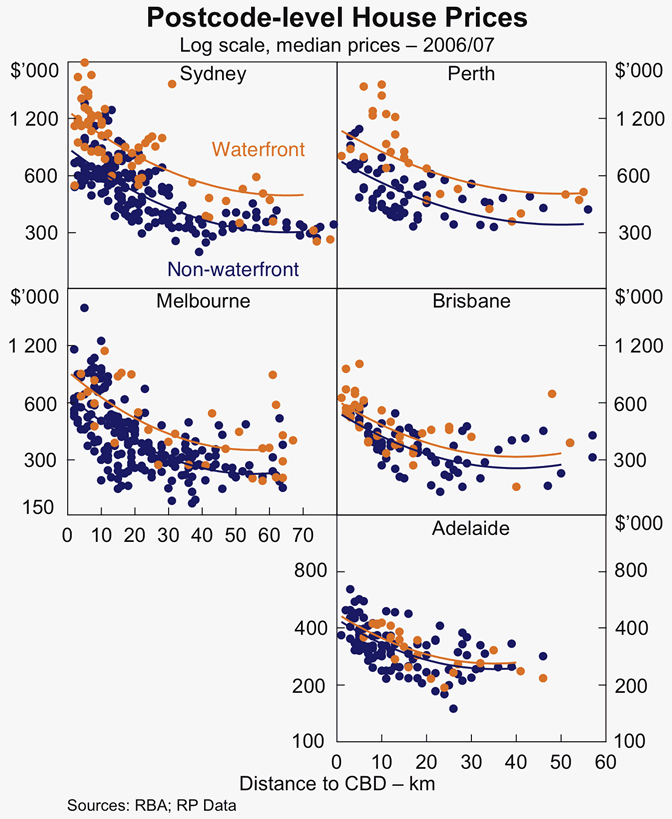
However, the evidence in Graph 9 provides only limited support for the proposition that real housing prices should not have risen significantly in suburbs far from the CBD. While price growth has been strongest in the most desirable suburbs, the fact is that real price increases in the outer suburbs have been quite large as well. Hence, in 2006/07 median prices of houses in suburbs in the outer parts of the capitals were typically in the $250,000–$300,000 range, except in Perth where prices were slightly higher (Graph 10).
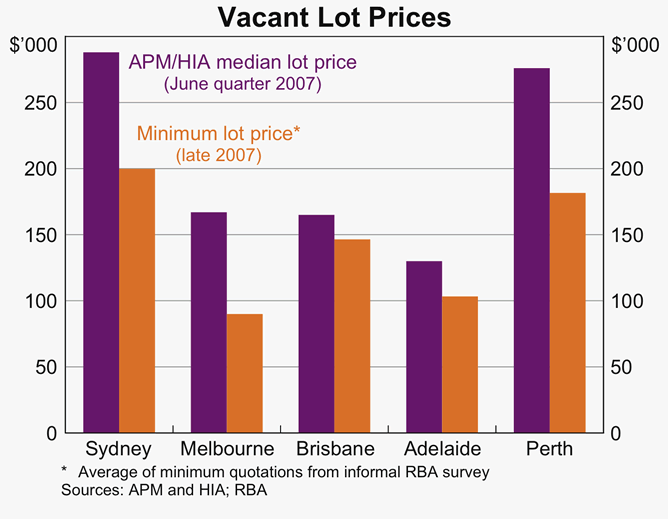
So if we are looking for explanations why housing is not as affordable as we might like, it may be necessary to look at factors on the supply side as well. One obvious place to start is the cost of land for building new houses near the edges of our cities. To shed some light on this, in late 2007 Reserve Bank staff looked at newspaper advertisements and websites for new housing developments in each of the five major capitals, focusing on the least expensive land available in major developments. These were typically lots around 400 square metres in size, ranging from around 25 kilometres (Adelaide) to around 40 kilometres (Sydney, Perth and Melbourne) from the CBD. Entry-level lots ranged from around or a little below $100,000 in Melbourne and Adelaide to around $200,000 in Sydney and Perth (Graph 11). The implied per hectare price of the developed land ranged from a little over $2 million in Melbourne to around $5 million in Sydney and Perth. These were representative prices for low-cost land, with the average cost of building sites noticeably higher.
In considering the reasonableness of these prices, it must be remembered that our major cities are all coastal, and in some cases there are mountain ranges or other geographic or environmental factors which are a consideration – but not generally an absolute barrier – for development. However, this exercise raises the question of whether the cost of land on the fringes of our cities could be a disincentive to building new housing there, and in the medium term could also be increasing the price structure of the existing housing stock.[17]
There are no doubt a number of factors that could be contributing to the observed level of land prices, and the relative importance of these is probably best left to experts. One factor that has been widely mentioned is the existence of various constraints on land development, including growth corridors and boundaries. Another factor that has been mentioned is the existence of a range of government charges, including developer levies or infrastructure charges. More broadly, concerns have also been expressed that zoning policies and building approval processes have hampered in-fill development closer to the city centres.
Both economic theory and international evidence suggest that housing prices can be boosted by land usage policies (which can create artificial scarcity of residential-zoned land), problems with the complexity of the development process (which creates rents), and the fees and charges imposed on development.[18] Accordingly, the fact that higher prices for housing have not resulted in a more significant supply response could be a reflection of various supply-side costs that have represented a wedge in the cost of bringing new housing to market.[19]
This suggests that the run-up in real housing prices may not be fully explained by demand-side factors and that supply-side ones – especially policies on land usage – may also have played a role. Of course, this is not to argue that all policy intervention in the land market is inappropriate, but rather that the benefits from zoning regulations, growth boundaries, infrastructure charges, etc should be weighed against any costs in terms of higher housing prices. To quote Bertaud and Malpezzi (2001, p 393), ‘Land use regulation per se is neither good nor bad. What matters is the cost and benefit of specific regulations under particular market conditions’.
Let me conclude with a few final observations.
It is no doubt the case that housing will never be as ‘affordable’ as we might like, and indeed the cost of housing has been the subject of periodic concern for at least several decades. And, to a large extent, the outcomes that have been seen over recent decades appear to reflect market outcomes, especially the impact of a series of factors which have boosted demand for housing. As the 2004 Productivity Commission report noted (p 7), ‘…the apparent decline in affordability over the long term may partly result from the collective decisions of households to spend a greater share of their incomes on housing’.
However, various commentators and industry groups have argued that there are also some factors on the supply side that have boosted the price of new housing and limited the expansion of housing supply that could have moderated the worsening in affordability. Overall, it seems likely that developments in housing prices close to CBDs mostly reflect demand-side factors, but that supply-side factors might have materially affected housing prices near the fringes of our major cities.
As the Productivity Commission report noted (pp xxii–xxiii) ‘there is limited scope for governments to improve affordability for first (and other) home buyers in the short term … However, governments do have an important role to play in facilitating efficient housing outcomes. In particular, policy initiatives to address any structural factors that encourage excessive demand for housing, or that unnecessarily reduce the responsiveness of supply to increases in demand, will reduce ‘average’ house prices over future cycles and could provide enduring affordability benefits to both home buyers and renters’. The discussion in this paper suggests that those observations in the Productivity Commission report remain valid. On the demand side, it is now widely accepted that policies that simply give people more money to spend on housing are likely to be capitalised into higher housing prices. On the supply side, efforts to improve housing affordability should be focused on policies regarding land use and on improving efficiency in the supply of land and housing.
Endnotes
I thank a number of colleagues, especially Gianni La Cava, Laura Berger-Thomson and Michelle Wright, for their contributions to the material in this talk. [1]
See Committee of Inquiry into Housing Costs (1978) and National Housing Strategy (1992). [2]
Part of this run-up in prices has reflected improvements in the quality of the housing stock: Abelson and Chung (2005) suggest that quality improvements from alterations and additions could have boosted house prices by around 1 per cent per annum over 1970-2003. But, while the size and quality of houses and apartments may have increased, the average amount of land per dwelling is likely to have fallen: a number of sources suggest that average lot sizes of new freestanding houses tend to be smaller than in the past and the increasing shares of townhouses and high-rise apartments in the overall housing stock also imply a smaller average amount of land per house or per apartment. So, in aggregate terms, improvements in the size of dwellings and the quality of their inclusions are likely to have been offset to some extent by ‘quality’ reductions in terms of the average amount of land per dwelling. So the sharp run-up in housing prices over the past two decades is likely to be more a reflection of an increase in the price of land rather than of changes in the quality of the dwellings, when quality is defined broadly to include both the structure and land content. This is consistent with the observation that price growth appears to have been somewhat faster for houses (which have a relatively higher land content) than apartments, and in capital cities (where land is relatively more scarce) as opposed to outside the capitals. [3]
Bajari, Benkard and Krainer (2005) illustrate this in a formal economic model, finding that ‘there is no aggregate change in welfare due to price increases in the existing housing stock. This follows from a simple market clearing condition where capital gains experienced by sellers are exactly offset by welfare losses to buyers … [W]hile price changes do not result in aggregate changes [in welfare] … this is far from true at a disaggregated level … Housing inflation involves a redistribution of income between those buying and those selling their homes’(pp 474, 483). [4]
This is not to say that housing does not represent wealth for home owners: it clearly does, as home-owners have prepaid their future housing needs. And even if it is unclear whether rising house prices per se can be viewed as adding to real net wealth, it is clear that many of the factors – strong economic growth, lower unemployment, a more dynamic financial system, etc – that have contributed to rising house prices are extremely positive and have contributed to higher real income levels. [5]
Before looking at the data on affordability, it may be worth addressing the argument that the aggregate home ownership rate has not changed significantly over the past couple of decades, which is evidence that ‘affordability’ is not a problem. In fact, home ownership rates of most age groups have fallen significantly in recent years. For example, home ownership among 25–39 year olds – typically the age when people first enter into home ownership – has fallen from around 65 per cent in 1986 to 58 per cent in 2006. Abstracting from shifts in age structure of the population, the average home ownership rate has fallen by around 4 percentage points since 1986. Of course this may reflect broader social trends and changes in preferences. However, the fact that home ownership rates have fallen within age groups despite major improvements in the availability of finance suggests that the run-up in the cost of housing since the mid 1980s might have had some impact on home ownership. [6]
These survey findings may appear at odds with the data in Graph 1 that suggest average rents have not risen as much as average incomes or house prices over recent decades. It is unclear what explains this divergence: it may reflect sampling error in the survey data, or the relatively poor long-run data for average rents in Graph 1, which are based on spliced REIA and ABS data. [7]
One widely used definition of housing stress is when housing costs (either rent payments or mortgage servicing) exceed 30 per cent of household income for those households in the bottom 40 per cent of the income distribution. Note that the 30 per cent threshold would be considered too low for higher-income households. [8]
The median dwelling price affordability measure is the ratio of average household disposable income to principal and interest repayments on a new 25-year mortgage for the REIA median-priced dwelling assuming an 80 per cent loan to valuation ratio (LVR) and the average interest rate paid on new loans. The CBA/HIA index is the ratio of average household disposable income to the disposable income required to purchase the estimated median-price CBA-financed first-home-buyer dwelling assuming an 80 per cent LVR, a new 25-year mortgage, the CBA mortgage rate and a 30 per cent repayment to gross income ratio. The deposit gap is the difference (as a proportion of average gross income) between the REIA median dwelling price and the amount that someone earning average household gross income could borrow based on a 25-year mortgage, the average interest rate paid by new borrowers and a 30 per cent repayment to gross income ratio. [9]
More precisely, based on ABS survey data, we calculate median gross household income for 25–39 year olds in the state capital and ‘rest-of-state’ for NSW, Victoria, Queensland, South Australia and Western Australia. We then calculate borrowing capacities based on these income levels and representative mortgage interest rates. Subject to a 30 per cent repayment/gross income ratio, we then calculate purchasing capacity assuming that the household had also saved a deposit of 10 per cent of the purchase price. [10]
In addition, unlike Graph 4, the data in Graphs 5 and 6 do not reflect the increases in mortgage rates that have occurred in the second half of 2007 (and none of the graphs reflects changes in the early part of 2008). [11]
In particular, the graph shows the real residual income that a potential first-home buying household would be left with after purchasing a home at the 30th percentile of the price distribution, after putting down a 10 per cent deposit. [12]
Further discussion of the factors behind the run-up in housing prices is provided in the report by the Productivity Commission (2004) and the submission by the Bank (RBA 2003). See Battellino (2007) for further discussion of the rise in household indebtedness in recent years. [13]
Standard theoretical models of urban structure assume that much of the economic activity in a city is in the CBD. Since travel is costly in terms of time and money, people will pay a premium to be close to the CBD. Anything that increases the monetary or opportunity costs of travel should increase the premium for closer-in suburbs. Given the increase in real incomes over time, the opportunity cost of commuting will have increased, so the relative price of closer-in suburbs should have risen. In addition, if growth of our cities has resulted in an increase in congestion and commuting times (for example, if transport has not improved in tandem with population growth) the premium for closer-in suburbs should have increased. [14]
Growth in median prices is calculated for all postcodes for which there are at least 15 transactions in the beginning and end-years. The lines represent fitted values from a regression of the average annual growth in prices (or the log of prices in Graph 10) on distance and distance-squared and a variable denoting if the postcode is waterfront (either harbour, ocean or riverfront). Some modest restrictions were placed on the shape of the polynomial, and a few outliers were omitted from the regressions. Of course, many other factors could be expected to explain the level or growth in house prices, but the regressions shown have a surprisingly high explanatory power (the median adjusted R-squared is 0.60 for the growth equation and 0.49 for the levels equation). [15]
Proximity to waterfront appears to be valued most highly in Sydney and Perth, where it boosts median prices by 50–60 per cent. The effect in Brisbane and Melbourne is smaller, and the effect in Adelaide is quite modest. [16]
A similar exercise for some US cities would also suggest that Australian land prices are quite high. For example, contacts in Dallas and Atlanta suggest that prices for new developments on the fringes of those cities can start around US$50,000 or less, for lot sizes that are typically several times the size of Australian blocks. Admittedly neither of these cities is coastal, but nor are they small: both are larger than Sydney and Melbourne, with Greater Atlanta having a population of 5.3 million and Dallas-Fort Worth with around 6 million people. [17]
See Brueckner (2007) for a theoretical overview of the impact of land usage policies on housing prices. See Grimes (2007) for an overview of some empirical research in New Zealand, and Green, Malpezzi and Mayo (2005), Quigley and Raphael (2005), and Glaeser, Gyourko and Saks (2005a, 2005b, 2006) for US evidence. [18]
One argument that is sometimes heard is that developer behaviour may be contributing to the current high cost of land. For example, in New South Wales it has been argued that the expectation of continuing scarcity of new land and of strong housing price growth led developers to pay high prices for land in the early part of this decade. Given the price falls for existing housing in the outer suburbs, they are now faced with reduced profits (or even losses) on land holdings, so the argument goes that they are now ‘hoarding’ land until prices increase. However, in other more competitive industries, firms have to accept the current market price for their output and any losses from changes in input prices are bygones – holding out will simply increase their losses because other firms will come in and supply the market at the market-clearing price. So if it is the case that prices are being held up by firms sitting on zoned land and waiting for prices to recover, this points to deeper problems in the land supply process – that the process is not sufficiently competitive for other firms to come in and sell other land at the new (lower) market-clearing price. [19]
References
Abelson P and D Chung (2005), ‘The Real Story of Housing Prices in Australia from 1970 to 2003’, Australian Economic Review, 38(3), pp 265–281.
Bajari P, CL Benkard and JR Krainer (2005), ‘House Prices and Consumer Welfare’, Journal of Urban Economics, 58(3), pp 474–487.
Battellino R (2007), ‘Some Observations on Financial Trends’, Address to Finsia-Melbourne Centre for Financial Studies 12th Banking and Finance Conference, Melbourne, 25 September.
Bertaud A and Malpezzi S (2001), ‘Measuring the Costs and Benefits of Urban Land Use Regulation: A Simple Model with an Application to Malaysia’, Journal of Housing Economics, 10(3), pp 393–418.
Brueckner JK (2007), ‘Government Land-Use Interventions: An Economic Analysis’, paper presented at the World Bank 4th Urban Research Symposium, Washington DC, 14–16 May.
Committee of Inquiry into Housing Costs (1978), The Cost of Housing, Volume 1: Report, Australian Government Publishing Service, Canberra.
Glaeser EL, J Gyourko and RE Saks (2005a), ‘Why Have Housing Prices Gone Up?’, American Economic Review, 95(2), pp 329–333.
Glaeser EL, J Gyourko and RE Saks (2005b), ‘Why Is Manhattan So Expensive? Regulation and the Rise in House Prices’, Journal of Law and Economics, 48(2), pp 331–370.
Glaeser EL, J Gyourko and RE Saks (2006), ‘Urban Growth and Housing Supply’, Journal of Economic Geography, 6(1), pp 71–89.
Green RK, S Malpezzi and SK Mayo (2005), ‘Metropolitan-Specific Estimates of the Price Elasticity of Supply of Housing, and their Sources’, American Economic Review, 95(2), pp 334–339.
Grimes A (2007), ‘Impacts of Land Availability, Housing Supply and Planning Infrastructure on New Zealand House Prices’, paper presented to Treasury & Reserve Bank of New Zealand conference ‘The Business Cycle, Housing and the Role of Policy’, Wellington, 10–11 December.
National Housing Strategy (1992), National Housing Strategy: Agenda for Action, Australian Government Publishing Service, Canberra.
Productivity Commission (2004), First Home Ownership, Report No 28, Productivity Commission, Melbourne.
Quigley JM and S Raphael (2005), ‘Regulation and the High Cost of Housing in California’, American Economic Review, 95(2), pp 323–328.
Reserve Bank of Australia (2003), ‘Submission to the Productivity Commission Inquiry on First Home Ownership’, RBA Occasional Paper No 16.