Speech Some Comments on Bank Funding

Ric Battellino
[1]
Deputy Governor
Remarks to the 22nd Australasian Finance &
Banking Conference
Sydney –
One of the widely drawn lessons from the financial crisis is that banks should source more of their funding from deposits and less from short-term debt markets.
I want to spend some time today talking about this, focusing in particular on:
- how significant are the benefits of such a shift?
- how feasible is it for banks to shift their funding sources?
- what is the impact on banks' cost of funds? and
- what are the implications for the level of interest rates?
Bank Funding
Banks in Australia have reasonably diverse funding bases: deposits account for 43 per cent of funding, split fairly evenly between households and businesses; domestic capital markets provide a further 19 per cent of funding; and foreign capital markets 28 per cent. Securitisation and equity account for 3 per cent and 7 per cent of funding respectively (Graph 1).
Since mid 2007, the share of banks' funding that has come from deposits has risen by 5 percentage points, with increases in both household and business deposits. Banks have used these funds to replace some of their short-term capital market debt.
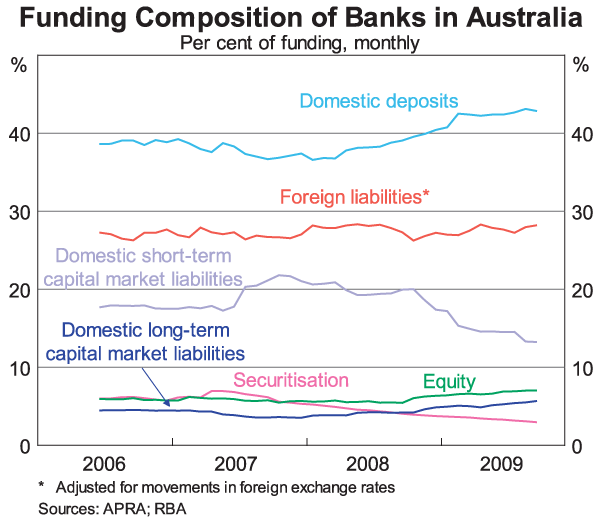
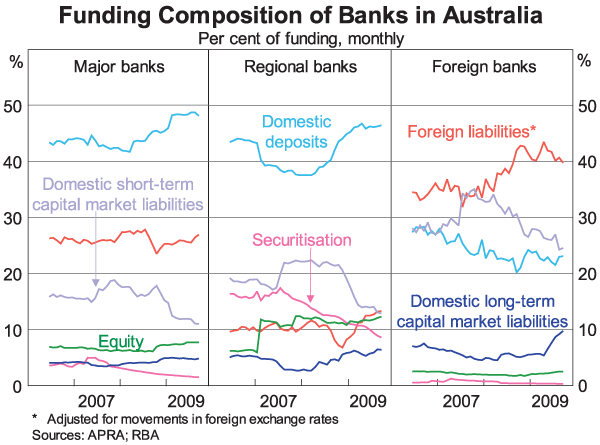
The increased use of deposit funding has been evident in both the major banks and in the regional banks. The foreign-owned banks, in contrast, have experienced a fall in the proportion of funding coming from domestic deposits (Graph 2).
How Stable are Bank Deposits?
Assessing the relative stability of banks' various funding sources is not straightforward, as there can be significant variation even within each category of funding. For example, government-guaranteed deposits are ‘stickier’ than non-guaranteed deposits, household deposits tend to be stickier than corporate and institutional deposits, while internet deposits are less stable than other at-call deposits. Deposits from corporates and other financial institutions are unlikely to be much more stable than short-term debt, particularly in a crisis. Offshore capital market funding can be less stable than domestic capital market funding, as during crises investors often have a strong home bias.
The behavioural maturity of a given funding source can also be very different from the contractual maturity, especially during financial crises. It is the behavioural maturity that matters most, and during a severe crisis this can shorten significantly for many funding sources. This is because banks can come under pressure to allow term deposits to be redeemed early and to buy back short-term capital market debt. While a bank could try to enforce the contractual maturity on its funding, the reality is that, unless the bank is already in great difficulty, this could draw attention to itself and accentuate its problems.
Another issue is that the behaviour of new depositors attracted through more competitive pricing may also be very different from that of existing depositors. These new deposits are likely to be more price sensitive and less stable. The benefit, in terms of funding stability, which comes from increasing deposits through competitive pricing, may therefore be somewhat illusory.
How Do Australian Banks Compare Internationally?
There is a common perception that banks in Australia make less use of deposits to fund themselves than do banks in other countries. However, the difference between Australian banks and their overseas peers is sometimes exaggerated by inconsistencies in the data across countries.
Table 1 contains some data the Reserve Bank has put together on deposit funding for the major banks in Australia, Canada, Germany, Japan, the United Kingdom and the United States. We have tried to make the data as consistent as possible although they are probably still a long way from being fully consistent. The data show that, contrary to popular perception, the share of funding from deposits for the major banks in Australia is similar to that for the major banks in Germany, Japan, the United Kingdom and the United States.[2]
| Major banks | |
|---|---|
| Australia | 61 |
| Canada | 77 |
| Germany | 56 |
| Japan | 69 |
| United Kingdom | 60 |
| United States | 56 |
|
* Data based on the major banks in each country. Deposits include CDs. Total
funding equals total liabilities, excluding derivative liabilities.
Sources: RBA; banks' financial statements. |
|
Another commonly quoted metric used to support the case that Australian banks are underweight deposits is the relatively high ratio of loans to deposits in Australia. The ratio for the major banks in Australia is around 130 per cent, whereas in most overseas countries the ratio varies between 80 per cent and 100 per cent (Table 2). However, as I have noted, this is not due to Australian banks having lower deposit funding. The high ratio of loans to deposits reflects differences in asset composition. Banks in Australia mainly have loans on the asset side of their balance sheet, whereas banks overseas often have large holdings of debt securities. This results in a higher ratio of loans to deposits in Australia. But, rather than being a weakness, I would regard this as a strength of the Australian banks, as events of the past couple of years have shown that holdings of securities can be more risky than loans.
| Major banks | |
|---|---|
| Australia | 131 |
| Canada | 91 |
| Germany | 97 |
| Japan | 79 |
| United Kingdom | 89 |
| United States | 96 |
|
* Data based on the major banks in each country. Foreign and domestic loans
and deposits (including CDs).
Sources: RBA; banks' financial statements. |
|
How Far Can Banks Lift their Deposit Ratios?
An individual bank has a large amount of discretion in the way it funds itself, as it can bid more aggressively for the type of funds it wants and compete them away from other banks. The banking sector as a whole, however, has much less flexibility. For the banking sector as a whole to increase its use of deposit funding, it needs to be able to induce a shift in the structure of the financial system away from financing through capital markets to on-balance sheet funding through the banking sector. Put another way, for the banking system as a whole, the share of deposits in total funding can increase only to the extent that investors reduce their holdings of securities and place the proceeds on deposit with banks.
There are limits to the extent this can happen since there are a range of structural, economic and cultural factors that shape the composition of a financial system, and these do not change quickly. In fact, the trend in most economies is for savings over time to move away from simple instruments such as bank deposits towards debt securities and equities.
To try to shift savings back to deposits would require a reversal of these trends, and there must be doubts about how feasible that would be. There is also the question of whether it would be sensible from the point of view of the overall functioning of the economy and the financial system.
As I noted earlier, over the past year Australian banks as a whole have managed to increase the share of their funding that comes from deposits. However, the bulk of this occurred during the period of high risk aversion late last year and early this year, when investor perceptions were that bank deposits were safer than debt securities and unit trusts. Over the past six months, as risk appetite among investors has returned, the deposit funding share of banks has stopped rising. It would seem that banks have largely exhausted the available opportunities to induce investors to increase their holdings of bank deposits. The so-called ‘deposit war’ among banks is producing very attractive interest rates for depositors but little net benefit for the banking system as a whole in terms of increasing deposit funding.
What Is Happening to the Cost of Deposits?
The increased competition by banks for deposits has added substantially to their cost of funds. It used to be the case that on average banks paid about 125 basis points less than the cash rate on deposits. Now they are paying interest rates that are on average in line with the cash rate (Graph 3). In the case of term deposit ‘specials’, which are the main vehicle through which banks are currently competing for deposits, interest rates can be as much as several hundred points above the cash rate.
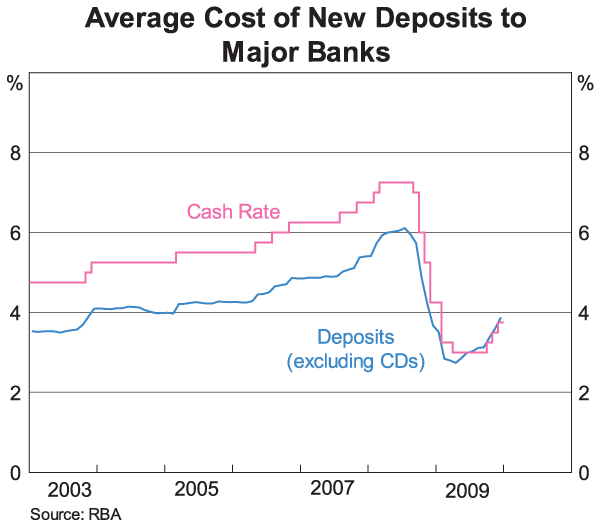
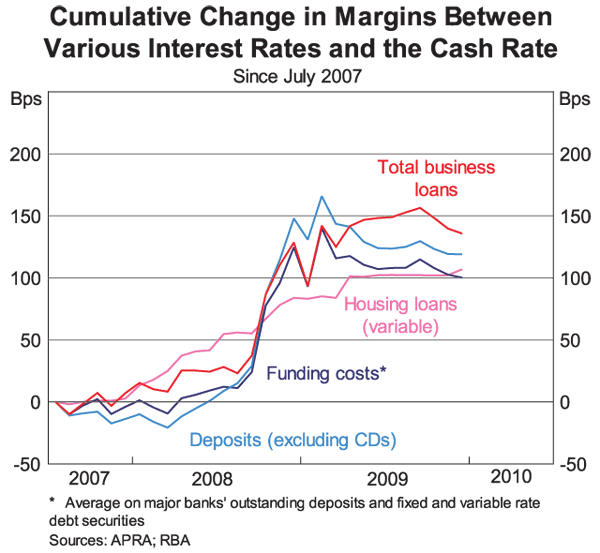
Table 3 shows how the cost of various types of funding for the major banks has changed, relative to the cash rate, since the start of the financial crisis in mid 2007. It shows that the cost of new deposits has risen on average by 147 basis points relative to the cash rate over that period. This rise was mainly driven by an increase of about 250 basis points in the relative cost of term deposits. The cost of short-term debt relative to the cash rate has not changed much over the period, while the cost of new long-term debt has risen by 173 basis points relative to the cash rate.
| Basis Points | |
|---|---|
| Deposits | 147 |
| – transactions | 250 |
| – savings | 36 |
| – term | 250 |
| Short-term debt (incl CDs) | 13 |
| Long-term debt | 173 |
| Total | 108 |
|
Source: RBA |
|
The table indicates that the push by banks to increase the share of their funding that comes from deposits has added substantially to their costs. At the same time, the cost of long-term debt has risen sharply relative to the cash rate because of the global crisis.
These changes in banks' cost of funds relative to the cash rate have meant that the relationship between bank lending rates and the cash rate has also become looser. It is difficult for banks to adjust their lending rates in line with changes in the cash rate when the cost of their funds is rising substantially relative to the cash rate.
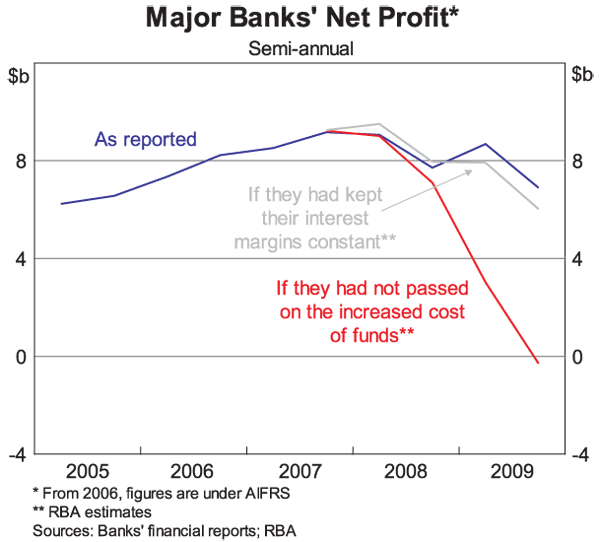
We estimate that if banks had not adjusted their lending interest rates to reflect their higher cost of funds over the past couple of years, they would now be incurring losses (Graph 4). That would have threatened their ability to keep raising funds and, in turn, their capacity to lend. In the event, early in the financial crisis, banks did not pass on all of the increase in their cost of funds, but recently increases in lending rates have run ahead of the cost of funds. Banks' margins are now a little wider than at the start of the crisis, and therefore are adding to profits.
The margin between the cash rate and banks' lending rates receives considerable public attention. This is understandable because changes in it are very visible. This margin, however, can change for many reasons, so it is difficult to interpret. A widening in it might be due to banks making unjustified increases in their lending rates, or it might reflect market developments that have pushed up banks' cost of funds relative to the cash rate.
Some have argued that variability in this margin means that monetary policy is less effective. This, however, misses the very important point that the Reserve Bank takes account of the changing relativities between the cash rate and other interest rates when setting the cash rate. Other things equal, if interest rates in the economy are rising relative to the cash rate, there is less need for the cash rate to rise.
The more relevant margin is that between the average interest rate on bank loans and the average cost of the funds used by banks to finance their loans. This is usually referred to as banks' net interest margin.
Between 2000 and 2007, the net interest margin on the major banks' Australian operations had narrowed by about 100 basis points (Graph 5). This was driven by competition, and was made possible by sizeable reductions in banks' operating costs over that period, which allowed banks to continue operating profitably despite falling margins.
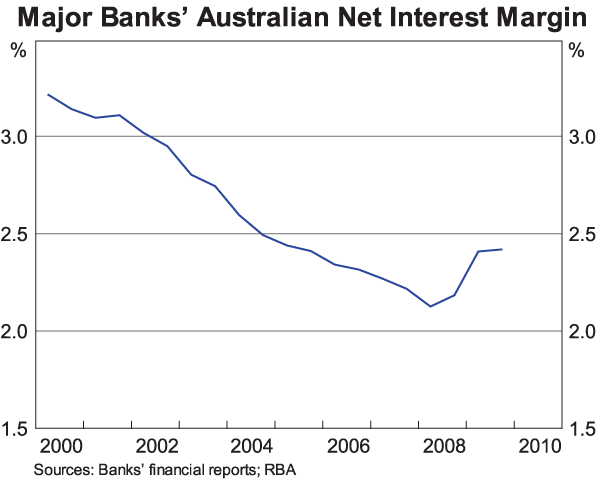
As I mentioned, early in the financial crisis, the banks' net interest margin was squeezed further, as the cost of funds rose sharply and banks did not fully pass this on to interest rates on loans. Over the past year or so, however, margins have widened again, and they are now about 20 basis points above pre-crisis levels.
This recent widening in the net interest margin has been largely due to wider margins on banks' business lending. The margin on variable housing loans is much the same today as it was at the start of the crisis; it had fallen until recently and the increase in home loan interest rates in December restored it to around its pre-crisis level.
Margins on business loans, however, are now substantially higher than they were immediately before the crisis. This comes after a prolonged period when margins on business loans had narrowed.
Margins on business loans tend to vary over the economic cycle, reflecting changes in perceptions of risk by banks. During periods of a strong economy, banks tend to cut their margins as they see business loans as being less risky. In contrast, when the economic and business outlook is uncertain and loan losses are rising, as has been the case over the past couple of years, banks see loans as being more risky and margins widen.
With the economy and business climate now improving, the economic justification for wider margins on loans is becoming less compelling, so it would be reasonable to assume that, in a competitive banking sector, we should see margins level out soon. Over the past couple of months, there have been some signs that this is starting to occur.
What Does This Mean for Monetary Policy?
As I have noted, over the past couple of years, the interest rates that matter in the economy – the rates on housing and business loans and the rates on deposits and debt securities – have all risen relative to the cash rate (Graph 6). The Reserve Bank has taken these changing relativities into account in its monetary policy decisions.
One of the implications of doing so, however, is that it has altered the relativity of the cash rate compared with its historical ranges. I want to end with a few words on this, and what it means for the interpretation of monetary policy settings.
As you know, the cash rate is currently 3.75 per cent. This is still 50 basis points below the previous cyclical low of 4.25 per cent in 2001. On the surface this might suggest that the cash rate is still unusually low. However, with other interest rates in the economy having risen by at least 100 basis points relative to the cash rate over the past couple of years, they are now above their previous cyclical lows.
Another way to think about this is that the current level of deposit rates, housing loan rates and business loan rates would have been consistent, before the crisis, with a cash rate of at least 4.75 per cent.
Taking these considerations into account, it would be reasonable to conclude that the overall stance of monetary policy is now back in the normal range, though in the expansionary segment of that range.
The appropriateness of this will be monitored by the Reserve Bank over the months ahead in the light of the data becoming available on economic activity and inflation.
Endnotes
I would like to thank Michael Davies, Anna Brown and Tegan Hanrick, who undertook the research for this talk. [1]
The figures for deposit shares in the table are higher than the figures quoted earlier in this talk because of definitional differences. To allow international comparisons, the figures for deposits in the table include CDs and are for the banking group, and hence include overseas as well as domestic operations. The denominator used to measure total funding is on-balance sheet liabilities (excluding derivatives) rather than total funding including equity and securitisation. [2]