Speech The Current Economic Landscape

Philip Lowe
Assistant Governor (Economic)
Committee for Economic Development of Australia (CEDA)
Economic and Political Overview
Sydney –
I would like to thank CEDA for the invitation to be part of this panel today. It is a pleasure to be here. As you may know, the Reserve Bank recently released its latest Statement on Monetary Policy. This morning, I would like to pick up on three of the main themes discussed in that document. These are: the two-speed global recovery; the resilience of the Australian economy; and the moderation of inflation in Australia.
The World Economy
A year ago when this conference was held, the world economy looked to be standing on the edge of a precipice. Output was contracting, international trade was collapsing, consumer and business confidence were falling, and risk aversion was extreme. At the time, many serious observers were talking about the possibility of a rerun of the problems of the 1930s.
As we now know, the world economy moved back from the precipice. Global output grew by around 3 per cent over the final nine months of last year, international trade has recovered some of its earlier falls, confidence has improved somewhat, and risk aversion has abated. As a result, many observers are now predicting that global growth will be around 4 per cent this year and next – a much better outcome than that feared likely a year ago.
One reason that we have moved back from the edge is the policy responses of governments and central banks. These responses provided the public with the assurance that policy makers would not stand idly by. Collectively, they were sufficient to interrupt the corrosive cycle of falling confidence undermining spending, then feeding through to even lower confidence and even lower spending.
The pick-up in the global economy has, however, been quite uneven. In the advanced economies, the recovery to date has been weak, especially in light of the very large contractions in output that occurred. In contrast, in Asia the bounce back has been much stronger, with many of the economies in the region growing solidly and operating with much less spare capacity. Looking forward, this two-speed world is likely to continue for some time yet.
In the advanced economies, growth has generally returned, although this has much to do with the dynamics of the inventory cycle and the boost to spending from temporary fiscal measures. While it is not unusual that these factors play a major role in the early part of a recovery, a stronger pick-up in private demand than has occurred to date will be needed for a self-sustaining recovery to take hold. In many countries, both consumption and investment are still very weak, with individuals and businesses remaining very cautious (Graph 1).
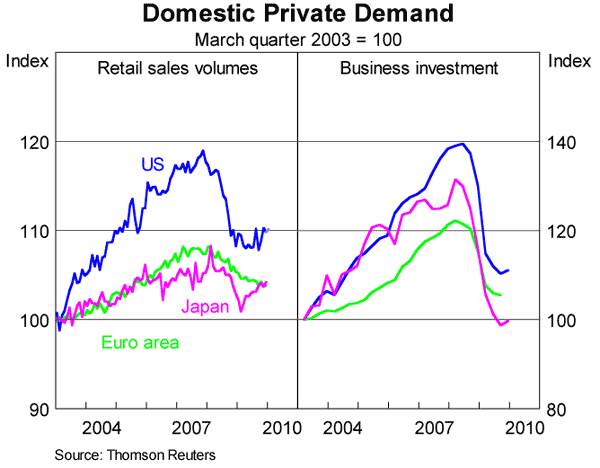
Looking forward, the central scenario for most of these economies remains a subdued recovery. It is likely that many of them will continue to be weighed down by the desire of households to reduce leverage and increase savings. And with considerable excess capacity, a strong recovery in business investment also appears unlikely, at least in the near term. Many of the advanced economies have weak financial sectors with little appetite for risk. Many also face very significant medium-term fiscal challenges that need to be addressed. If history is any guide, overcoming these various balance-sheet headwinds will take considerable time.
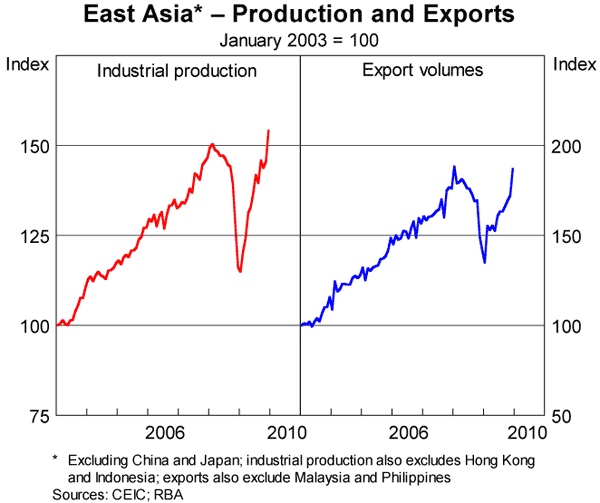
The picture in Asia is very different. A number of economies have had near V-shaped recoveries; this is particularly evident in the data for industrial production and trade (Graph 2). Unemployment is coming down and, unlike in the advanced economies, core inflation has troughed and is starting to increase. Throughout the region, the stimulatory settings of both monetary and fiscal policy that were put in place have proved to be an effective antidote to the problems emanating from the major North Atlantic countries. The region has also avoided the financial headwinds created by a troubled financial sector and high levels of public debt.
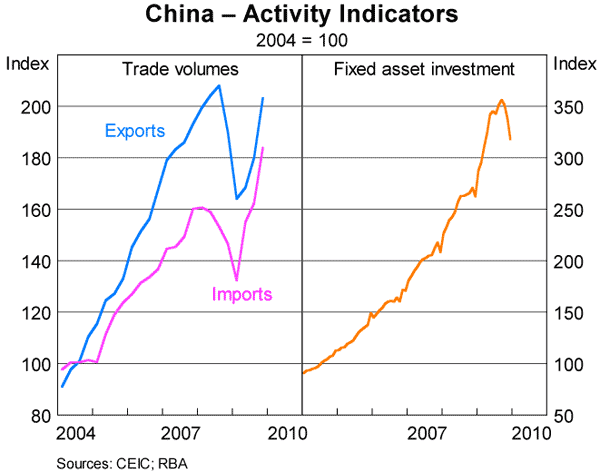
The recovery has been strongest in China, with the economy growing by 8¾ per cent last year. This strong growth has also provided a boost to many other economies in Asia and beyond, with Chinese imports having increased rapidly (Graph 3). In the middle part of the year, the growth in China was driven by a surge in public-sector infrastructure, but more recently there has been some rebalancing, with exports and consumption rising strongly.
The challenges facing China are obviously different from those facing the advanced economies. Foremost amongst these is deciding how, and when, to scale back some of the policy stimulus that was put in place. As many observers have noted, if stimulatory policy settings remain in place for too long, there is a risk of overheating, leading to difficulties down the track. But calibrating the withdrawal of the stimulus is difficult and there are clearly risks in both directions. On balance, it is plausible to argue that the recent tightening in credit conditions is a favourable development in that it increases the likelihood that the Chinese economy is on a sustainable path. Time will tell though.
This two-speed world presents a very interesting backdrop for the Australian economy. There remains some risk that developments in the advanced economies could again derail growth in the global economy. But the more likely scenario remains a relatively subdued recovery in the advanced economies and stronger growth in Asia, with domestic demand in the region making a greater contribution to growth than has been the case historically.
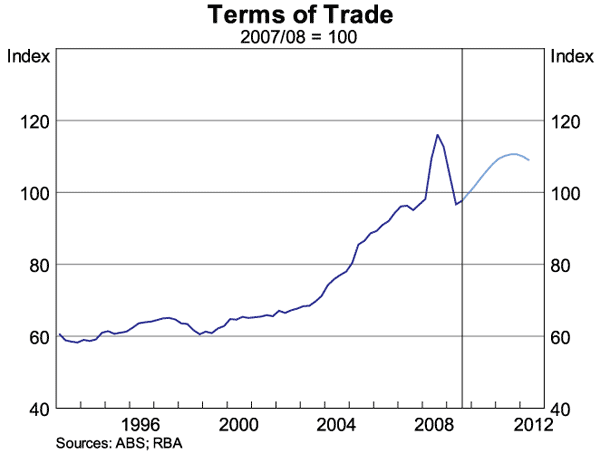
If this is how things play out, the Australian economy is well placed. Around 70 per cent of our exports now go to Asia and the strong growth in the region has supported commodity prices. This is reflected in our terms of trade, which are likely to increase strongly over the next year from what is an already high level (Graph 4).
Domestic Developments
This brings me to my second theme – the general resilience of the Australian economy.
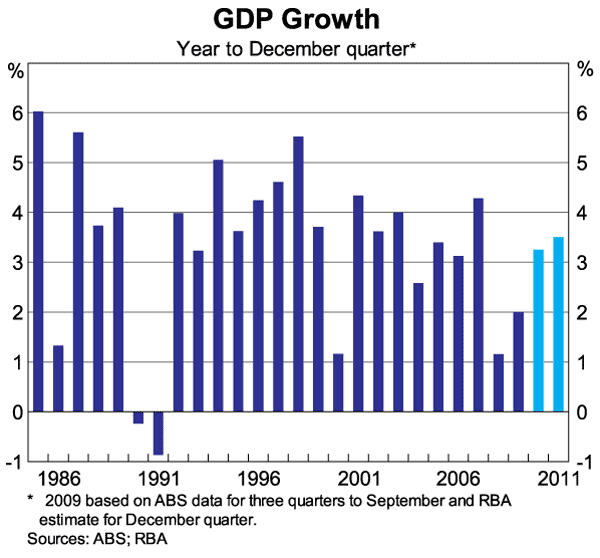
Amongst the advanced economies, Australia is the only one to have avoided a negative year-ended growth rate during the global downturn. While activity did contract in the final quarter of 2008, it is likely to have grown by around 2 per cent in 2009.
This is a considerably better outcome than thought likely a year ago and it has led the Bank to revise up its forecasts for growth for 2010 and 2011. Most of this upward revision occurred between mid last year and November, with only very modest revisions since then. Our central forecast is for the economy to grow by around 3¼ to 3½ per cent over each of the next couple of years (Graph 5). This is slightly above the average of the past two decades and, if it occurred, would likely see a gradual reduction in the spare capacity that currently exists.
This outlook is based on a judgment that growth in private demand will gradually strengthen, with public demand providing support to economic activity in the short term. The housing sector is now firmly in the upswing phase of the construction cycle, and increased investment in the resources sector over coming years is expected to see investment, as a share of GDP, return to the very high levels seen in late 2008. In terms of consumption, we are expecting reasonably solid growth, although below the pace of earlier years as households continue to take a more cautious approach to their finances.
There is one technical issue regarding these forecasts that I would like to draw your attention to – that is the assumption about interest rates used by the Bank's staff when putting these forecasts together. For some years, it had been our practice to produce forecasts assuming that the cash rate remained unchanged throughout the forecast horizon. This approach had the obvious advantage of simplicity, but when the cash rate is a long way from its normal level, it is not particularly realistic.
So, in August last year we changed our approach. Since then, we have prepared our forecasts on the technical assumption that the cash rate returns towards a more normal setting over time. Our overall objective here is to provide the community with a general sense of how we think the economy is likely to evolve over the next few years and to do this we need to make realistic assumptions. Broadly speaking, the paths the staff have used have been similar to those implied by market interest rates at the time the forecasts were prepared. It is important to stress that this neither implies a commitment by the Board to the particular path used nor an endorsement by the Bank of the market pricing.
One aspect of our recent economic performance that particularly stands out is the solid performance of the labour market, with the unemployment rate having peaked at 5¾ per cent (Graph 6).
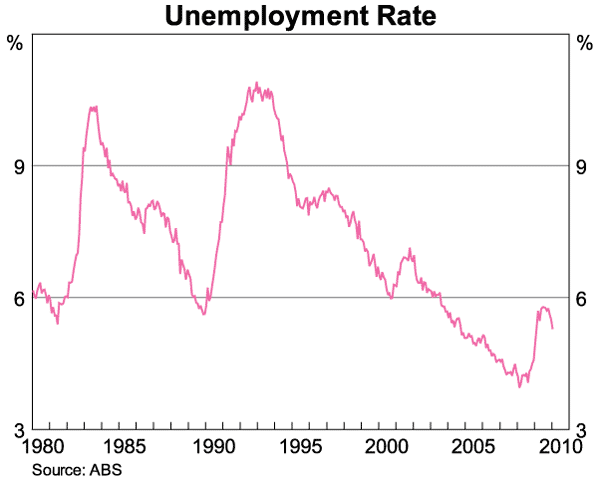
This is clearly a much better result than earlier thought likely and it has been important in underpinning a high level of confidence in the community. In turn, this has helped short circuit what could have been a damaging dynamic – that is, rising unemployment feeding through to weak confidence and lower incomes, in turn feeding through into lower spending and a further increase in unemployment. There are a number of factors that have helped here, but the one that I would like to highlight today is the greater flexibility of the labour market.
In previous economic slowdowns, when the demand for labour declined, people lost their jobs almost one for one with the decline in labour demand. On this occasion, things turned out quite differently, with the increase in the unemployment rate being smaller than suggested by historical relationships between output and employment. Partly this was because many firms and their employees agreed to reduce working hours rather than to reduce the number of people employed. In other cases, there was an agreement that wage increases would be reduced or delayed as a way of preserving jobs. The good news is that this flexibility in employment relationships worked in limiting job losses in the economy. This has had obvious social benefits as well as supporting overall confidence in the community. Without this flexibility, it is likely that the outcomes would not have been as favourable.
In looking forward, there are number of issues that deserve particularly close analysis as we gauge the current pulse of the economy. I would like to touch briefly on three of these.
The first is the weakness in business credit. Over the past year, business credit has fallen by 7 per cent (Graph 7). The last time we saw this type of outcome was in the early 1990s, when the economy was in a deep recession and investment was collapsing.
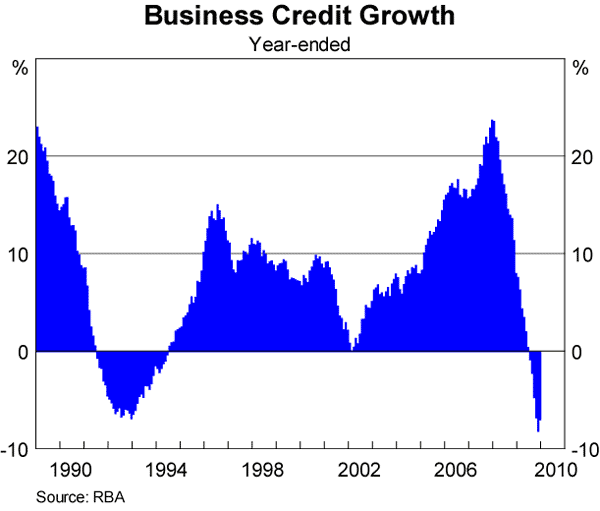
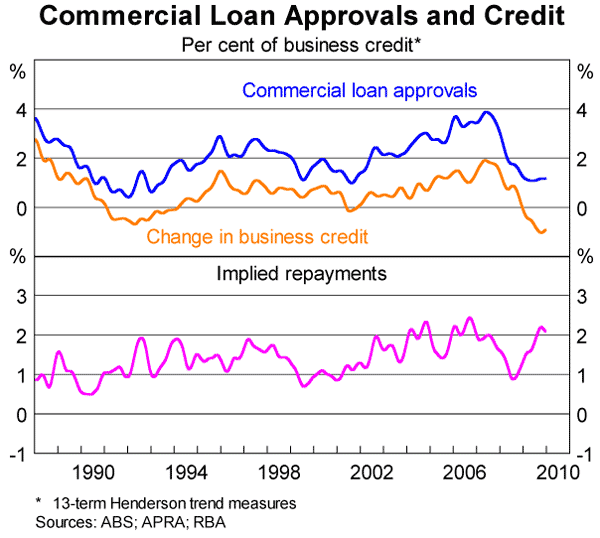
Making an assessment of why this contraction is occurring is difficult, but in all probability the weakness reflects both supply and demand factors. In the commercial property area, the supply of finance remains constrained with many lenders having little appetite to increase their commercial property lending. On the other hand, the demand for loans by many businesses in the broader economy appears to have declined. Many firms have used equity raisings and/or their cash reserves to pay down debt and, as a result, the rate at which loans are being repaid is historically high (Graph 8). Over time, as the economy strengthens and investment picks up, a reversal of these trends would be expected.
The second issue is the evidence of ongoing cautiousness by both households and businesses at a time when confidence is reported to be very high. This cautiousness can be seen not only in business credit figures, but also in household spending decisions and in surveys of firms' investment plans (Graph 9). It appears that one legacy of the global downturn is that many people, despite being generally confident about the future, are taking a more conservative approach to their spending. As we go forward, one of the things that will shape how the economy evolves is how these attitudes change.
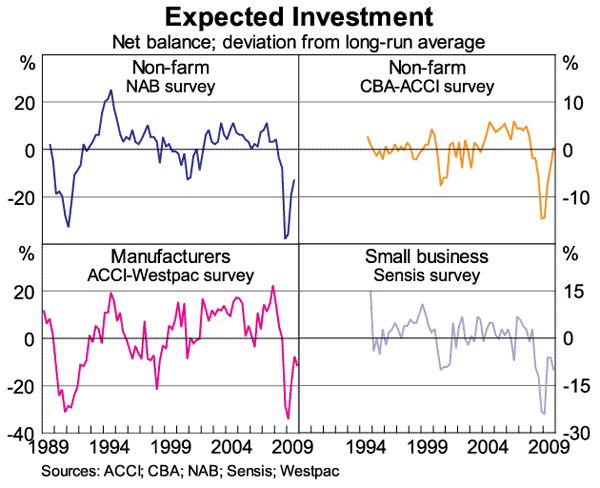
The third issue is the extent to which the timing of expenditure has been affected by temporary fiscal measures. Through much of last year, a question that was frequently asked, both in Australia and elsewhere, was whether the signs of recovery primarily reflected temporary fiscal measures. One concern was that some of these measures were simply bringing forward the timing of expenditure, and that once this bring-forward was complete, spending would again decline. A related concern was the possibility that spending might also weaken when the temporary boost to income from various fiscal transfers was not repeated.
Around the world, it is clear that temporary incentives or payments have had significant effects on spending patterns: the various car scrappage schemes are perhaps the best example of this. In Australia, we have also seen some of these effects, particularly with the increased first-home owners' grants and temporary tax deductions for business investment. The latter, for example, has had a significant effect on vehicle sales to businesses (Graph 10).
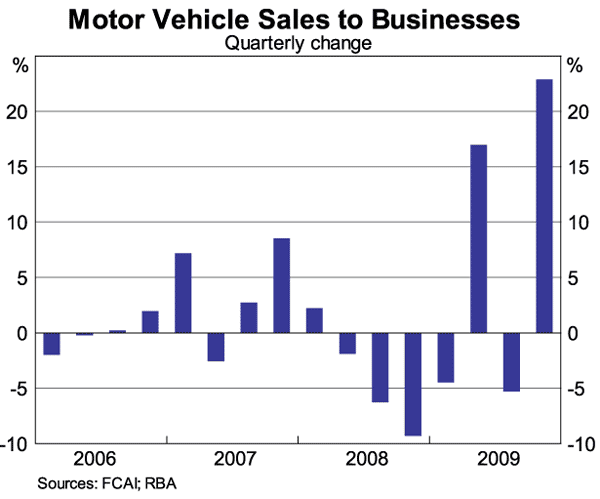
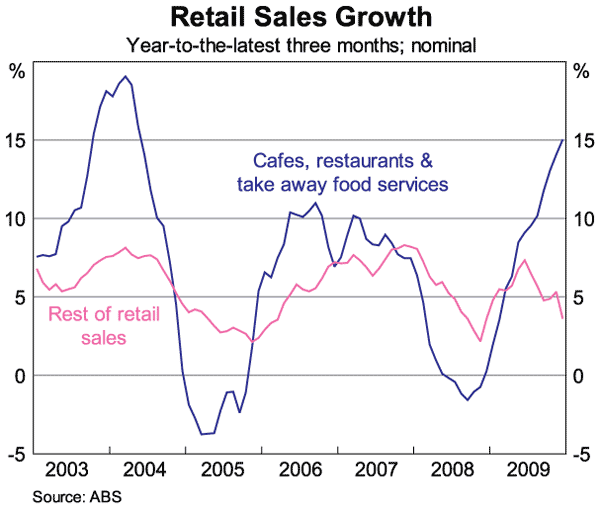
Looking forward, there remains some possibility that, with these measures now having been wound back, activity could again slow. However, as time has passed, the likelihood of this being the case has declined. Household consumption held up better than expected over the second half of 2009 after the fading of the effects of the earlier cash payments. Over recent months, there is some evidence to suggest that the purchase of various services by the household sector has been particularly strong with, for example, a marked increase in spending on restaurants, cafes and take-away food (Graph 11). This is unlikely to be related directly to temporary fiscal measures. More broadly, the expansion of the resources sector and the improvement in the terms of trade reflect structural developments in the world economy, rather than temporary policy measures in Australia.
Inflation
The third area that I would like to touch on is the moderation in inflation that has occurred in Australia.
If we go back to the September quarter 2008, the year-ended inflation rate in underlying terms was running at a little over 4½ per cent. It is now around 3¼ per cent, with the outcome for the December quarter around 0.6 per cent, a marked step down from rates in previous quarters. This moderation is in line with what we had been expecting for some time.
This reduction in inflation reflects three main factors: a slowing in wage growth in the private sector; the appreciation of the exchange rate; and an increase in spare capacity in the economy. These factors all take time to fully work their way through, so we expect a further period of modest quarterly outcomes and thus further moderation in the year-ended inflation rate.
One issue that has attracted some attention lately is how the Bank assesses the rate of underlying inflation. Here, it is important to point out that we do not have a mechanical approach. What we are trying to do is to discern the average rate of increase in prices, abstracting from particularly unusual movements.
At any point in time, we are looking at the whole range of price changes in the economy and using various analytical techniques to derive measures of central tendency. Inevitably, these different measures produce slightly different outcomes, but they show the same general patterns over time (Graph 12). Since there is no single unambiguously ‘right’ measure, we look at them all. Then, using all the information at our disposal, we make our general assessment of the rate of underlying inflation.
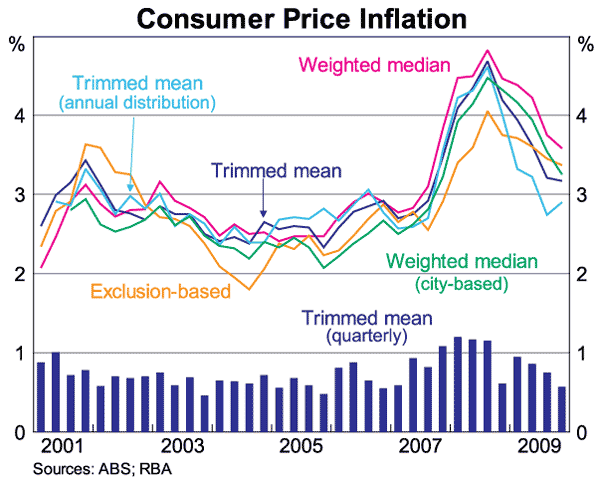
We do all this because we have found it a useful input into thinking about how CPI inflation – which after all is our objective – is likely to evolve over time. As we go through the process of putting our inflation forecasts together, understanding recent price pressures in the economy is important, and we have found looking at the various measures of underlying inflation helpful in this process. But to emphasise again, our focus here is very much a forward-looking one.
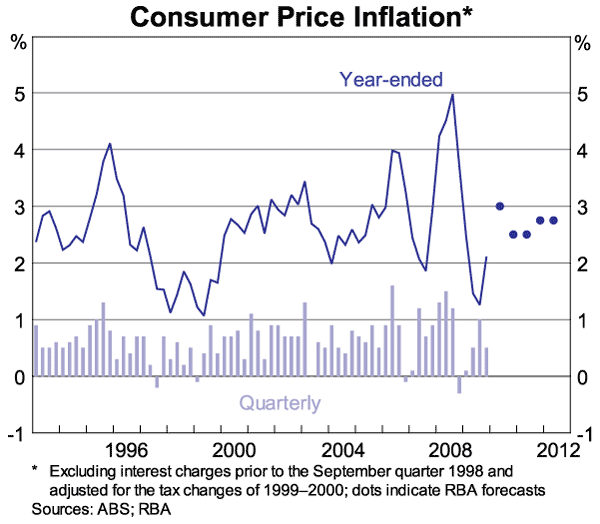
Our latest inflation forecasts were set out a few weeks ago in the Statement on Monetary Policy. We expect that CPI inflation will be around 2½ per cent in 2010 and just a little higher in 2011 (Graph 13). These forecasts represent small upward revisions to those set out three months ago, largely reflecting the fact that the economy looks to have less spare capacity than earlier thought likely.
Concluding Remarks
Overall, the Australian economy finds itself in a much better position than the other advanced economies. We have come through the global downturn better than expected and, unlike many other advanced economies, employment has recently grown strongly and the level of investment remains high. We are benefiting from high commodity prices and from our links with Asia. Inflation is moderating, and is expected to be consistent with the medium-term target over the next couple of years.
Risks of course remain, both in the advanced economies and in Asia. But the central scenario for Australia over the next few years remains a positive one, with the challenges that we are likely to face being quite different from those facing the other advanced economies.
Thank you.