Speech The Resources Boom and the Australian Dollar

Christopher Kent
[*]
Assistant Governor (Economic)
Address to the Committee for Economic Development of Australia (CEDA) Economic and Political Overview
Sydney –
- Audio 13.77MB
- Q&A Transcript
I would like to thank CEDA for the invitation to speak here today.
I thought I would take the opportunity to talk to you about the implications of the resources boom for the Australian dollar.
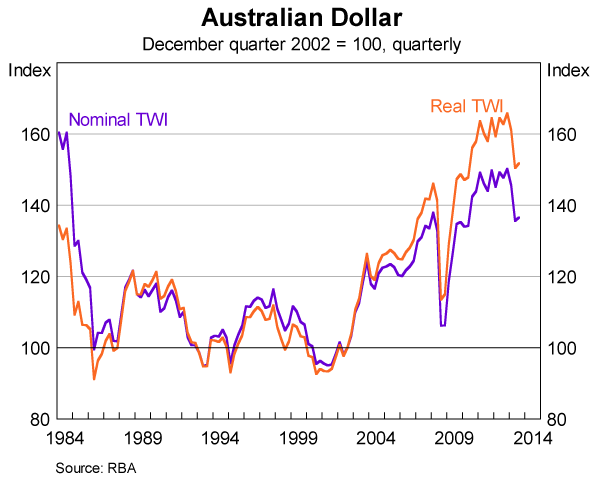
The past decade saw the Australian dollar appreciate by around 50 per cent in trade-weighted terms (Graph 1).[1] The appreciation was an important means by which the economy was able to adjust to the historic increase in commodity prices and the unprecedented investment boom in the resources sector.[2] Even though there was a significant increase in incomes and domestic demand over a number of years, average inflation over the past decade has remained within the target. Also, growth has generally not been too far from trend. This is all the more significant in light of the substantial swings in the macroeconomy that were all too common during earlier commodity booms.[3]
The high nominal exchange rate helped to facilitate the reallocation of labour and capital across industries. While this has made conditions difficult in some industries, the appreciation, in combination with a relatively flexible labour market and low and stable inflation expectations, meant that high demand for labour in the resources sector did not spill over to a broad-based increase in wage inflation.[4]
So the high level of the exchange rate was helpful for the economy as a whole. But now that the terms of trade are in decline and the resources boom has begun the transition from the investment to the production phase, lower levels of the exchange rate will assist in achieving balanced growth in the economy.
While my focus today is on the relationship between the resources boom and the exchange rate, at the outset I should note that this is only one factor – albeit a very important one – influencing the exchange rate. I will touch on some of the other factors later in my discussion.
Exchange Rate Mechanics
At the most basic level, the exchange rate depends on the (net) global demand (by foreigners and Australians) for all things denominated in Australian dollars, relative to demand for all things denominated in foreign currencies.[5] This includes goods and services available for purchase now and in the future, as well as claims on profits or returns to financial assets denominated in Australian dollars. The demand for Australian goods and services will depend, in part, on the real exchange rate – that is, the level of Australian prices (and wages) relative to those of the rest of the world. And the demand for Australian dollar assets, both physical and financial, will depend on expectations about their returns relative to those of comparable assets elsewhere in the world.
The exchange rate depends not only on the current demand for Australian goods, services and assets but also on expectations of all future demand. So, to the extent that it is determined in efficient, forward-looking markets, the nominal exchange rate today should embody relevant information about the future. In theory at least, this means that although the nominal exchange rate can respond to future news, it shouldn't move in a way that is predictable today.[6] However, periodically the exchange rate appears to deviate from what historical relationships with key determinants would suggest. During such episodes, if we assume that history is a good guide, and that we have measures of the right set of determinants, this in turn implies the potential for a correction in the exchange rate sometime in the future. The questions though are whether history is a good guide, have we given appropriate weight to each of the determinants, and when (if at all) might such a correction occur?
The Effect of the Resources Boom
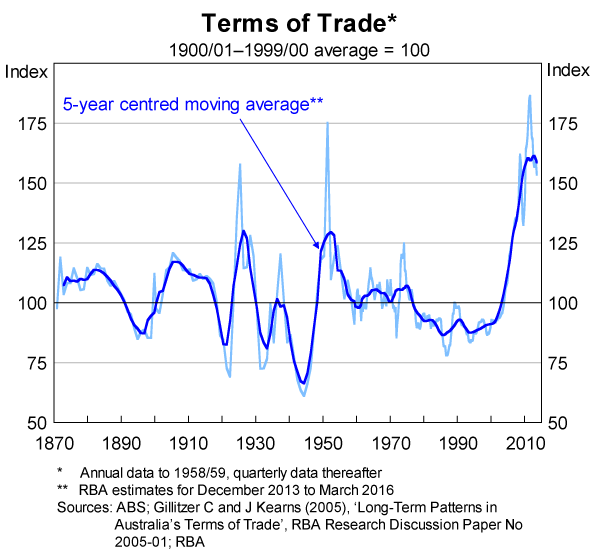
The terms of trade – the ratio of the price of our exports to imports – have always been an important determinant of our exchange rate.
The emergence of China onto the global economic stage at the turn of the millennium (after it joined the World Trade Organization) led to a large, and largely unanticipated, rise in global commodity prices and saw the near doubling of Australia's terms of trade between 2003 and 2011 (Graph 2).
The gradual realisation that the world was willing to pay a lot more for the commodities we had in abundance, and that this was likely to be true for some time, led to a significant increase in the demand for Australian assets tied to the production of commodities. This reflected a significant increase in the expected return to capital in the resources sector. There was also an increase in the demand for Australian labour and materials, to help build and then operate the new extraction, production and transport facilities that have been, and are still being, put in place in the resources sector.
These developments implied a significant increase in the demand for Australian dollars and hence led to an appreciation of the exchange rate. We can trace out the sources of the additional demand in terms of the three overlapping phases of the resources boom as follows:
- During the first phase – the boom in the terms of trade – we see a price effect. Higher commodity prices lead to more export revenue. Part of this revenue accrues as profits to Australian owners of existing resource and resource-related companies, wages for workers at these companies and taxes for Australian state and federal governments. Also, foreigners wanting to buy existing Australian resource assets add to the demand for Australian dollars for a time.
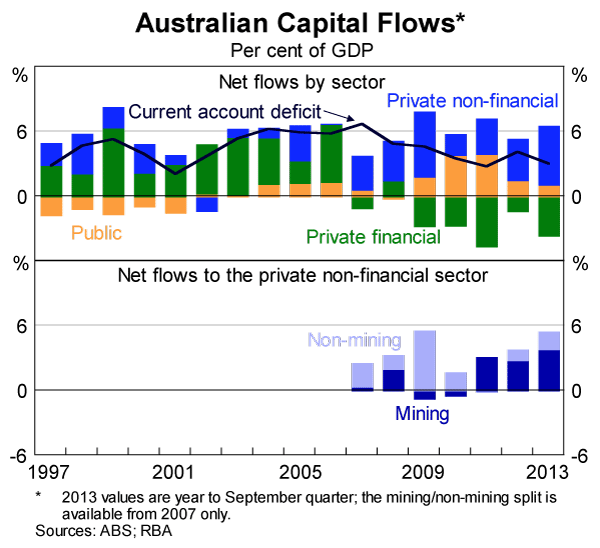
- During the investment phase of the boom, funds from offshore owners are used to pay Australian workers and resource-related firms putting additional capital in place in the resources sector. This has accounted for much of the capital flowing into Australia over the past few years (Graph 3).[7] Importantly, this source of demand for Australian dollars will decline as resources investment turns down. Absent further increases in commodity prices, the discovery of new mineral deposits, or a reduction in the costs of developing and extracting higher-cost deposits, we cannot expect investment to remain at recent levels.[8]
- Finally, there is a quantity effect during the production phase of the boom. This follows from the additional export revenue generated by the new resource projects. Some of this will accrue to Australian owners of the new projects and infrastructure, some will go towards paying workers and suppliers supporting the new facilities, and some will go to paying taxes owed in Australia. The rest will remain in the hands of foreign owners.
The effect of the higher commodity prices on the nominal exchange rate at any point in time will depend on the expected sum of these different flows into the future. Also, there may be offsetting reductions in inflows to other sectors of the economy, particularly those adversely affected by the appreciation of the exchange rate. Clearly, determining this sum is no easy task and is subject to considerable uncertainties.
One aspect of the uncertainty is the path of commodity prices themselves. Indeed, the full extent of the rise in commodity prices only became clear over a number of years, starting from around the mid 2000s. This gradual updating of the outlook for commodity prices meant that the exchange rate didn't jump higher in one step. Instead, it moved higher over time as commodity prices increased.
Another aspect of the uncertainty is the extent to which the higher commodity prices influence the three different flows I've just described. This will depend in turn on a number of things, including:
- how much extra export revenue is earned by existing resource operations and how much of that accrues to Australian residents;
- the extent of new investment in the resources sector;
- how much of the investment expenditure is accounted for by Australian workers and companies helping to put the physical capital in place; and
- how much additional export revenue is generated by the new production facilities and how much of that accrues to Australian residents?
Using History as a Guide
These are very difficult things to know in advance. We could try to estimate the three types of flows directly – perhaps with reference to past behaviour – and then update these estimates as we observe the flows over time and the evolution of the economy more generally. That, in essence, is what foreign exchange markets do one way or another. Alternatively, we could start the process by estimating a model linking the exchange rate to some of its key determinants. This is not meant to imply that past behaviour provides an ‘optimal’ benchmark, but it can be a useful guide nonetheless.
One approach is to run a regression of the real exchange rate against the terms of trade and a measure of the (real) interest differential (between Australia and those of large countries with open capital markets). It turns out that this relatively simple ‘reduced-form’ model produces reasonable statistical results over a long period, which doesn't mean that it is very accurate, just that there are no obvious contenders that are better.
Graph 4 compares the actual real trade-weighted index of the Australian dollar (the real TWI) with estimates of the medium-term ‘equilibrium’ exchange rate from the model I just described. This is the level that the exchange rate has tended to settle at over time for given levels of the terms of trade and the interest rate differential.[9] We can see that the exchange rate has, on occasions, deviated noticeably and for some time from the ‘equilibrium’ estimates.[10] The shaded band around the ‘equilibrium’ gives a sense of the standard deviation of the actual exchange rate from the model estimates. However, even this range suggests more precision than may be warranted, since the level of the ‘equilibrium’ can vary quite a bit depending on the sample period used for estimation.
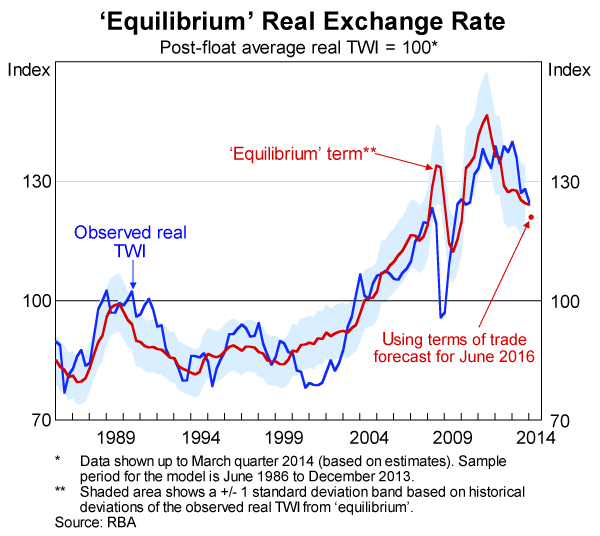
In terms of recent experience, this analysis suggests that prior to the peak in the terms of trade in late 2011, the exchange rate had increased broadly in line with what past behaviour would have suggested. But thereafter, the exchange rate drifted higher still until early 2013, even though the terms of trade fell quite sharply from September 2011 and the interest differential had started to decline from early 2012.[11]
The deviation of the exchange rate from the estimated equilibrium over the past couple of years was not unprecedented. Nevertheless, on a number of occasions over the past 18 months or so the Bank pointed to the high level of the exchange rate, noting that it had not declined in response to changes in these fundamental determinants.[12] This concern can also be explained by considering changes in the exchange rate in the context of how the economy more broadly has evolved over this period.
It makes sense to include the terms of trade and the interest rate differential in a model of the exchange rate because they capture, at least in part, the extent of any excess demand pressure in an economy (relative to other economies). An increase in demand for an economy's factors of production and a reduction in its spare productive capacity will tend to imply a higher return to capital and usually be associated with higher yields on financial assets. Hence, all else equal, such changes will tend to lead to an appreciation of that economy's nominal exchange rate. Similarly, an economy in which demand is strong relative to its productive capacity will, other things equal, experience an increase in its real exchange rate. This can occur via an increase in inflation of wages and prices, or in a more timely way via a nominal appreciation.
Changes in unemployment rates across countries can provide a rough gauge of these relative demand pressures. Following the onset of the global financial crisis, growth in Australia slowed and the unemployment rate increased, but nowhere near the extent experienced by most advanced economies that were in the throes of deep recessions. So from 2007 to late 2010, the unemployment rate improved in Australia relative to that of the major advanced economies. While Australia's terms of trade increased further over this period, the relative strength of Australia's economy, as evidenced by relative unemployment rates, was also consistent with an appreciation of the Australian dollar.
However, growth in Australia began to slow from early 2012. The transition from the investment to the production phase of the resources boom has contributed, in part, to growth slowing to a below-trend pace over the past year or so, where it is expected to remain for a time. Meanwhile, prospects for growth in many other advanced economies have improved. Accordingly, the gap between unemployment rates that had opened up earlier declined from 2011 onward.
In short, looking at the performance of the Australian economy relative to that of other advanced economies tells a similar story to that which I described using the model based on the terms of trade and the interest rate differential. Namely, the relative strength of the Australian economy for a time following the onset of the global financial crisis was broadly consistent with an appreciation of the Australian dollar, but that situation turned around sometime in 2011, suggesting that the exchange rate might have depreciated somewhat earlier than it did.
Why the Model/History Might be a Less Useful Guide this Time Around
My earlier discussion of the model estimates suggested that it is hard to be very precise about whether the level of the exchange rate is in line with fundamental determinants. To emphasise this point, let me come back to the effect of the resources boom on the exchange rate.
It is possible that history (including that embodied in the model estimates) is less useful as a guide for this current resources boom. One point of difference is the share of foreign ownership of the resources sector. While it is difficult to get reliable estimates of this share, it appears to have increased over time.[13] This means that less of the extra revenue associated with both existing and new resource ventures will accrue as profits paid to Australian residents than might have been the case in earlier booms.[14]
Another point of difference with this episode is that liquefied natural gas (LNG) projects will account for a large share of the additional production and exports generated by the boom in investment. By some estimates, LNG exports will rise from less than half the value of coal exports currently to be worth more than coal exports in only a few years (Table 1). While LNG projects require a substantial number of Australian workers to help put the new extraction, processing and transport facilities in place, they require relatively few workers during the production phase.[15] This means that less revenue from the sale of resource exports will accrue to Australian residents in the form of wages than would have been the case if more of the investment had been focused on other commodities.
| 2002/03 | 2012/13 | 2017/18* | |||
|---|---|---|---|---|---|
| $b | Share (per cent) |
$b | Share (per cent) |
$b | |
| Iron ore | 5 | 4 | 57 | 19 | 87 |
| Coal | 12 | 8 | 39 | 13 | 59 |
| LNG | 3 | 2 | 14 | 5 | 66 |
| Total goods and services | 152 | 100 | 302 | 100 | – |
|
* Forecasts for iron ore, coal and LNG exports are taken from the Bureau of Resources
and Energy Economics'
Resources and Energy Quarterly – September 2013 Sources: ABS; BREE; RBA |
|||||
Either of these possibilities would suggest that a model linking the exchange rate to the terms of trade based on earlier experiences might overstate the ‘equilibrium’ level of the exchange rate during this episode. That is, the ‘equilibrium’ rate shown in Graph 4 might be overstated.
Working in the other direction, however, there are reasons to think that the ‘equilibrium’ rate in the model might have been understated over recent years. One reason for a bias in this direction is the effect of the balance sheet expansions by the central banks of the major advanced economies.[16] The US Federal Reserve and the Bank of Japan took these actions in response to the weak state of demand in their respective economies. The expansions of their balance sheets have for some time worked to reduce yields on financial assets in these economies. One consequence of this is that the value of their currencies is likely to have been lower than would otherwise have been the case.
The fact that these expansions have been occurring for some time suggests that they may have been placing some upward pressure on the Australian dollar in the years following the onset of the global financial crisis. The fact that they are still playing out may have continued to provide some support to the Australian dollar beyond the time at which the terms of trade and the interest rate differential had begun to decline.
Nevertheless, the Fed signal earlier last year that tapering (i.e. the scaling back of the extent of its asset purchases) might not be too far away may have helped to bolster perceptions that the outlook for growth in the United States was improving. This would also imply an improvement in returns to US assets. Such a change in views, when combined with the existing influence of the decline in our terms of trade and the interest rate differential, may have helped to trigger the depreciation of the Australian dollar from earlier last year.
Conclusion
Let me conclude by drawing together some of these threads.
In theory at least, markets for foreign exchange should already embody all relevant available information about current and future demand for currencies. While exchange rates will respond to (as yet unknown) developments, it is hard to know with any certainty today what exchange rates will do in the future.
Having said that, there are times when the exchange rate does not move in line with what the historical behaviour of fundamental determinants would otherwise imply. This suggests that a correction in the exchange rate might be in prospect. However, assessing how much weight to give to different determinants, and determining when any correction might occur, is subject to considerable uncertainty.
There were good reasons to think that the Australian dollar has for the past couple of years been on the high side of fundamentals. In particular, the decline in the terms of trade from late 2011 and the transition from the investment to the production phase of the mining boom imply lower returns to capital in Australia and a lessening of demand for Australian factors of production relative to the rest of the world. Moreover, the decline in mining investment means that a decline in an important source of capital inflow over recent years is in prospect. Given all of this, it was not so surprising that the Australian dollar has declined over the past year.
In the same vein, it was somewhat surprising that the exchange rate had not depreciated earlier. However, it may have been that more tangible signs of improved prospects for growth in a number of advanced economies, particularly in the United States, helped to spur on the depreciation of the Australian dollar.
The Bank has noted for some time that lower levels of the exchange rate, if sustained, will assist in achieving balanced growth in the economy and bring about a quicker return to trend growth. It will also add a little to inflation, for a time. On present indications, inflation is expected to be somewhat higher than we'd thought in November, in part because of the further depreciation since then, but it is still expected to remain consistent with the inflation target.
Endnotes
I thank Jonathan Hambur, Daniel Rees and Michelle Wright for assistance in preparing these remarks. [*]
From the mid 1960s to the mid 1970s, the nominal TWI appreciated by about 35 per cent. Prior to that, there was a substantial appreciation after World War I, when the Australian pound was fixed to the British pound, which in turn had returned to the gold standard at its pre-WWI rate. [1]
For example, see Stevens G (2011), ‘The Resources Boom’, RBA Bulletin, March, pp 67–71; and Plumb M, C Kent and J Bishop (2013), ‘Implications for the Australian Economy of Strong Growth in Asia’, RBA Research Discussion Paper No 2013-03. [2]
For a discussion of these episodes, see Atkin T, M Caputo, T Robinson and H Wang (2014), ‘Macroeconomic Consequences of Terms of Trade Episodes, Past and Present’, RBA Research Discussion Paper No 2014-01; and Battellino R (2010), ‘Mining Booms and the Australian Economy’, RBA Bulletin, March, pp 63–69. [3]
Moreover, by reducing the cost of imported goods and services, the appreciation helped to offset the rise in domestic cost pressures associated with the investment boom. [4]
To be clear, Australian exports paid for in US dollars (as is true of many commodities) will still lead to a demand for Australian dollar-denominated assets to the extent that the revenue finds its way into Australian dollar-denominated bank accounts, via repatriation by Australian owners of their export receipts, for example. [5]
Other than in a smooth fashion to account for any interest rate differential. See Sarno L and M Taylor (2002), The Economics of Exchange Rates, Cambridge University Press, Cambridge UK. [6]
For a discussion of the impact of the mining boom on cross-border financial flows, see Debelle G (2013), ‘Funding the Resources Investment Boom’, Address to the Melbourne Institute Public Economic Forum, Canberra, 16 April. Whether the investment is undertaken by Australian or foreign residents need not affect the demand for Australian dollars. For example, Australian residents could choose to borrow offshore to fund the investment in the resources sector (assuming unchanged saving and investment behaviour elsewhere in the economy). This would lead to inflows of capital during the investment phase, followed by outflows associated with the servicing of that debt during the production phase. [7]
It is worth noting that a decline in the Australian dollar will help to reduce these costs. Also, gross investment needs to be higher to offset the effects of depreciation on the now higher level of the capital stock. [8]
The model also incorporates short-run variables that are intended to capture near-term financial market influences on the behaviour of the real TWI. These include the change in the CRB commodity price index, the change in the real S&P 500 total return index and the change in the VIX index of expected US equity price volatility. [9]
For an early discussion of one such episode around the turn of the millennium, see Rankin B (1999), ‘The Impact of Hedge Funds on Financial Markets: Lessons from the Experience of Australia’, in D Gruen and L Gower (eds), Capital Flows and the International Financial System, Proceedings of a Conference, Reserve Bank of Australia, Sydney, pp 151–163. [10]
It is hard to argue that the full extent of the rise in the terms of trade up to September 2011 and its subsequent decline were well predicted by markets or forecasters more generally. Leading up to the peak, forecasts tended to under-predict the terms of trade (Plumb et al 2013), and around the peak, forecasters tended to under-predict the subsequent decline. [11]
See, for example, Stevens G (2012), ‘Opening Statement to House of Representatives Standing Committee on Economics’, Canberra, 24 August. [12]
Some estimates highlight the fact that foreign ownership of LNG projects is higher than it is for iron ore and coal, and we know that LNG accounts for a very large share of resources investment and is going to account for a substantial and increasing share of export revenues (see Connolly E and D Orsmond (2011), ‘The Mining Industry: From Bust to Boom’, RBA Research Discussion Paper No 2011-08). Similarly, about half of resources investment over the past decade has been undertaken by foreign companies (see Arsov I, B Shanahan and T Williams (2013), ‘Funding the Australian Resources Investment Boom’, RBA Bulletin, March, pp 51–61). [13]
The difference in the ownership structure is even starker when comparing this episode with earlier times when the rural sector played a prominent part in commodity booms. During the Korean War, the sectors benefiting from higher wool prices were largely, if not entirely, owned by Australian residents, and were relatively intensive in their use of labour; although this episode falls outside of the sample used to estimate the model. [14]
As a rough guide, the construction of an iron ore or coal mine typically requires around two to three times as many workers as are ultimately required to operate the mine. For a typical Western Australian LNG project, the ratio is close to 10:1 (Department of Mines and Petroleum (2013), ‘Significant Resource Projects in Western Australia’ <http://www.dmp.wa.gov.au/documents/Prospect_September_2013.pdf>, Prospect, September, p 32; Resources Industry Training Council (2010), Western Australian Gas and Oil Industry: Workforce Development Plan <http://ritcwa.com.au/LinkClick.aspx?fileticket=oH5bC1PV7aA%3D&tabid=133>, November). Unlike in Western Australia, Queensland's LNG projects draw on coal seam gas, which will be supplied by thousands of wells drilled over the life of the projects. This drilling program will require an ongoing investment and sustain a sizeable upstream workforce. [15]
See, for example, Reserve Bank of Australia (2014), Statement on Monetary Policy, February. [16]