Speech Non-mining Business Investment – Where to from here?

Christopher Kent[*]
Assistant Governor (Economic)
Address to the Bloomberg Economic Summit
Sydney –
- Audio 23.09MB
- Q&A Transcript
Introduction
I'd like to thank Bloomberg for the opportunity to talk to you today. I discussed this topic at this same venue 18 months ago. The outlook for non-mining business investment is an important element of our forecasts. It depends on a range of forces acting on the economy, including the stimulus currently being provided by the very low level of interest rates. But, forecasting economic activity is hard. Understanding and forecasting business investment is arguably harder still.
When I was here in April of last year, I'd suggested that:
- mining investment would be likely to peak in 2013;
- non-mining investment would be likely to pick up, but only gradually; and
- growth for the economy as a whole would be a little below trend in 2013 and then pick up gradually through 2014.
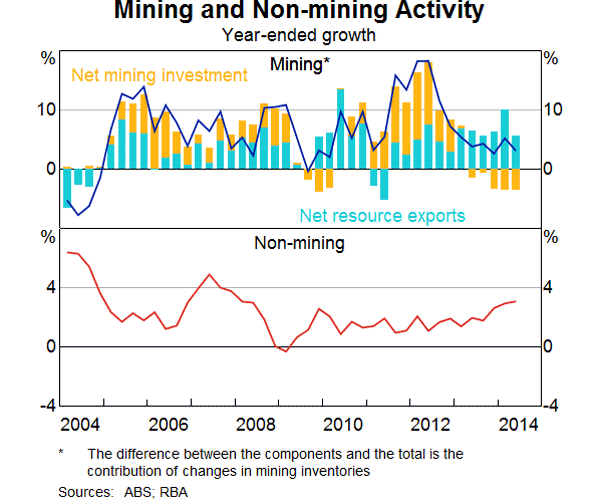
It now looks like mining investment peaked in late 2012 (Graph 1). Despite a substantial decline in mining investment since then, growth of the economy overall picked up to a pace that was around trend over the course of the past year. Much of that improvement has owed to a sharp rise in resource exports.
At the same time, there has also been an improvement in the growth rate of economic activity in the non-mining sectors, even though non-mining business investment has remained subdued. This better growth of non-mining activity often gets missed given all the focus on the resources boom. While this improvement is welcome, a key question is how durable the improvement will be? It might even gather a bit more steam, thereby helping to drive overall growth to an above-trend pace at some point. Such developments are possible but by no means certain. They depend in part on non-mining business investment, which is the motivation for my talk today.
Recent Past
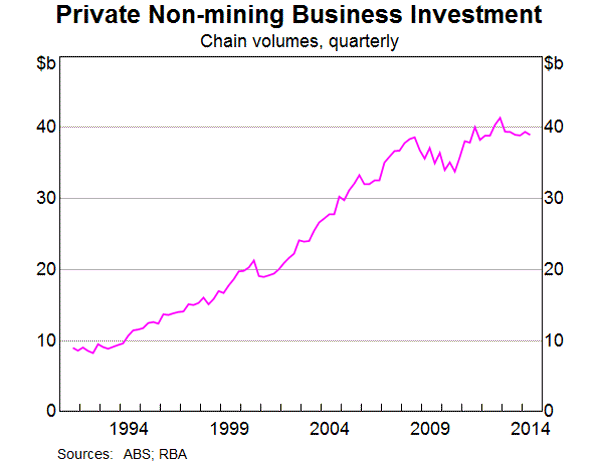
Over recent years, non-mining business investment has been subdued. After recovering from the decline that followed the global financial crisis, non-mining business investment in real terms has been little changed over the past three years or so (Graph 2). In nominal terms, non-mining business investment is at a very low level as a share of GDP relative to its history.[1]
Non-mining business investment should depend, in large part, on the strength of expected demand in the non-mining sectors of the economy (over the life of that investment). Current demand conditions, however, may have a strong influence on investment for two reasons. First, firms tend to draw on recent experience when assessing prospects for future demand. Second, stronger sales today will boost current cash flows, which will assist firms facing financial constraints.
Hence, the gradual pick-up in the growth of non-mining economic activity over the past year augurs well for investment. Low interest rates and robust population growth are underpinning strong demand in the housing market, with house prices rising rapidly and dwelling investment picking up strongly. Low interest rates are also supporting growth of consumption at a time when subdued conditions in the labour market are weighing on the growth of incomes. These developments, as well as growth in export industries such as tourism and education, are consistent with a pick-up in business conditions across a range of industries.
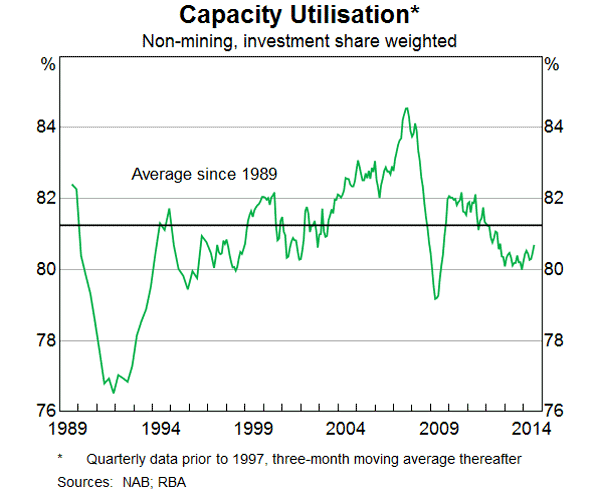
Despite these gains, survey measures of non-mining capacity utilisation have not improved much over the past year. A measure derived from the NAB survey (based on weighting industries according to their contribution to investment) implies that capacity utilisation remains a bit below average (Graph 3). By itself, this suggests that demand in the non-mining sector will need to rise a little further before businesses feel the need to undertake substantial investment in new capacity. Our forecasts for the economy suggest that this will occur in time, but the extent and timing of new investment remains uncertain.
It's Not Just Output/Demand that Matters
In addition to the strength of demand, a range of other factors also influence investment decisions. In particular, investment depends on whether the expected return to new capital outweighs the cost of installing it. In other words, a firm should invest whenever the market value of its existing capital is greater than its book value. This is known, in academic circles, as Tobin's Q theory of investment, where Q is the ratio of the market value to the book value of capital.
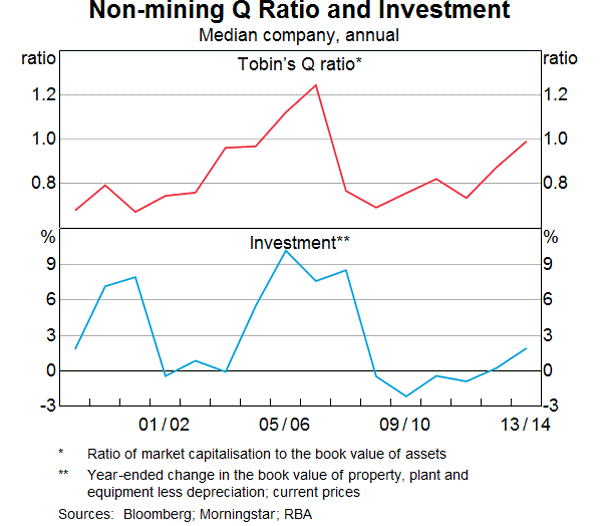
It turns out that empirical support for the relationship between investment and the Q-ratio is weak for the economy as a whole.[2] However, it is possible to show that such a relationship exists at the level of individual firms (Graph 4). Estimates from Tobin's Q type models based on Australian firm-level data indicate that non-mining investment has been unusually weak by historical standards in recent years. This is true after controlling for many other factors typically included in such models, such as sales growth and cash flows. For firms in the Bank's liaison program, it also appears that investment has been weaker than the recent growth in sales would suggest.
With that in mind, let's consider some possible explanations for the weakness in non-mining business investment, and what that might imply for the outlook.
The cost of borrowing remains too high and external finance is difficult to access?
My discussion so far has ignored the fact that firms face financing constraints of varying degrees and certain types of finance are more costly to obtain than others. In particular, the cost of external equity finance is typically greater than the cost of external debt which, in turn, is greater than the cost of internal funding.
Financial constraints certainly became more pervasive for many firms as the global financial crisis unfolded. However, those constraints have eased over time. More recently, external financing has become widely available at very favourable cost. Primarily, this reflects the stance of monetary policy (both in Australia and abroad), which is delivering historically low levels of interest rates, ample liquidity and has helped to push up equity prices.
Indeed, a common refrain of firms in the course of our business liaison has been that neither the cost nor the availability of external finance have been factors limiting investment of late. Moreover, (non-financial) corporate balance sheet data indicate that many Australian companies currently hold relatively high levels of cash, suggesting that they have access to resources to finance investment when the time comes.
The exchange rate is too high?
The exchange rate has declined somewhat relative to its peak in the first half of 2013. But it remains high, especially given the sizeable decline in commodity prices this year. The implications of this vary across traded and non-traded sectors.
A further decline in the exchange rate would provide additional support to demand for domestic firms producing tradable goods and services. At the same time, however, the high exchange rate also means that imported capital goods are currently relatively cheap.
Hence, the still-high level of the exchange rate may be a net positive factor for the investment plans of some firms in non-tradable industries. For firms in tradable industries, on the other hand, the low cost of imported capital is offset by the effect of the high exchange rate on the demand for the goods and services they produce.
In short, the high exchange rate might be playing a part in restraining investment in some sectors of the economy, but it's unlikely to be the full story.
Animal spirits are too weak?
What is often referred to as ‘animal spirits’ consists of three key elements.[3] First, there is uncertainty, which describes the range of possible outcomes, let's say for demand, but other things like costs matter too. Second, there is the expected or most likely outcome. Together, these describe the distribution of possible outcomes. But firms' willingness to invest also depends on the third element, which is their appetite for risk. I'll consider each of these elements in turn.
The outlook is too uncertain?
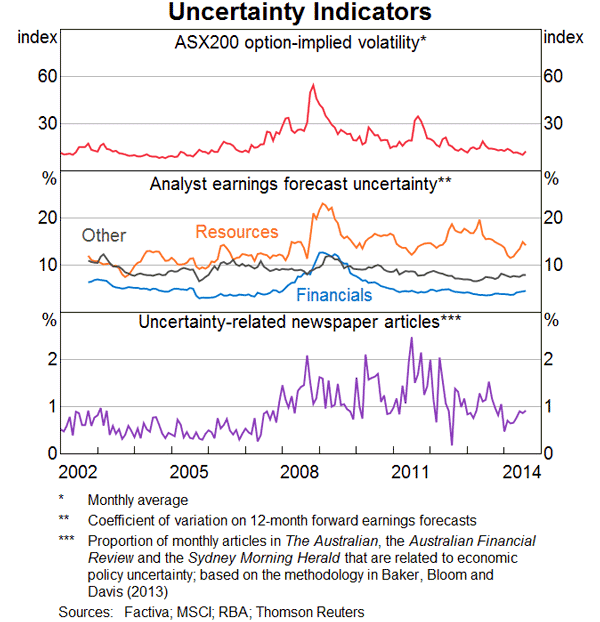
On the surface, uncertainty seems like an appealing explanation for subdued investment. However, we should remember that firms always have to make investment decisions in an environment of uncertainty, not just about the prospects for the macroeconomy but also for their industry. Rather, the question we need to ask is whether uncertainty in recent years has been elevated?
There are a number of ways that we might try to measure the extent of uncertainty. One measure is the volatility of firms' share prices (Graph 5).[4] Another is the dispersion of analysts' forecasts of firms' earnings (per share). A third can be constructed by looking at the proportion of news stories that mention uncertainty.[5] These measures all increased at the time of the global financial crisis. All of the measures have since declined to be around the levels seen prior to the financial crisis, when non-mining business investment had been growing strongly.[6]
Expectations regarding demand are too weak?
Even if uncertainty about the range of possible demand outcomes is not too different from the past, the most likely outcome – the mean of the distribution – might still be too weak to lead to significant new investment projects.
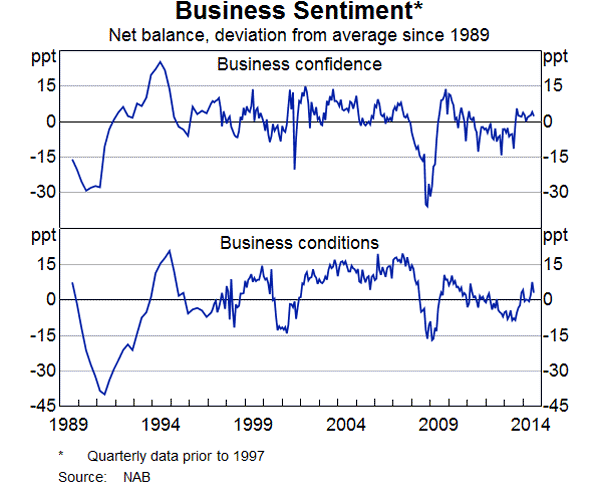
Business surveys ask firms what they expect conditions will be like in the near future; the results are described as ‘business confidence’. The long-running NAB survey suggests that business confidence was in decline and below its long-run average up to the middle of last year (Graph 6). Since then, it has picked up noticeably. This improvement was shortly followed by a broad-based pick-up in the survey's measure of actual business conditions (that is, trading conditions, profits and employment). According to the NAB survey, and a number of other business surveys, business confidence and conditions are now above average.
However, our liaison program suggests that businesses generally remain reluctant to take on significant new investment projects until they can be confident of a more sustained improvement in demand conditions. How long do conditions need to hold at above average levels before the improvement is considered to be sustainable?
We don't know the answer to this. In part, this is because animal spirits are by no means mechanistic or predictable. What matters for your investment plans is not just what you think about the future, but what you think your competitors think about the future. In part, this is because if your competitors are less than enthused about investing, the pressure for you to invest to avoid being left behind is lessened, and vice versa.
Elevated risk aversion?
Even though measures of uncertainty appear to have declined, and firms' confidence about future business conditions is above average, firms' investment plans may sit idle if they are more risk averse than in the past. (By firms, I mean both managers and shareholders alike.)
It's clear that firms became more risk averse at the onset of the global financial crisis. It seems that they remain affected by that experience. While the direct effects of the crisis on the Australian economy were generally short-lived and relatively minor compared with the experience of many economies, the events of that time led many Australian businesses and households to re-evaluate their appetites for risk. The household sector increased its saving rate noticeably at the time of the crisis and it remains around the more prudent levels that had been the norm in earlier decades.[7] Also, businesses deleveraged and have built up their levels of cash holdings.
One measure of firms' appetite for risk is their ‘hurdle’ rates of return. These serve as rules of thumb for firms to evaluate whether or not to proceed with a particular project. The higher the hurdle, the less likely any given project will be given the go ahead. There is no evidence that hurdle rates of return have increased over recent years. But neither is there evidence that they have declined even though the average cost of capital for firms has fallen.[8] This larger gap between the hurdle rates and the average cost of capital implies a reduction in firms' appetite for risk. This result, which is consistent with information from our liaison program, appears to be a global phenomenon.
Our liaison provides other evidence of a more cautious approach to investment over recent years. In particular, many firms now require investment projects to satisfy shorter payback periods and be approved at higher levels of management than was typical in the past.[9]
Other Longer-term Determinants?
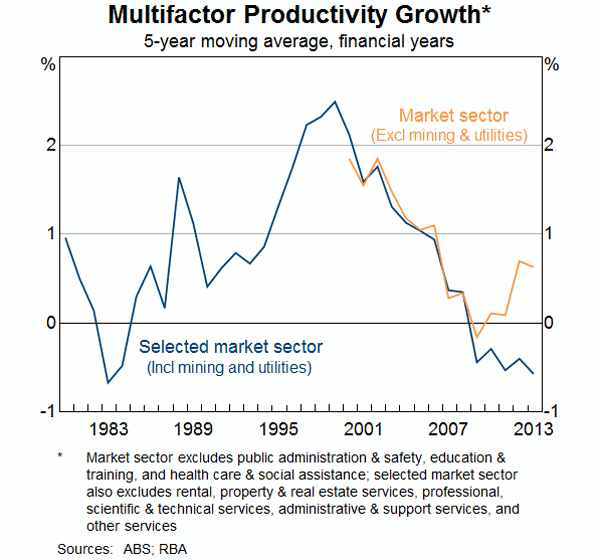
The current weakness in non-mining business investment may reflect the effect of some longer-run determinants of investment. One such candidate is (multifactor) productivity growth. Relatively weak growth of productivity over much of the past decade would have weighed on the return to capital and reduced the incentives to add to the capital stock in non-mining industries (Graph 7). (In principle, this effect should already be reflected in levels of Tobin's Q.)
If productivity growth were to remain relatively low, that would weigh on overall growth of the economy. Low growth of investment would naturally follow from low productivity growth, but it would not be the cause of weak growth of the overall economy. In any case, it's hard to know exactly what productivity growth is likely to do in the future. More recently, multifactor productivity growth appears to have increased a little. It is currently not far from growth rates seen prior to the mid 1990s, which was a period of especially rapid growth.
In summary, some of these explanations have more merit than others. External finance is generally readily available and at very low cost, so this can't explain the weakness in non-mining business investment. Looking at the available data, it's hard to argue that heightened uncertainty is playing much, if any, role. Rather, some combination of relatively low growth in domestic demand, the effects of the high exchange rate, a lack of confidence and a lower appetite for risk (than in the past) appears plausible. There are some metrics consistent with this, and it aligns too with what businesses say is holding them back.
What Do the Data Suggest about the Future?
The Australian Bureau of Statistics capital expenditure (‘Capex’) survey provides a measure of firms' investment plans for up to 18 months ahead.[10]
The most recent survey implies a modest increase in nominal non-mining business investment in 2014/15, in the order of 4½ per cent. The survey suggests that investment is likely to rise for a number of industries, including: rental hiring and real estate; information media and technology; retail; and construction. This picture is consistent with the ongoing recovery in household expenditure, including on dwelling investment, and in non-residential building construction. Investment is expected to decline in the manufacturing sector and for utilities.
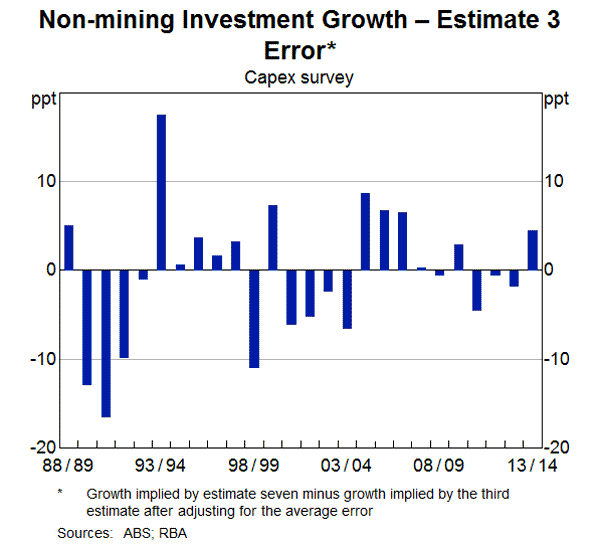
Given that firms adapt their plans as events unfold, the early readings on investment intentions for a given year often turn out to be wrong. We can see the extent of this by comparing the early estimates for a given year with the final (seventh) estimates in the Capex data. This is shown here based on the third estimate, which is what we currently have to hand for this financial year (Graph 8). We can see that even over the course of just a few quarters, business investment can turn out to be quite a bit higher, or quite a bit lower, than the most recent reading from the survey suggests. For example, investment covered by the Capex survey was much weaker than had been expected initially through the 1990s recession and early 2000s slowdown. But it was stronger than initially expected through the mid 2000s and a bit stronger than expected last financial year.
In short, if firms decide to undertake more investment than they had earlier anticipated, that investment can come about relatively quickly.
Conclusions
In conclusion, non-mining business investment has been subdued and measures of capacity utilisation remain a bit below average levels. Meanwhile, over the past year or so there has been a gradual increase in the pace of growth of economic activity outside of the mining sector, owing in part to the very low level of interest rates.
Subdued investment (outside the mining sector) has been consistent with a period of greater uncertainty and below-average confidence. However, a number of indicators suggest that uncertainty has declined to levels seen prior to the global financial crisis. Also, measures of business confidence have picked up over the course of the past year to be a bit above long-run average levels. While this is a welcome development, it may not be sufficient to spur investment if businesses' appetite for risk remains relatively low. Moreover, the still-high level of the exchange rate may be weighing on investment of firms in the traded sector.
Nevertheless, there are tangible indications that non-mining business investment will grow at a modest pace this financial year. And if firms' willingness to take on risks improves, investment could easily be stronger still. It's always hard to know if and when such a change in sentiment might occur. But it is more likely to do so when the fundamental determinants of investment are in place. The ready availability of internal and external finance, at very low cost, is one element of that. The stronger growth of demand across the non-mining parts of the economy over the past year or so is another. If history is any guide, eventually the period of elevated risk aversion is likely to give way to a concern among businesses, not of losses, but of lost opportunities and a loss of market share.
Endnotes
I thank Lara Bui, Natasha Cassidy, Bernadette Donovan, Stephen Elias, Craig Evans, Gianni La Cava, Kevin Lane and Tom Rosewall for help in preparing these remarks. [*]
It is worth noting that the period of weak non-mining investment up to 2012, and non-mining activity more generally, allowed for the unprecedented mining investment boom without leading to excess aggregate demand and all of the problems associated with that. [1]
The poor performance of Tobin's Q models is quite common in the literature. For a discussion of some of the problems, see Chirinko R (1993), ‘Business Fixed Investment Spending: Modeling Strategies, Empirical Results and Policy Implications’, Journal of Economic Literature, 31(4), pp 1875–1911. For a more recent discussion, see Roberts M and T Whited (2013), ‘Endogeneity in Empirical Corporate Finance’, Chapter 7 in the Handbook of Economics of Finance, 2A, pp 493–572. The results of estimating these types of models on aggregate Australian data have been generally disappointing (for instance, see Cockerell L and S Pennings (2007), ‘Private Business Investment in Australia’, RBA Research Discussion Paper No 2007-09). Some studies that use firm-level data have had some success in modelling investment using the Q ratio, but even these results are sensitive to certain modelling choices (see, for example, La Cava G (2005), ‘Financial Constraints, the User Cost of Capital and Corporate Investment in Australia’, RBA Research Discussion Paper No 2005-12). [2]
For a detailed discussion of the difference between these concepts, see Haddow A, C Hare, J Hooley and T Shakir (2013), ‘Macroeconomic Uncertainty: What is It, How Can We Measure It and Why Does it Matter?’, Bank of England Quarterly Bulletin, 53(2), pp 100–109. [3]
The measure in the top panel of Graph 5 is the S&P-ASX ‘VIX Index’, which is based on option pricing data and measures expected levels of near-term volatility in the Australian equity market; it includes mining sector stocks. [4]
For details of the methodology, see Baker S, N Bloom and S Davis (2013), ‘Measuring Economic Policy Uncertainty’, unpublished manuscript, available at <policyuncertainty.com>. [5]
One thing that businesses often cite as a concern is uncertainty about various policies affecting different industries. It's hard to judge, though, the extent to which that source of uncertainty is greater today, if at all, than it was in the past. [6]
The saving rate has drifted down a little over the past couple of years, and the stronger growth of household credit of late suggests that there has been some pick-up in the appetite for risk among households. [7]
For a discussion of the experience of US firms, see Sharpe A and G Suarez (2014), ‘The Insensitivity of Investment to Interest Rates: Evidence from a Survey of CFOs’, Finance and Economics Discussion Series, Working Paper 2014-02. [8]
In a related vein, there is evidence that Australian listed companies have more risk-related meetings now than in the early 2000s. It's possible that this is a response to an increased compliance burden, though such a change may have reduced firms' appetites for risk nonetheless. (Special thanks to Gianni La Cava for suggesting this measure and to Lara Bui who painstakingly constructed it.) [9]
The survey needs to be adjusted for the fact that realised investment tends to vary predictably from what is initially expected by firms. There are various ways to do this. For forecasting purposes, the most reliable method is to adjust investment expectations by the average ‘realisation’ ratio over the full history of the survey; for details, see Berkelmans L and G Spence (2013), ‘Realisation Ratios in the Capital Expenditure Survey’, RBA Bulletin, December, pp 1–6. It is also worth noting that the Capex survey provides only a partial read on non-mining business investment because it excludes firms from a number of key industries, including agriculture, health care and education (which accounted for about 16 per cent of private non-mining business investment in 2012/13) and it excludes investment in intangible assets (which accounts for about 15 per cent of total private business investment). [10]