Speech Capital Flows and the Australian Dollar

Guy Debelle
[*]
Assistant Governor (Financial Markets)
Speech to the Financial Services Institute of Australia
Adelaide –
- Audio 25.18MB
- Q&A Transcript
The Australian economy has been a net recipient of capital inflows from the rest of the world for almost all of its history. These net capital inflows – or the difference between foreign investment in Australia and Australian investment abroad – are the financial counterpart to Australia's current account deficit. Put differently, investment in the Australian economy has consistently exceeded domestic saving and this gap has been funded from offshore.
As I, and others, have previously argued, Australia's current account deficit – and the associated capital inflows – is a good thing, not a bad thing.[1] Cross-border capital flows allow for a more efficient allocation of global capital and can confer large benefits. In Australia's case, foreign investment has been attracted by the favourable risk-adjusted returns on offer here and has helped to expand our domestic productive capacity. Most recently, this has been particularly evident in the role foreign investment has played in expanding the capacity of Australia's resources sector in order to meet growing demand for our bulk commodities – particularly from China.
Although net capital inflows have been a consistent feature of Australia's balance of payments, the composition of these capital inflows – and the gross inflows and outflows underlying them – has varied significantly over time. I talked about this a little while ago,[2] but it is worth revisiting today as there have been a few significant changes since then and some others are in prospect.
So, today I will discuss some of these compositional changes in capital flows in more detail. I will also comment on some aspects of the relationship between these capital flows and the Australian dollar, although this is not straightforward. At a basic level, net capital inflows can be thought of as representing the appetite of foreign investors to purchase Australian dollar assets and the exchange rate is the price which adjusts so that they are willing to do this and maintain that exposure.
I will conclude with a few observations on the outlook for Australian capital flows.
Recent Developments in Australian Capital Flows
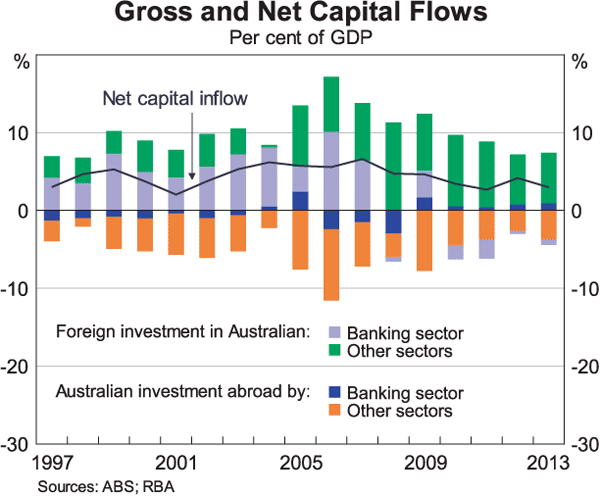
In the decade prior to 2007, the net inflow of capital to the Australian economy averaged around 5 per cent of GDP and peaked at almost 7 per cent of GDP just prior to the onset of the financial crisis (Graph 1). Since then, net capital inflows have declined to be under 3 per cent of GDP currently.
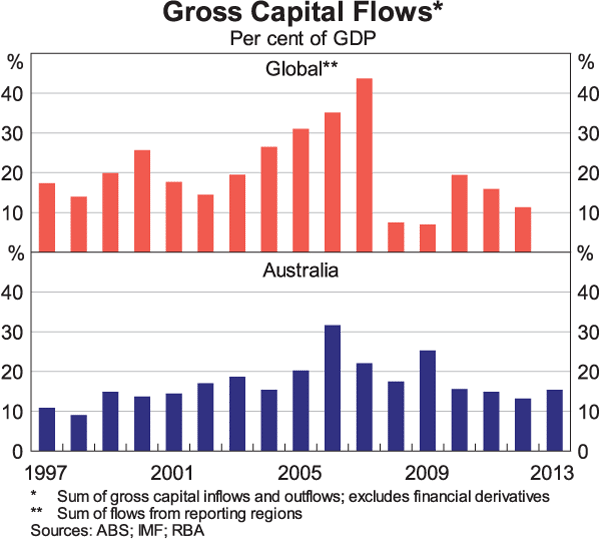
This decline in net inflows has coincided with a marked reduction in gross capital flows from their pre-crisis levels. This is not unique to Australia but is evident globally where cross-border flows are considerably lower than they were pre-crisis (Graph 2). Gross foreign investment in Australia has fallen from around 17 per cent of GDP in 2006 to around 6 per cent of GDP currently, while Australian investment abroad has fallen from 12 per cent of GDP to about 3 per cent over the same period.
As well as the decline in gross flows, there have been three notable changes in their composition:
- The flows to the Australian banking sector have gone from sizeable net inflows pre-crisis to around zero, and even small net outflows, in recent years.
- A marked increase in foreign direct investment inflows, particularly to the resources sector.
- A sizeable increase in foreigners' purchases of Australian government debt.
I will discuss each of these in turn.
Net capital inflows to the banking sector averaged around 5½ per cent of GDP in the decade preceding the financial crisis, but have subsequently averaged close to zero (Table 1). This reflects two main factors. The first is a shift in the composition of banks' funding. The onset of the global financial crisis led to a reassessment of the perceived risks associated with different types of funding and has seen banks shift their funding base towards domestic deposits and away from wholesale debt.[3] This development does not reflect a lack of appetite for Australian bank paper, as banks' cost of issuance has generally declined over recent years to be currently not far from pre-crisis spreads. The second factor is a reduction in loan asset growth over recent years relative to its pre-crisis levels, that is, credit growth has been slower.
| Average over: | ||
|---|---|---|
| 1998–2007 | 2008–2013 | |
| Private sector | 5.0 | 1.7 |
| Banks** | 5.4 | −0.2 |
| Other financials | −2.0 | −2.0 |
| Non-financials | 1.6 | 3.8 |
| – Resources sector | n/a | 1.6 |
| Public sector | −0.1 | 2.1 |
|
(*) Excluding households and the RBA Sources: ABS; RBA |
||
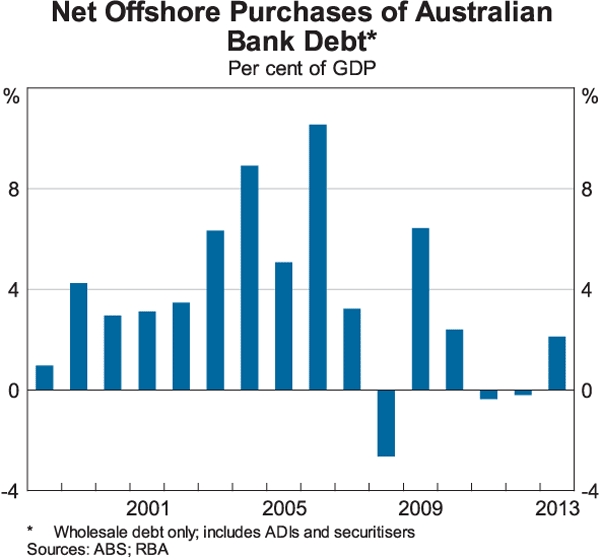
As a result, banks have scaled back the pace of offshore debt issuance, with net wholesale debt issuance averaging 1–2 per cent of GDP over 2008–2013 compared with average net debt issuance equivalent to about 5 per cent of GDP over the previous 10 years (Graph 3).[4]
The slowdown in credit growth post-crisis has been particularly evident in the low growth of lending to businesses. This is related to the second key development in the composition of Australian capital flows over recent years: an increase in net capital inflows directly to the corporate sector, rather than the funding being intermediated by the banking sector. Net inflows to private non-financial businesses have stepped up from an average of around 1½ per cent of annual GDP in the 10 years prior to the global financial crisis to around 4 per cent of annual GDP in the post-2007 period.
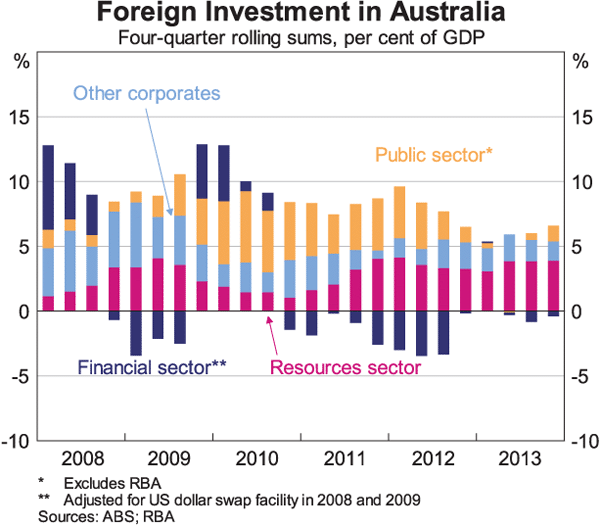
Investment in the resources sector has been the important driver of this shift. Since 2011, around 70 per cent of foreign investment in the Australian private non-financial sector has been directed to the resources sector (Graph 4). As outlined in previous RBA work on the topic, a significant share of the very large increase in investment in resource projects has been funded through foreign direct investment in the form of retained earnings.[5] To the extent that resource companies have also used external funding sources, they have generally accessed offshore debt markets directly, rather than obtain funds through the domestic banking sector.[6]
The third key development has been an increase in net capital inflows to the public sector, reflecting an increase in foreign holdings of Australian Commonwealth government debt over recent years. Gross inflows to the public sector have risen from an average of close to zero in the decade prior to the crisis to around 2½ per cent of GDP, on average, over the 2008–2013 period. The increase in foreign purchases of Australian government debt has seen the foreign ownership share of the stock of Commonwealth Government securities (CGS) increase from 50 per cent in the early 2000s to be just under 70 per cent currently, even as the stock of issuance has risen fivefold (Graph 5). At the same time, there have also been smaller net foreign purchases of Australian state government debt. But these purchases have not kept pace with net issuance by the states, resulting in the foreign ownership share of state government debt declining from around 45 per cent in 2008, to around 30 per cent currently.
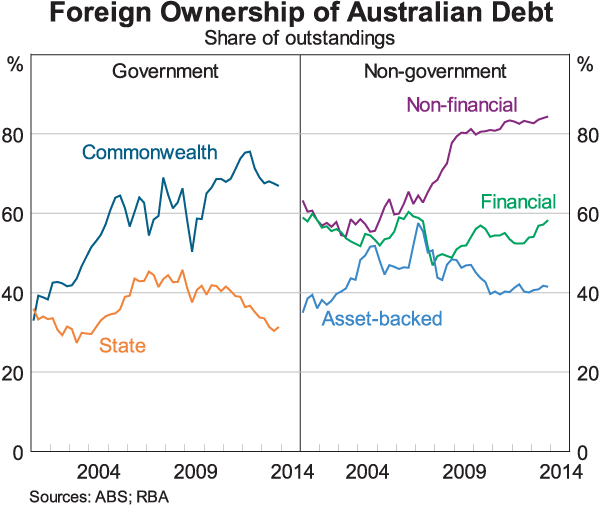
The increased foreign investment in Australian national government debt appears to have been underpinned by increased ‘official’ holdings of Australian assets by foreign reserve managers, including central banks. I say ‘appears’ because we don't have any particularly concrete evidence of this. The ABS statistics do not break down the holders of Australian government debt. However, our analysis of information published by some of these sovereign asset managers suggests this is the case. This evidence is far from complete, however.
With yields on Australian government debt remaining relatively high compared to a range of alternative reserve assets, and the Australian government maintaining its AAA credit rating, asset managers appear to have regarded the risk-return trade-off and diversification benefits associated with holding Australian government debt increasingly favourably. But while the foreign ownership share of Australian government debt remains historically high, the Australian dollar share of global reserve holdings is modest at less than 2 per cent on average (for those central banks for whom information on the currency denomination of their reserve assets is known).
My general sense is that the bulk of sovereign asset managers now have Australian dollar assets as part of their portfolios, so there are not many new buyers left to emerge. The main chunk of diversification occurred through 2010 to 2012, although demand has remained robust since then.
These changes in the composition of Australia's capital inflows have been reflected in changes in the composition of the stock of Australia's foreign assets and – most notably – in the composition of the stock of Australia's foreign liabilities (Graph 6). In particular, between December 2007 and December 2013, the banking sector's gross foreign debt liabilities have fallen by the equivalent of around 10 percentage points of GDP to around 55 per cent. Meanwhile, the public sector's gross foreign debt liabilities have more than doubled as a share of GDP over this period (and are currently equivalent to around 20 per cent of GDP). The stock of private non-financial sector liabilities has increased by the equivalent of around 4 percentage points of GDP over this period to be currently equivalent to about 70 per cent of GDP.
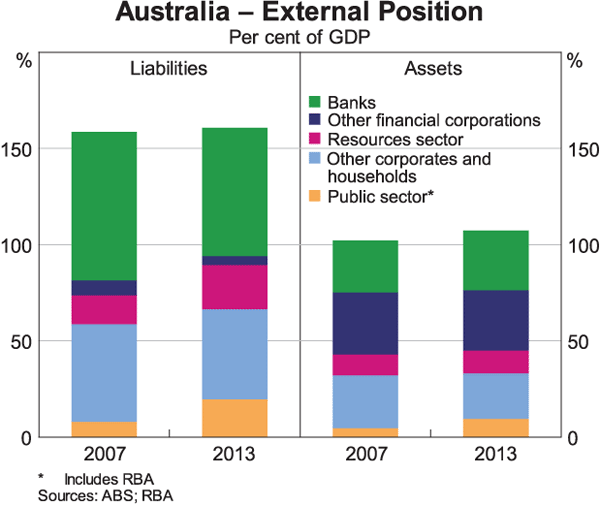
These changes in the sectoral composition of Australia's foreign liabilities have occurred even though in overall magnitude, Australia's net liability position has been broadly unchanged at around 55 per cent of GDP since 2007 (Graph 7). There has also been an increase in the share of net long-term debt liabilities and a corresponding decline in the share of net short-term liabilities, consistent both with the lengthening in the average tenor of banks' debt liabilities and the shift from bank debt to public debt (public debt has a longer average tenor than bank debt).[7]
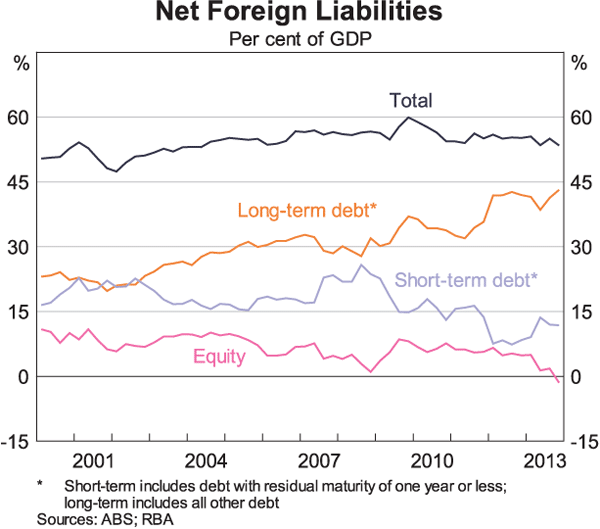
Australia's net equity liability position has declined slightly as a share of GDP since 2007 and, in the December quarter last year, switched to a (small) net asset position for the first time since the series began. That is, Australians now own more equity investments offshore than foreigners' own equity in Australia. The majority of this decline reflects valuation effects, rather than a marked decline or compositional change in net inflows of equity capital. Notably, Australian non-financial firms have continued to receive equity inflows, while Australian superannuation funds have continued to accumulate (large) holdings of foreign equities.
The change in the composition of the stock of foreign liabilities has had a noticeable impact on the net income deficit, which is the part of the current account deficit that measures the net cost of servicing these liabilities. The net income deficit has recently declined to around its lowest share of GDP in a number of decades. In part, this reflects the lower yields on government debt than on debt issued by the banking sector as well as the historically low level of interest rates both locally and globally at the moment.[8]
The Outlook for Capital Flows
Given that changes in gross inflows to the banking, resources and government sectors have had a significant influence on changes in the composition of Australian capital inflows over recent years, it is worth considering what factors might affect these flows in the future.
In terms of the banking sector, it seems unlikely that the pattern of capital flows will change materially any time soon. The banks are likely to continue with little net debt issuance in the period ahead; that is, only issuing enough debt to replace that maturing. To the extent that investment in the non-resources sector is more likely to be intermediated by the banking sector than resources sector investment, the RBA's forecast pick-up in investment in the non-resources sector might see some pick-up in business credit from its current low rate of growth. Even so, this would not require much of an increase in wholesale debt issuance given that deposit growth continues to outstrip lending growth by a few percentage points.
Turning to the resources sector, the investment phase of the resource boom has peaked, and a number of resource projects are moving into the production phase. As foreign investors have played a large part in the financing of this investment, a move to the production phase should result in reduced capital inflows. At the same time, the increase in resource export volumes should increase the resources sector's export revenue. The combination of higher revenues and lower capital expenditure outlays could be expected to lead to an increase in resources sector profits and, particularly, an increase in the share of these profits that are paid out as dividends to investors. Given that the resources sector is largely foreign-owned, this would be accompanied by an increase in dividend payments to foreign investors (an outflow on the net income component of the current account).
Although the resources sector's transition from investment to production will likely result in a reduction in net capital inflows to the sector, the effect on the Australian dollar is more nuanced. While capital inflows to the resources sector may be expected to fall (and thus reduce demand for Australian dollars), this will also be associated with declining imports to the sector, as resource investment has relied heavily on imported capital and labour. Moreover, the balance of payments records these notional foreign direct investment flows as capital inflows (and imports on the current account) even though the respective flows may have been predominantly in US dollars. The (still substantial) part of the capital inflow that represented an actual transaction in Australian dollars was that needed to pay for their workforce in Australia and the often small share of the assembly done locally.
Additionally, to the extent that resource firms' revenues are primarily denominated in US dollars and their shareholder base chooses to be paid dividends denominated in US dollars, these flows will have no net direct influence on the exchange rate. Only those flows needed to pay for the operations in Australia, to pay dividends to the Australian shareholder base and taxes to the Australian Government will result in purchases of Australian dollars. The net result of all of this is that we might expect to see reduced capital flows and reduced demand for Australian dollars as the resources sector moves into the production phase.
Finally, on the outlook for investment inflows to the public sector, while the foreign ownership share of Australian government debt has declined somewhat from its peak, it remains at a historically high level. Sovereign investors tend to be relatively slow to change their portfolio allocations. Hence we might expect these holdings to be relatively sticky. Recent capital inflows to the sector suggest that demand for Australian government debt remains robust. The extent of any additional purchases will depend in part on the extent of further foreign exchange reserve accumulation by other central banks.
One source of potential additional demand for government securities is from Japanese investors, who have historically held sizeable shares of Australian government debt. While there is limited evidence to date that the program of quantitative easing in Japan has encouraged investors to substantially increase their purchases of other countries' assets, the most recent data suggest that demand for Australian debt from Japanese investors has started to pick up.
Notwithstanding the possibility of these flows from Japan, the net implication of these developments is that one might expect to see reduced capital inflows in the period ahead, with the possibility of a consequent further decline in the Australian dollar. This would help in achieving balanced growth in the economy. That said, the ability of economists to forecast exchange rate movements is notoriously poor, but at least this might give you some idea of some of the dynamics at play in the period ahead.
Concluding Remarks
To conclude, the main purpose of my speech today has been to run you through some of the notable changes in the composition of capital flows into Australia that have taken place over the past seven years or so and indicate how they might evolve in the period ahead. The major developments have been firstly, a marked reduction of net offshore debt issuance by the Australian banking sector; a trend which may be expected to continue for a while yet. Secondly, there has been a sizeable capital inflow (at least notionally) to fund the resources investment boom. As that investment boom is now transitioning into the production and export phase, these capital inflows may be expected to decline and their composition change. The third main development has been a marked increase in foreign holdings of Australian government debt. While this might not increase much further from here, nor is it likely to decline anytime soon.
Endnotes
Thanks to Anthony Rush, Michelle Wright and Mark Wyrzykowski in the preparation of this speech. [*]
For a more detailed discussion, see Debelle G (2011), ‘In Defence of Current Account Deficits’, Address at ADBI/UniSA Workshop on Growth and Integration in Asia, Adelaide, 8 July. [1]
See Debelle G (2013), ‘Funding the Resources Investment Boom’, Address to the Melbourne Institute Public Economic Forum, Canberra, 16 April. [2]
For a more in-depth discussion of developments in banks' funding, see Stewart C, B Robertson and A Heath (2013), ‘Trends in the Funding and Lending Behaviour of Australian Banks’, RBA Research Discussion Paper No 2013-15. [3]
The Australian banking sector also continues to raise short-term debt offshore, including through US money market funds as well as foreign currency deposits from customers including foreign central banks. In part, this reflects the fact that Australian banks have higher credit ratings than most other banks, proving attractive to customers whose mandates are rating constrained. Another contributing factor is that the Australian banking sector can raise US dollar deposits from customers who do not have direct access to the US Federal Reserve and then deposit the funds at the Fed and earn the (small) spread. One might expect this activity to decline when US interest rates move away from zero. [4]
Arsov I, B Shanahan and T Williams (2013), ‘Funding the Australian Resources Investment Boom’, RBA Bulletin, March, pp 51–61. [5]
As I have previously discussed, a part of the reason for this preference is that a number of these resource companies have been able to access debt markets more cheaply than the banks themselves. See Debelle G (2013), ‘Funding the Resources Investment Boom’, Address to the Melbourne Institute Public Economic Forum, Canberra, 16 April. [6]
Debelle G (2014), ‘The Australian Bond Market’, Speech to the Economic Society of Australia, Canberra, 15 April. [7]
These developments are discussed in Ma S (forthcoming), ‘Why has the Net Income Deficit Narrowed?’, RBA Bulletin, June. [8]