Speech The Role of the RBA's Business Liaison Program

Alexandra Heath[*]
Head of Economic Analysis Department
Urban Development Institute of Australia (WA Division Incorporated) Luncheon
Perth –
Introduction
It is a great pleasure to be in Perth and to have the opportunity to talk about the role of our business liaison program in the formulation of monetary policy. As you can imagine, we spend a lot of time analysing a lot of data from a lot of different sources. We think that the information we have collected from businesses across Australia through our state offices in Adelaide, Brisbane, Melbourne and Perth and from our Head Office in Sydney has been a valuable part of that process.
To start with, I'm going to say a few general words about the business liaison program and its contribution to the process of understanding economic developments. Then I will highlight four areas where we have found information from the liaison program particularly useful for understanding recent economic developments. The first area is the evolution of the mining investment cycle. The second is the responsiveness of the construction sector to changes in interest rates and whether this has changed over time. I'm sure there will be members of this audience who have been asked questions related to this as a part of our liaison program in Perth. The third area is non-mining business investment and understanding why it has not picked up and finally, I will talk a bit about how the liaison program has helped us to understand developments in the labour market.
The Business Liaison Program
The Reserve Bank has a team of around 15 economists in the business liaison program and a number of support staff in its offices around the country.[1] Their role is to represent the Bank in different states and to talk to local businesses about the conditions they are facing. Most businesses are asked a standard set of questions about how they see demand, employment and pricing for their company and for their industry. We also ask a variety of questions designed to obtain information on topics of particular interest to us. Each state office meets with a broad range of businesses from across all industries, public organisations and community groups to gain a balanced read on current conditions.
We think there are several benefits to having a liaison program:
- First, we collect information that complements what we receive from other sources. It can be very valuable to have an independent source of information, particularly if published data are sending conflicting or noisy messages. In addition, the liaison program can provide more timely data. For example, it is possible to talk to liaison contacts about the economic impact of natural disasters, such as floods and cyclones, almost immediately, whereas it can take weeks, if not months to get this information from official data sources.
- The second benefit is that having conversations with individual firms allows us to get a more nuanced view of the economy. For example, the aggregate statistics tell us that there is a structural decline in the manufacturing sector, but the liaison program tells us that while this is true for some parts of the manufacturing sector, there are some areas where manufacturing firms have been very successful. More generally, the liaison program helps Bank staff understand how each industry is structured and how businesses are responding to the challenges and opportunities faced by their industry. This sort of information can be helpful for spotting emerging trends, and can flag potential risks to our forecasts in a timely way.
- Finally and relatedly, discussions with liaison contacts allow us to get deeper insights into the factors driving economic developments. One of the best examples of this is the work the liaison team has done on the factors affecting investment decisions within firms that I will come back to in a few minutes.
To put all this in more concrete terms, I will now highlight four examples of how liaison is informing the Bank's current view on economic conditions.
The mining investment cycle
The mining investment cycle has been an important driver of economic developments in the Australian economy over the past decade. Through the 2000s, the increase in demand for commodities from emerging markets including China led to a significant increase in mining investment in resource-producing countries such as Australia. Mining investment as a share of GDP peaked at about 8 per cent of GDP. A bit before that time, commodity prices had started to fall as the investment in productive capacity translated into increased supply. More recent falls in commodity prices have also reflected the slowing in the growth of demand for commodities in China and other parts of east Asia.
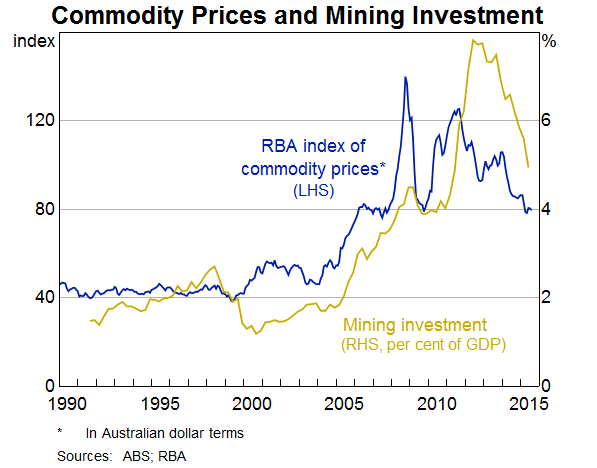
Liaison with resource producers and businesses supplying the mining industry with goods and services has provided us with a broad range of information that has helped the Bank effectively monitor the evolution of the mining boom and its impact on the rest of the economy. For example, liaison from our Western Australian Office has provided us with information about the extent to which mining investment uses imports rather than domestically produced goods and services. This has allowed us to make more informed judgements about the nature of the spillovers to the rest of the economy many years before these data were available from official sources. Liaison also provided us with quite accurate information about the timing and magnitude of the downturn in mining investment that significantly improved our forecasts.
The transition from the investment to the production phase of the mining boom is one of the important drivers of developments in the domestic economy today. I don't need to tell an audience in Perth about the impact the declines in mining investment and commodity prices are having on economic activity.
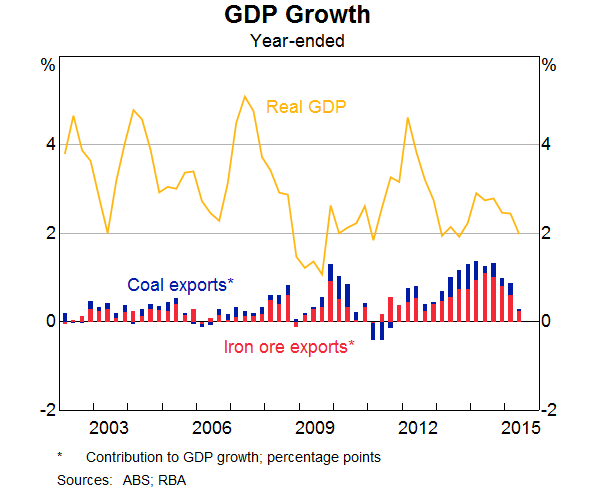
Export volumes have grown strongly as the production capacity created by the mining investment boom has ramped up, but GDP growth has been below average since mining investment peaked in late 2012 and the unemployment rate started to increase around this time. These circumstances have contributed to the Reserve Bank Board's decisions to lower interest rates over recent years.
How responsive is construction activity to lower interest rates?
An important part of our task in providing policy advice has been to understand how responsive the non-mining economy is likely to be to these lower interest rates. The housing construction sector has traditionally been the most interest-sensitive sector of the Australian economy. Lower interest rates have led to higher housing prices, which have provided an incentive to build more housing.[2] This is the transmission mechanism of monetary policy in action.
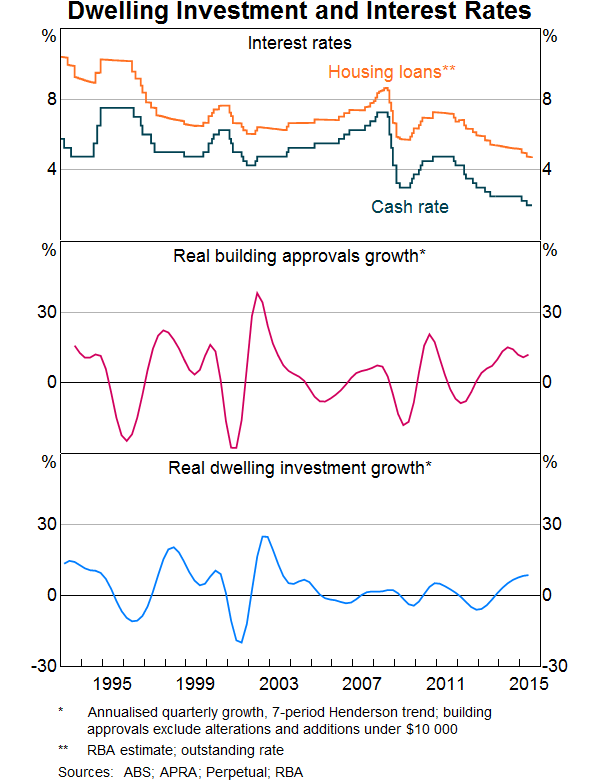
However, if there are constraints on the ability to start new building projects in market segments where demand is strong, either because there are shortages of suitable land or it is difficult to find labour or materials, lowering interest rates could lead to excessive risk taking without much benefit in the form of an increase in actual housing investment.
While there is a lot of information available on the housing sector from official ABS data and other published sources, the liaison program has been particularly helpful for providing information on the ability of the housing sector to respond to upswings in housing demand in a timely manner. Liaison contacts in the building industry, which include builders, renovators, land developers, real estate agents, architects, valuers and legal firms are able to provide us with detailed information from a variety of perspectives. These liaison contacts have pointed to a range of supply-side issues in the Australian housing market. These include the length and complexity of the planning process; issues related to the provision and funding of infrastructure, land ownership and geographic constraints; and other challenges related to infill development.[3]
Unsurprisingly, the degree to which these constraints are present varies across different locations, and liaison also helps us to understand these differences. We know, for example, that the availability of land with the appropriate infrastructure is an issue in Sydney and in some parts of South East Queensland, while the availability of land in Perth has increased.
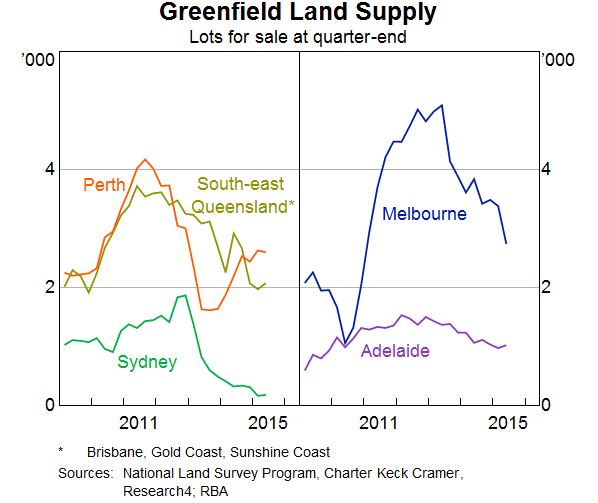
Some liaison contacts have also raised concerns about the availability of land for apartment developments in Sydney, as the stock of suitable sites has been gradually depleted over recent years. Liaison contacts suggest this has not been such an issue in Melbourne and other capitals, which helps to explain some of the differences we have seen in price growth for detached houses and apartments across different capitals.

Liaison has also provided us with valuable information on the availability of suitably skilled labour in the construction industry. The consensus appears to be that aside from a few specific skills, such as bricklaying, there have been relatively few skill shortages given the size of the pick-up in housing construction. A part of the explanation appears to be that many people leaving the mining sector have skills that have made it possible for them to find jobs in the construction industry.
What factors are holding back non-mining investment?
While growth of activity in the household sector, which includes both housing investment and consumption, has picked up over the past couple of years, non-mining business investment has basically been unchanged for several years. In addition, leading indicators of investment intentions from sources such as the ABS's capital expenditure survey suggest that non-mining business investment is not likely to pick up over the next year or so. We have been flagging this as a significant risk to our growth forecasts for some time.
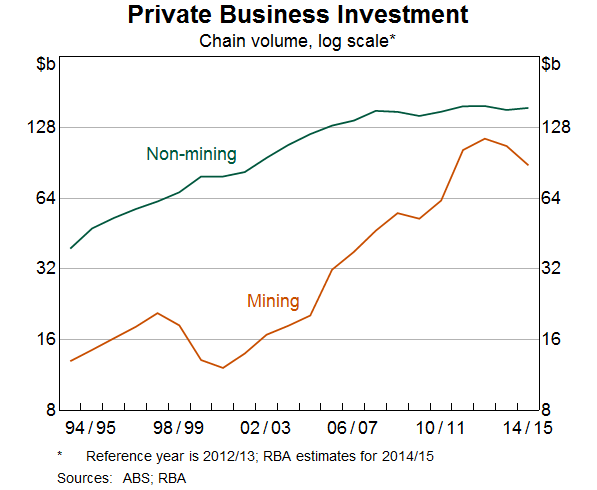
When we ask our liaison contacts why they are not planning to increase their investment, they say things like: ‘there is sufficient capacity to meet current levels of demand’; ‘we are not sufficiently confident that there will be a sustained pick-up in demand from the household sector or overseas to justify the risk of further investment’; and ‘business conditions are too uncertain’. Liaison contacts do not report that current levels of interest rates are discouraging them from investing, but neither do they typically indicate that the current low levels of interest rates are directly encouraging them to invest more.
Given the importance of understanding why non-mining business investment has not picked up, our liaison team have spent some time delving further into the question of how firms make their investment decisions.[4] This exercise has suggested that a typical firm in the Bank's liaison program evaluates discretionary capital expenditure using a variety of methods including discounted cash flow analysis. To proceed with a given project, its expected return must exceed the firm's hurdle rate. The hurdle rates liaison contacts typically use are often several percentage points above the estimated cost of capital.
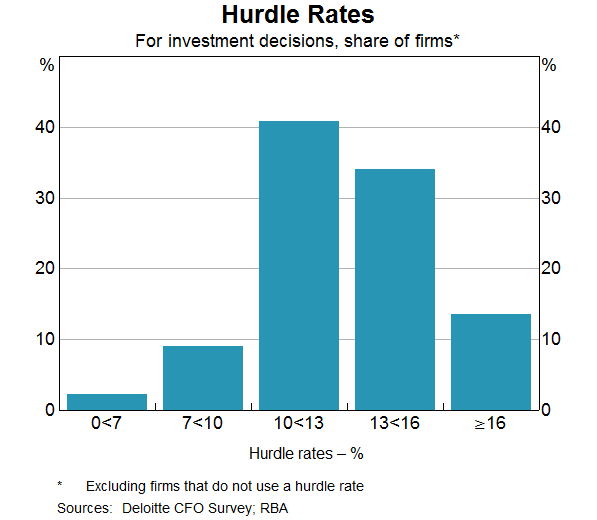
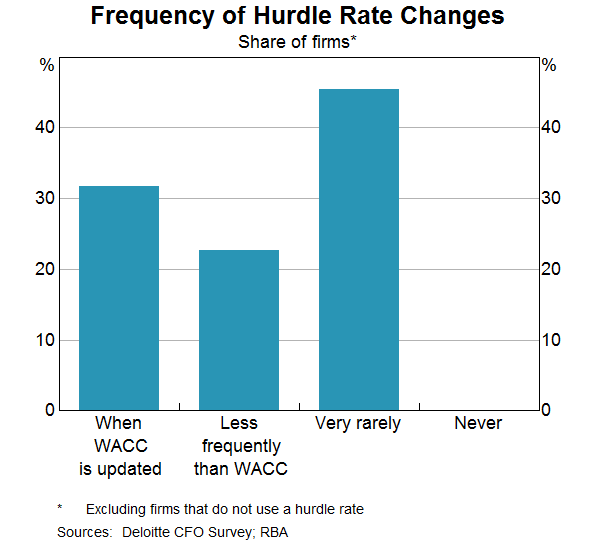
Some contacts have said that they have lowered their hurdle rates in recent times, but many also report that their hurdle rates are not changed very often and in some cases have not been altered for several years, which is a bit of a surprise given that interest rates, and therefore the cost of capital, have fallen significantly. This behaviour has also been noted in the academic literature, other surveys of Australian businesses and in other countries. This suggests that many businesses do not calculate hurdle rates as a fixed mark-up over the cost of capital. When asked, liaison contacts have indicated that hurdle rates may not be sensitive to changes in the cost of capital because the true cost of capital is unobserved and therefore uncertain. Another explanation contacts give is that changes in interest rates are often temporary.[5]
Liaison suggests that firms also evaluate investment decisions with reference to the payback period, which is the number of years it would take for the cash flows generated by the project to cover the capital outlay. Maximum payback periods are often fairly short, say around three years, implying high required rates of return for a given capital outlay. Use of this method partly reflects the premium contacts place on recouping cash. Some firms also report that they use the payback period to help refine the shortlist of potential projects because they only have appetite to invest in a certain amount or in a certain number of projects. In this case, shorter payback periods favour projects with front-loaded returns, and it is understood that there will be value-creating projects that are not pursued.
In summary, discussions with liaison contacts indicate that the process of making investment decisions is more complicated than textbooks suggest and that the explanations for why non-mining investment has not picked up are not likely to be simple.
Why has wage growth been so low?
Earlier in the year, the Bank had expected that the unemployment rate would rise further given that economic growth appeared to be below trend. However, the labour force data indicate that the unemployment rate has since stabilised in a range of between 6 and 6¼ per cent. Economic theory gave us clues about where to look for an explanation for this apparent inconsistency, but once again, the liaison program provided us with evidence that helped to distinguish between competing explanations and led us to revise our forecasts for the unemployment rate.[6] We now expect that the unemployment rate will remain roughly stable until growth in the economy picks up significantly from its current pace.
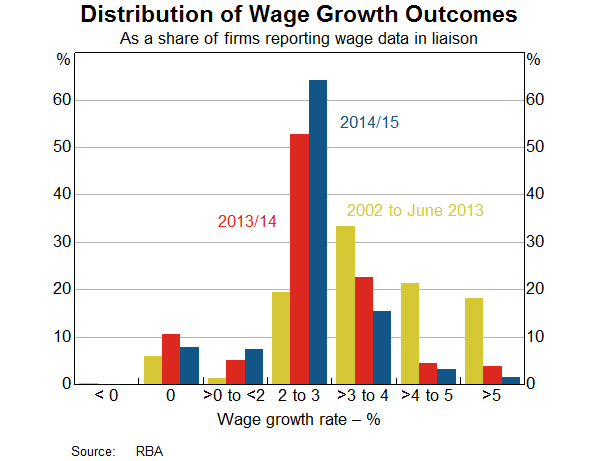
An important part of reconciling the ability of the labour market to improve with below-average growth is that wage growth has declined markedly across most industries.[7] Economics tells us that when the unemployment rate is above its natural rate, there should be downward pressure on wage growth. However, the decline in wage growth since 2012 is larger than the historical relationships would predict.
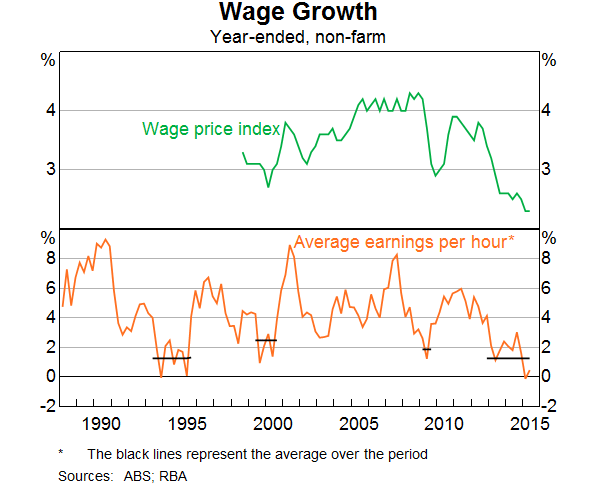
Liaison tells us that wages are playing a more significant role in the adjustment of the economy to the lower terms of trade and the transition from the investment to the production phase of the mining boom than they have in previous episodes of structural adjustment. For example, the recent emphasis on cost cutting in the mining sector has led to job losses, but there are also many examples of mining and mining service firms negotiating lower wage outcomes with existing workers and employing new workers on significantly lower wages to help keep mining operations open in the face of significantly lower commodity prices.
Liaison also suggests that, unlike previous episodes, many of the workers employed in the investment phase of the mining boom had previous experience in the civil and residential construction sectors,[8] and therefore have more transferable skills than workers who became unemployed during previous periods of structural change. This has enabled them to find alternative jobs (often at lower wage rates). While the increase in available labour supply may go some way toward explaining why wage growth has been lower in some industries such as construction, it does not explain the generalised decline in wage growth across all industries.
The fact that near-term inflation expectations have also fallen can provide some further reconciliation. Surveys of households and unions, and financial market measures of near-term inflation expectations have been below their inflation-targeting averages in recent times, although longer-term inflation expectations have not changed significantly. Some liaison contacts have also reported that inflation benchmarks applied in wage negotiations have been a little lower than over the past few years.
Another factor that might explain the prevalence of lower wage growth across industries is that employees appear to have been particularly concerned about their employment prospects. This message comes through clearly from household surveys as well as discussions with liaison contacts. This suggests that employees have also been more willing to accept lower wage growth because they are concerned about their prospects for re-employment should they lose their jobs.

Reports from the Bank's liaison program indicate that although wage growth has fallen, there is reluctance among many firms and employees to bargain for wage growth below expected inflation. Outcomes lower than this, which would imply a fall in real consumer wages, are generally seen to have a negative effect on worker morale and productivity, as well as on the retention of quality staff. So while the decline in wage growth has been large, it might have been larger still if not for this element of rigidity in real wage growth.
Conclusion
These examples help to illustrate how valuable the business liaison program is to the Bank's understanding of the economy. The information we receive from businesses is particularly useful for understanding how the economy is adjusting to significant structural changes associated with falling mining investment and commodity prices. We have a dedicated team of economists putting a lot of time and effort into talking to businesses and asking them questions that are relevant to current policy considerations, but clearly the value of the program also comes from the time and effort businesses put into the process. We are very appreciative of this and look forward to continuing to build on the relationships we have with our liaison contacts in the future.
Endnotes
I would like to thank the members of the regional and industry liaison team who have contributed to the analysis I have drawn on for this speech and particularly to Owen Bailey in the Western Australian Office for his assistance with pulling all the pieces together. [*]
This section of my talk draws extensively from RBA (2014), ‘The RBA's Business Liaison Program’, RBA Bulletin, September 2014, pp 1–5. [1]
For more information on the responsiveness of housing construction to lower interest rates, see RBA (2015), ‘Box C: The Cycle in Dwelling Investment’, Statement on Monetary Policy, May 2015, pp 43–45. [2]
See Hsieh W, D Norman and D Orsmond (2012), ‘Supply-side Issues in the Housing Sector’, RBA Bulletin, September 2012, pp 11–19. [3]
For more details, see Lane K and T Rosewall (2015), ‘Firms' Investment Decisions and Interest Rates’, RBA Bulletin, June 2015, pp 1–7. [4]
Liaison contacts have provided several other reasons why the hurdle rate may not be sensitive to the change in the cost of capital, including: 1) a constant hurdle rate acts as an automatic time-varying risk adjustment; 2) changes in the hurdle rate may send the wrong message to staff proposing projects about the overall risk tolerance of the firm; and 3) changes in the hurdle rate require board approval, which introduces stickiness. For a more detailed discussion, see Lane K and T Rosewall (2015), ‘Firms' Investment Decisions and Interest Rates’, RBA Bulletin, June 2015, pp 1–7. [5]
Other important factors were a shift in economic activity towards more labour-intensive industries and the downward revision to population growth. While much of the downward revision was due to fewer people coming to Australia for work (particularly New Zealanders), the number of student visa holders also did not increase to the extent expected. Our liaison with the tertiary education sector had flagged this downside risk to the student visa immigration numbers that was realised in the latest revision to the population projections from the Department for Immigration and Border Protection. [6]
For a discussion of the factors behind the decline in Australian wage growth, see Jacobs D and A Rush (2015), ‘Why is Wage Growth So Low?’, RBA Bulletin, June 2015, pp 9–18. [7]
For more details on the movement of workers during the mining boom, see Doyle M-A (2014), ‘Labour Movements during the Resources Boom’, RBA Bulletin, December 2014, pp 7–16. [8]