Speech Securitisation and the Housing Market

Christopher Kent[*]
Assistant Governor (Financial Markets)
Address to the Australian Securitisation Forum Conference
Sydney –
Introduction
Good afternoon, and thank you to the Australian Securitisation Forum for their invitation. It's a pleasure to be here.
Today I'll provide an update on developments in the markets for housing and housing credit. These markets are closely related and both are of considerable interest to those that issue and those that invest in Australian residential mortgage-backed securities (RMBS).
Along the way, I'll make use of data on residential mortgages from RMBS that are eligible for repurchase operations with the Reserve Bank.[1] Among other things, these data are a useful source of timely information on interest rates actually paid, loan by loan. As I'll demonstrate, this allows us to infer something about shifts in the supply of, and demand for, housing credit, thereby shedding some light on the different forces driving these markets.
With this background in mind, I'll also review some recent developments in the RMBS market. And I'll finish by taking the opportunity to emphasise that RMBS issuers and investors should be prepared for any future changes in the use and availability of benchmark interest rates.
Interactions between the housing market and the market for housing credit
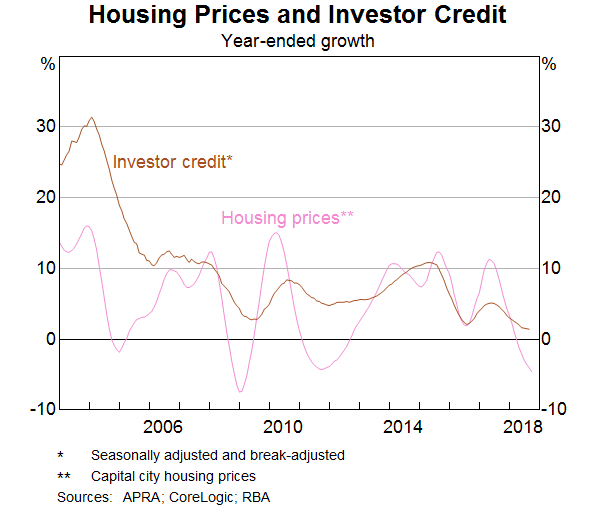
As highlighted recently in a speech by the Deputy Governor, the markets for housing and housing credit are going through a period of significant adjustment.[2] After years of strong growth, housing prices have been declining nationally, driven by falls in Melbourne and Sydney over the past year. Also, there has been a noticeable decline in investor credit growth and an easing in owner-occupier credit growth. The cycles in the growth of overall housing prices and investor credit have moved together quite closely over the past few years (Graph 1).
Underpinning these changes, there have been shifts in the demand for, and supply of housing, as well as in the demand for, and supply of, housing credit.
Credit supply affecting housing demand
The links between these two markets run in both directions, from housing credit to the housing market, and from the housing market to housing credit. Of late, the story more commonly told, though, is that a tightening in the supply of credit over recent years has impinged on the demand for housing.
This story is certainly the more apparent one in terms of its causes and effects. In particular, the measures implemented by regulators over recent years to address the risks associated with some forms of housing lending have worked to mitigate those risks and they have also led to a noticeable slowing of investor credit. This, in turn, has contributed to a decline in the demand for housing.
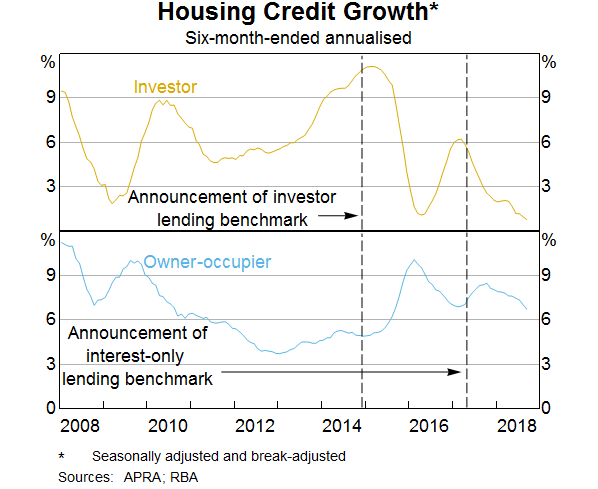
Again, these links have been discussed by Guy Debelle and are well-documented in the Bank's latest Financial Stability Review (FSR).[3] In late 2014, the Australian Prudential Regulation Authority (APRA) set a benchmark for investor lending growth at each bank of no more than 10 per cent per annum (Graph 2).[4] Then in March 2017, APRA announced it would require interest-only loans – which are disproportionately used by investors – to be less than 30 per cent of each bank's new lending. Over the same period, several other measures were implemented, including to tighten up the ways in which banks assessed the ability of borrowers to service their loans, and to limit the share of loans that constituted a large portion of the value of the property being purchased.
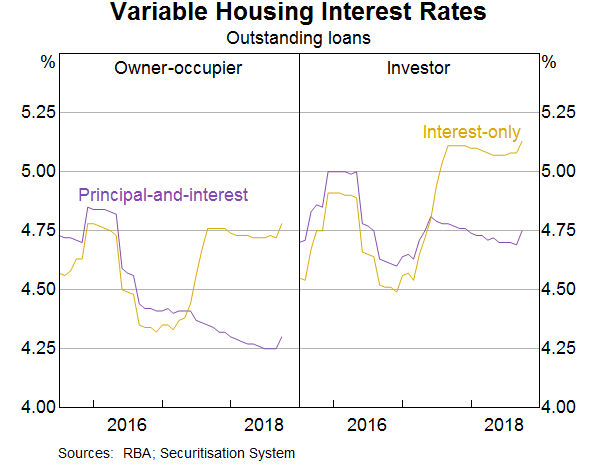
Banks responded to these requirements in two key ways. First, for some years now they have been tightening lending standards, thereby reducing the availability of credit to higher-risk borrowers. Second, banks raised interest rates for new and existing borrowers, first on investor loans from 2015, and then on interest-only loans in 2017 (Graph 3). In other words, the banks tightened the supply of credit, most notably for investors.
The FSR presents estimates of the effect of APRA's first round of regulatory changes from late 2014. The key conclusions of that analysis are that, with the introduction of the 10 per cent investor credit growth benchmark:
- the composition of new lending shifted away from investors and towards owner-occupiers, with little change in overall housing loan growth;
- and housing prices have grown more slowly in regions with higher shares of investor-owned properties.
So, that's the story that emphasises the effect of prudential measures on the supply of credit. And, in turn, the effect of tighter credit supply on the demand for housing.
Housing market developments affecting investor demand
I now want to draw your attention to the story less often told about the important causal link going in the other direction. In particular, the correction in the housing market over the past year or so appears to have been impinging on the demand for credit.
There are a number of reasons for the ongoing adjustment in housing prices:
- the aforementioned reduction in the supply of credit;
- the large increase in the supply of new housing associated with the high levels of housing construction in Brisbane, Melbourne and Sydney;
- weaker demand from foreign buyers due to stricter enforcement of Chinese capital controls and various policy measures in Australia (many of which were implemented by various state governments) that have made it more costly for foreign residents to purchase and hold housing;
- and last, but by no means least, the very substantial growth in housing prices over a long period, which had pushed housing prices to record levels as a share of household incomes and raised the prospects for a correction.
In support of this last point, I note that housing prices in Melbourne and Sydney (which had increased by 55 and 75 per cent respectively since 2012) are currently experiencing larger declines than in Brisbane (where housing prices had risen 20 per cent from 2012 to the recent peak; Graph 4).[5] It is also worth noting that housing prices are currently rising in Adelaide and Hobart. In addition, in Melbourne and Sydney house prices had run up further than apartment prices, and it is now house prices that have declined the most.[6]
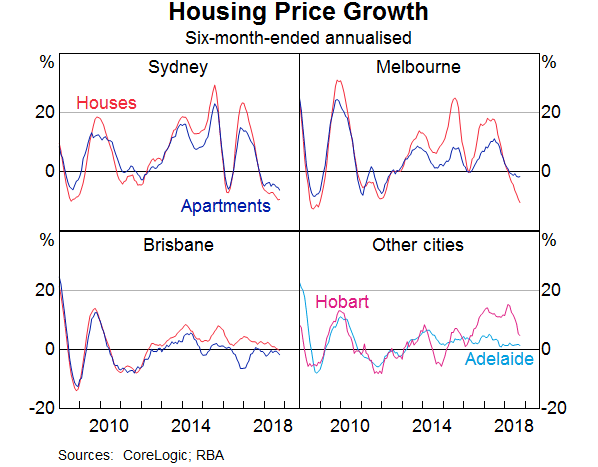
While there may have been numerous causal factors, after a period of slowing housing price growth, more recently it is clear that housing prices are in decline in a number of major markets. This dynamic would have weighed heavily on the minds of buyers; particularly investors whose only motivation for buying is the return on the asset. An expectation of even a modest capital loss provides a strong incentive for them to delay buying a property, particularly in an environment of relatively low rental yields.
But how can we assess the role of factors affecting credit supply versus those affecting credit demand? Changes in the price of credit – that is, interest rates – can help. Other things equal, a fall in the supply of credit relative to demand can be expected to be associated with higher interest rates on housing loans. In contrast, a fall in the demand for credit (relative to supply) should be associated with a decline in interest rates. Just to be clear, I'm talking about the credit supply and demand curves shifting inwards. The former, by itself, reduces quantities while prices rise as the equilibrium shifts up along the demand curve. The latter, by itself, reduces quantities but decreases prices as the equilibrium shifts down along the supply curve.
So what's happened to the interest rates borrowers are actually paying? The Securitisation Dataset provides estimates for both owner-occupiers and investors.
There has been a modest broad-based decline in outstanding mortgage rates in the Securitisation Dataset over the year to August (Graph 5). This suggests that banks were responding to weakness in credit demand by competing more vigorously to provide loans to high-quality borrowers. Indeed, looking just at new loans there is some evidence that average variable interest rates declined by more for investors than owner-occupiers, which is consistent with a noticeable decline in the demand for investor credit.
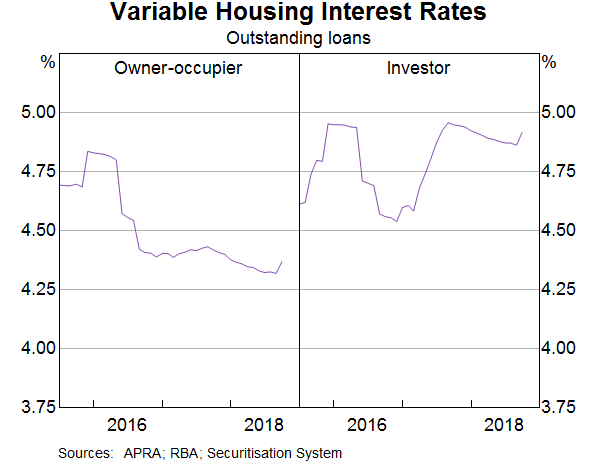
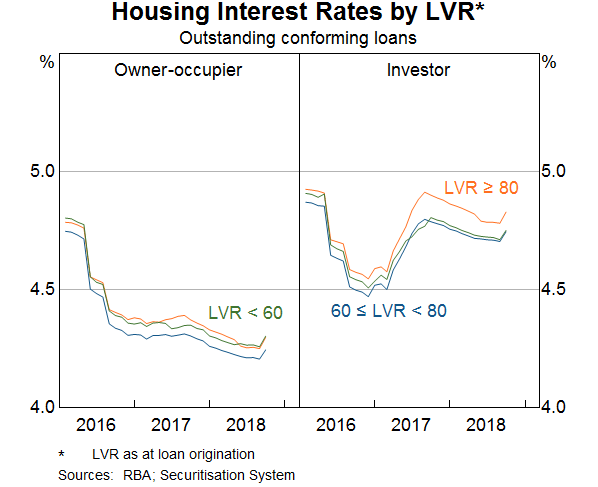
However, compositional changes might also explain why there was a slight decline in interest rates over this period. In particular, the tightening in lending standards has helped to shift the profile of loans away from higher-risk borrowers. This shift would have contributed to the decline in average interest rates paid as better quality borrowers tend to get loans at lower rates. However, it turns out that rates have declined over this period even within the set of low-risk borrowers – for example, those with low loan-to-valuation ratios (LVRs) (Graph 6). So the decline in average rates paid has been driven by factors other than just compositional changes.[7]
While banks began the process of tightening lending standards from around 2015, over the past year or so they have extended these efforts by applying greater rigour to their assessments of the ability of prospective borrowers to service loans. For example, banks have been assessing borrowers' expenditures more thoroughly, which is likely to have contributed to reductions in the maximum loan sizes offered to borrowers.[8] Notwithstanding these changes, there are two other pieces of evidence that suggest that factors other than just a tightening in constraints on the supply-side have been affecting housing credit and housing market developments over the past year or so:
- First, the majority of borrowers had earlier chosen to borrow much less than the maximum amounts offered by lenders. Hence, reductions in the sizes of maximum loans on offer over the past year does not imply one-for-one reduction in credit actually extended.[9]
- Second, given that owner-occupiers have lower incomes on average than investors, they are likely to have faced noticeable reductions in maximum loan sizes as a result of the recent tightening in serviceability practices. However, owner-occupier credit growth has remained notably higher than investor credit growth.
In summary, weakness in credit demand – stemming from the dynamics in the housing market – has been a significant development over the past year or so. This is not to say that ongoing weakness of credit supply has not also been at work since then, but that credit supply is not the only part of the story.
Broader developments in the securitisation market
So far I have focused on the prudentially regulated banks. While the non-banks still only account for a modest share of outstanding mortgages, the sector has experienced very strong growth over recent years and is an important source of competition for the banks.
The RMBS market is a major source of funding for the non-bank providers of residential mortgages, and so RMBS issuance provides an indication of the recent growth in this sector. Last year, RMBS issuance was at its highest level since the global financial crisis. Non-banks' issuance was in line with the high levels issued by this sector in the mid-2000s (Graph 7). In 2018, RMBS issuance in aggregate has been lower, but this has been largely been driven by decreased issuance by banks. Non-banks, by contrast, are continuing to issue close to $4 billion of RMBS per quarter.
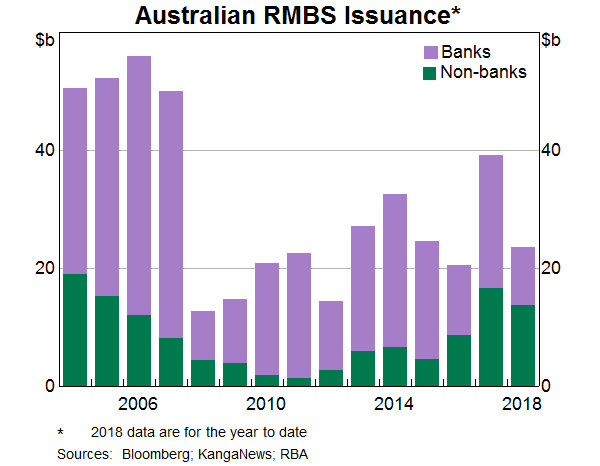
This high volume of RMBS issuance by non-banks is consistent with a sizeable increase in their mortgage lending. This is an unsurprising consequence of the tighter supervision and regulation of mortgage lending by banks. This is not to say that non-banks are unregulated. They operate under a licensing regime managed by the Australian Securities and Investments Commission. And, as my colleague Michele Bullock mentioned recently, the members of the Council of Financial Regulators (which includes the Reserve Bank, APRA and ASIC) are monitoring the growth of the non-bank lenders for possible emerging financial stability risks.[10]
The Reserve Bank's liaison indicates that non-banks have been lending to some borrowers who may otherwise have obtained credit from banks in the absence of the regulatory measures. Consistent with this, the Securitisation Dataset shows that a rising share of non-bank lending has been to investors. Indeed, there has been at least a five-percentage-point increase in the share of investor loans across all outstanding non-bank deals in the Securitisation Dataset over the past two-and-a-half years (Graph 8).[11] This is in contrast to the share of total bank loans to investors, which has been declining over that period.
Similarly, the share of non-bank loans that are on an interest-only basis has been stable over the past couple of years, whereas the share of bank loans that are interest-only has declined significantly over the same period.
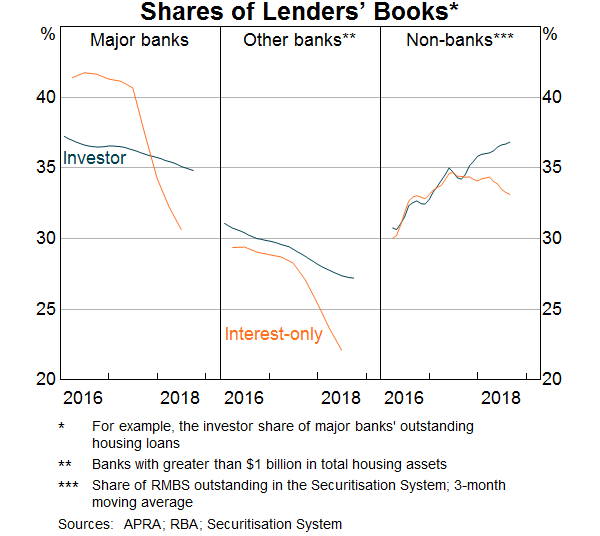
The increase in the share of investor housing in deals issued by non-banks is one of the few noticeable changes in the composition of the collateral underpinning RMBS in the past couple of years. Indeed, for deals by non-banks the share of loans with riskier characteristics such as high LVRs or self-employed borrowers has been little changed.
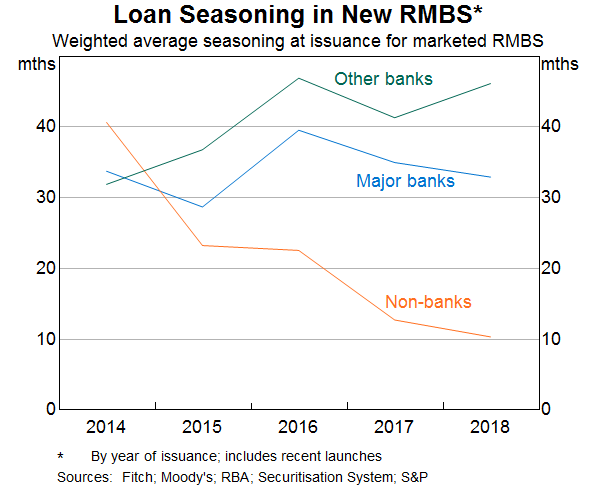
One of the other changes to loan pools in new deals is a fall in seasoning (i.e. the age of loans when the deal is launched). This has been most pronounced for non-banks (Graph 9). It is consistent with non-banks writing a lot more loans. Hence, warehouses of their loans are reaching desired issuance sizes more quickly.
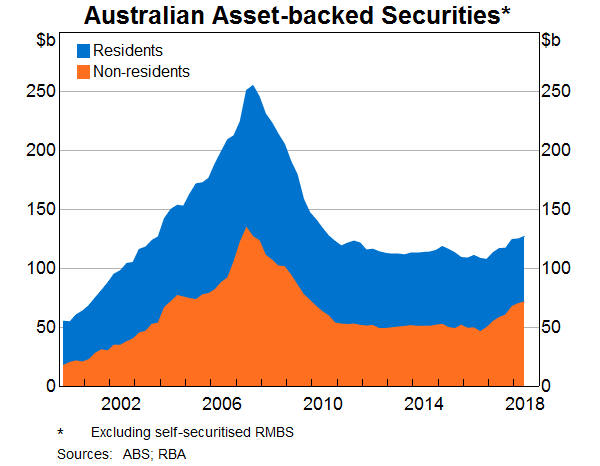
Despite the pull-back in RMBS issuance by the major banks over recent years, the broader stock of asset-backed securities (ABS) on issue increased by around $20 billion over the past 18 months, after remaining broadly stable for the previous 5 years (Graph 10; in addition to RMBS, ABS cover other assets such as car loans and credit card receivables). Demand for these additional asset-backed securities has been driven by non-residents.
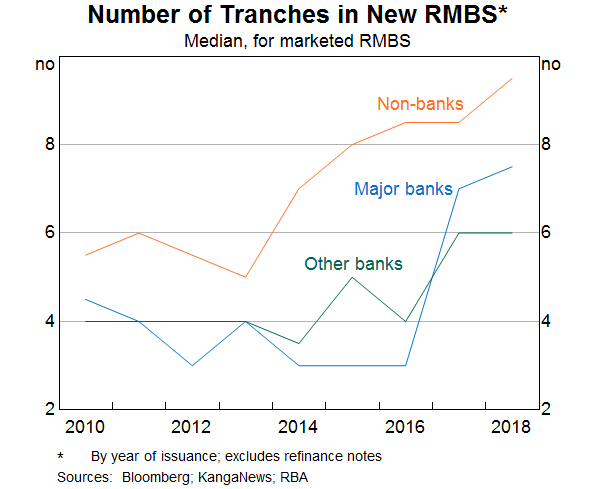
As well as a shift in the composition of investors in ABS, we have observed some changes in deal structures over recent years. Of particular note, the average number of tranches per deal has increased from around four to eight (Graph 11). The increase has been broad-based across different types of issuers. This general trend covers deals with a greater number of tranches with differing levels of subordination, as well as deals where the top tranche is split into a number of individual tranches with different characteristics but equal subordination.
We have also seen what might be termed greater ‘specialisation’ of individual tranches. For instance, in recent years the use of one or more tranches with less common features – such as foreign currency, short term or green features – has increased.[12] This increased specialisation is consistent with issuers addressing the needs of different types of investors.
All of these developments point to the evolution of the Australian securitisation market over the past few years, with non-bank issuers playing an increasingly important role and non-resident investors taking an increasing share of issuance.
Benchmark interest rates, RMBS pricing and funding costs
The increase in bank bill swap (BBSW) rates in early 2018 has led to a modest rise in the funding costs of both banks and non-banks.[13] However, the increase in overall funding costs has been a bit greater for non-bank issuers than for banks. This is because banks have a sizeable proportion of their liabilities – such as retail deposits – that do not reprice in line with BBSW rates. Also, the bulk of non-banks' loans are funded via RMBS issuance, and the cost of issuance has risen by a bit more than BBSW rates (Graph 12). The premium over the BBSW benchmark rate has risen to the level of two years ago. At the margin, these changes mean that non-bank issuers are not able to compete as aggressively on price for new borrowers as banks than was the case a year ago.
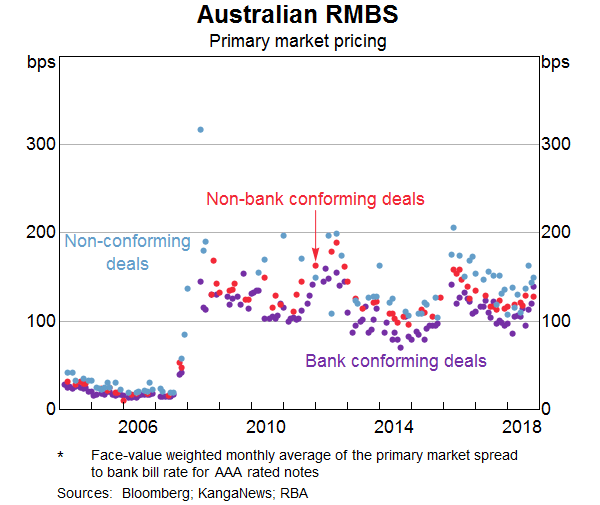
Most lenders have passed through modest increases in their funding costs to borrowers over the past few months. Despite these increases, competition for new loans remains strong, and interest rates for new loans are still well below outstanding rates. So credit supply is available to good quality borrowers on good terms and there is a strong financial incentive to shop around.
Interest Rate Benchmarks for the Securitisation Market
One final point I'd like to make on pricing, is that RMBS issuers and investors should be considering the implications of developments in interest rate benchmarks. In light of the issues around benchmarks such as LIBOR (the London Inter-Bank Offered Rate), substantial efforts have been made to reform these benchmarks to support the smooth functioning of the financial system.
BBSW rates are important Australian dollar interest rate benchmarks, and the 1-month BBSW rate is frequently used in the securitisation market. We have worked closely with the ASX and market participants to ensure that BBSW rates are anchored as much as possible to transactions in the underlying bank bill market. However, the most robust tenors are 6-month and 3-month BBSW, which are the points at which banks frequently issue bills to investors. In contrast, the liquidity of the 1-month BBSW market is lower than it once was. This is mainly due to the introduction of liquidity standards that reduced the incentive for banks to issue very short-term paper.
Given this, RMBS issuers should consider using alternative benchmarks.[14] One option would be to reference 3- or 6-month BBSW rates for new RMBS issues. Another option is the cash rate, which is the (near) risk-free benchmark published by the Reserve Bank.[15] Given the underlying exposure in RMBS is to mortgages rather than banks, it could make more sense to price these securities at a spread to the cash rate rather than to BBSW rates, which incorporate bank credit risk.
Issuers and investors globally, including in Australia, should also be prepared for a scenario where a benchmark they are using ceases to be published. In such an event, users would have to rely on the fall-back provisions in their contracts. However, for many products – including RMBS – the existing fall-back provisions would be cumbersome to apply and could generate significant market disruption. This is most urgent for market participants using LIBOR, since the regulators are only supporting LIBOR until the end of 2021. While we expect that BBSW will remain a robust benchmark, it is prudent for users of BBSW to also have robust fall-backs in place. The International Swaps and Derivatives Association (ISDA) recently conducted a consultation on how to make contracts more robust. We would expect Australian market participants to adopt more robust fall-backs in their contracts following this process.
Conclusion
As the housing market undergoes a period of adjustment, it is useful to have an understanding of some of the drivers at play. Much attention has been given to the effect of prudential measures in dampening the supply of credit and how this has affected the housing market. However, it is also important to acknowledge causation going in the other direction, whereby the softer housing market has led to weakness in credit demand. My assessment is that the slowing in housing credit growth over the past year or so is due to both a tightening in the supply of credit and weaker demand for credit. Within that environment, lenders are competing vigorously for high-quality borrowers.
Developments in the RMBS market are consistent with non-bank lenders providing an extra source of supply. While non-banks remain small as a share of total housing lending, developments over the past couple of years show that the sector continues to evolve. The recent increase in issuance spreads may provide some slight headwinds for the sector; however, spreads remain below their levels in early 2016.
Finally, I would urge both issuers and investors to be responsive to the forces affecting benchmarks used to price RBMS and to focus on preparing for the use of alternative benchmarks.
Endnotes
I thank Emma Doherty, Kate Fernandes and Eden Hatzvi for invaluable assistance in preparing these remarks. [*]
Since mid 2015, the Reserve Bank has required that detailed information about asset-backed securities and their underlying assets be reported to the Bank in order for these securities to be eligible as collateral for transactions with the Bank. The collection of these data allows the Bank to manage its actual and contingent exposure to these securities. The Bank also requires some data to be made available to permitted data users with the aim of enhancing market transparency. The database contains information on approximately 1.6 million housing loans, or roughly one-quarter of those outstanding. Across many, although not all, dimensions the database is reasonably representative of the broader mortgage market; see the forthcoming RBA Bulletin article by Fernandes and Jones. [1]
Debelle G (2018), ‘Assessing the Effects of Housing Lending Policy Measures’, Speech at FINSIA Signature Event: The Regulators, Melbourne, 15 November. [2]
See RBA (Reserve Bank of Australia) (2018), Financial Stability Review, October. [3]
I use the term ‘banks’ loosely to include all authorised deposit-taking institutions (ADIs). For details on the investor lending growth benchmark see APRA (Australian Prudential Regulation Authority) (2014), ‘APRA Outlines Further Steps to Reinforce Sound Residential Mortgage Lending Practices’, Media Release No 14.30, 9 December. [4]
Note that housing prices in Melbourne and Sydney remain 50 and 60 per cent higher than in 2012, respectively. [5]
The data in Graph 4 only partially capture off-the-plan sales of apartments. Nonetheless, to the extent that such apartments are relatively close substitutes for existing apartments, the prices for apartments shown should be broadly representative of all apartments. [6]
The shift from interest-only payments to principal-and-interest payments is another compositional change that may have contributed to a reduction in the average interest rates paid over this period. However, interest rates also declined within the set of interest-only and principal-and-interest loans, for both owner-occupiers and investors. [7]
See RBA (2018), Household and Business Finances, Financial Stability Review, October. [8]
See RBA (2018), ‘Box B: The Impact of Lending Standards on Loan Sizes’, Financial Stability Review, October. [9]
Bullock M (2018), “Building Financial Sector Resilience: A Decade Long Transition”, 10th Annual Commonwealth Bank Global Markets Conference, Sydney, 30 October 2018. [10]
While, as I note below, the average seasoning of loans in non-banks' new RMBS deals has fallen in recent years, the data on non-banks' securitised loans remain a less reliable indicator of recent lending activity. [11]
A typical RMBS tranche (or note) will pay a floating interest rate with principal returned on a ‘pass-through’ basis as payments are received (subject to the payment profile specified in the RMBS deal documentation). A short-term tranche is one that is structured to receive sufficient principal payments such that its weighted average life is less than or equal to one year. A ‘green’ tranche indicates that a sufficient share of mortgages in the pool involves housing that meets certain energy efficiency or low carbon criteria for residential buildings. [12]
See RBA (2018), Domestic Financial Conditions, Statement on Monetary Policy, August for more detail on the effect of higher BBSW rates on banks' funding costs. [13]
This point was raised in a speech by Guy Debelle several years ago: Debelle G (2015), ‘Benchmarks’, Speech at the Bloomberg Summit, Sydney, 18 November. [14]
For further details, see Debelle G (2018), ‘Interest Rate Benchmark Reform’, Keynote at ISDA Forum, Sydney, 15 May, and Alim S and E Connolly (2018), ‘Interest Rate Benchmarks for the Australian Dollar’, RBA Bulletin, September. [15]