Speech The Reserve Bank's Operations – Liquidity, Market Function and Funding
Introduction
In the early stages of the pandemic, there was extreme uncertainty about how much economic activity would decline and how long the economic disruption would last. It was also uncertain how much support would be provided by monetary and fiscal authorities. And so, as the virus spread around the world through early March, extreme uncertainty and the prospect of a sizeable decline in economic activity was reflected in financial markets globally. In particular, there was a sharp rise in the volatility of asset prices, a decline in the prices of risky assets, and before too long, dislocation in a number of key financial markets (Graph 1). Most notable were the problems affecting government bond markets, which are critical to the pricing and operation of financial markets more broadly.[1] Australia was no exception.
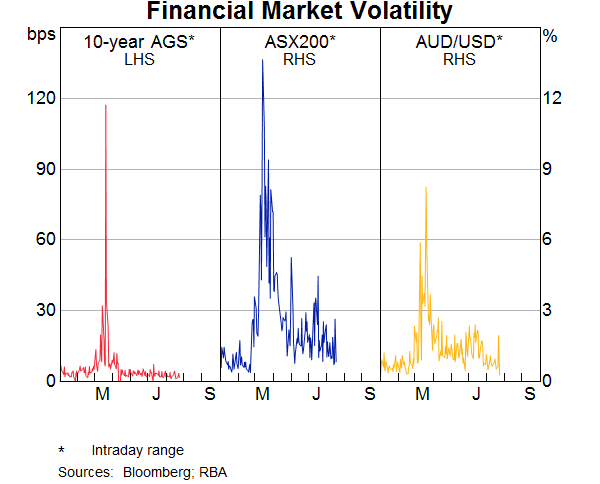
These conditions underpinned a general rush for liquidity, including by banks and other financial institutions. More generally, investors in a wide range of financial markets also sought to shore up their liquidity and reduce their exposures to riskier positions.
In reaction to this increase in the demand for liquidity around the world, central banks increased the supply of liquidity as part of a broader policy response to support their economies (Graph 2). They provided that liquidity initially by scaling up their open market operations. Central banks also bought government bonds in secondary markets. They did this with a view to restoring more normal functioning in those markets, but it also had the effect of providing additional liquidity to those selling the bonds. Furthermore, a number of central banks started new facilities, or extended existing ones, to provide longer-term funding to banks at favourable rates.
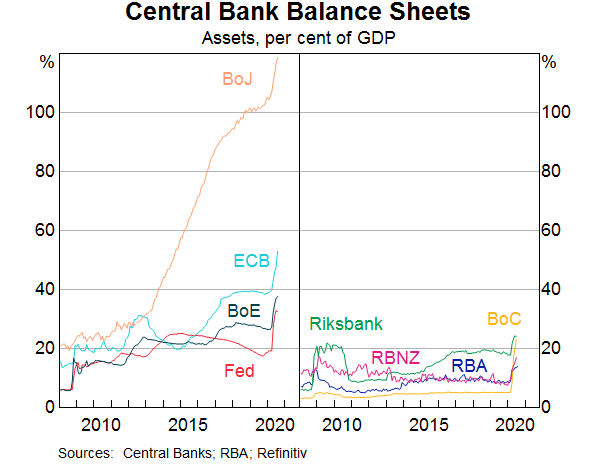
Central banks that had room also cut policy rates. In many cases that was accompanied by forward guidance that policy rates would remain low for some time. Some pursued quantitative easing (or ‘QE’), whereby they committed to buying particular quantities of government bonds (and in some cases other assets) over and above what was required to restore market functioning. Rather than announcing a quantity target, the Reserve Bank opted for a yield target, whereby we stand ready to buy Australian Government Securities (AGS) so that the bond yield at the 3-year mark stays around 25 basis points. To be clear, our 3-year yield target applies to the bond with residual maturity closest to 3 years (as opposed to the futures basket). That means that the focus of our target will shift from the April 2023 bond to the April 2024 bond later this year.
In what follows, I'll focus much of my attention on the details of our operations affecting liquidity, market function and term funding. I'll finish by considering the implications of these various developments for conditions in markets for fixed income securities.
Liquidity
In response to the sharp rise in demand for liquidity from the banks in early March, the Reserve Bank began to increase the supply of liquidity to the banking system via our normal daily open market operations (OMOs). For a time, this was done by dealing more liquidity than our announced intentions (in Graph 3, this is seen by the orange ‘filled’ orders bar exceeding the blue ‘dealing intentions’ line). By mid March, this increase in the amount dealt had become very substantial, and we began offering longer terms on a regular basis.[2]
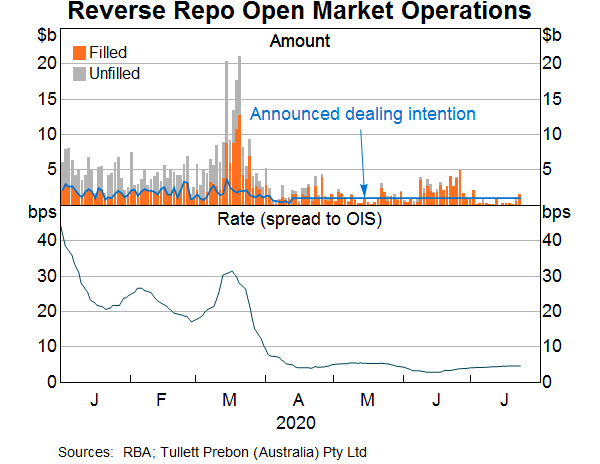
By the latter part of March, liquidity in the banking system – as measured by banks' Exchange Settlement (ES) balances held at the Reserve Bank – rose even further. This was a result of the Reserve Bank's purchases of government bonds in secondary markets to help achieve the yield target on 3-year AGS as well as improve the functioning of government bond markets.[3] By the early part of April, take-up of the Term Funding Facility (TFF), also part of the Reserve Bank's policy package, was adding further to banks' ES balances.
By mid April, there were signs that the increased supply of ES balances had met the surge in demand for liquidity in the banking system. This was evident in the sustained drop in the amounts dealt at our morning auctions. Financial conditions more broadly had also become more settled. Graph 3 shows that we had switched our approach in our OMOs over this period. Previously, we had targeted a particular level of ES balances and used the price (i.e. the repo rate) to determine which counterparty bids were filled (and which were unfilled). Lately, we have been meeting the demand of banks that present at auctions at a steady repo rate.
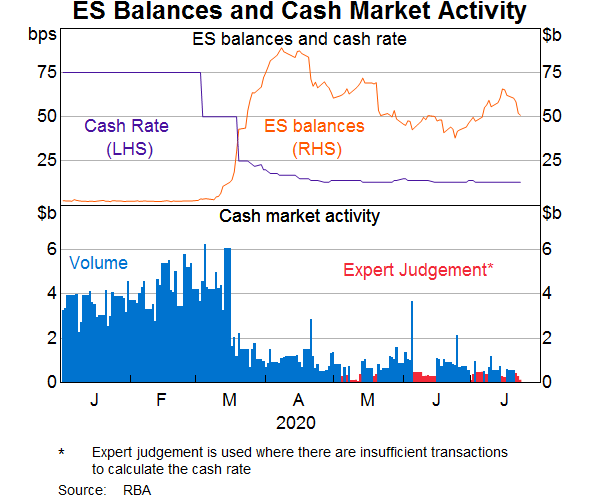
Given the high level of ES balances supplied by the Reserve Bank, it was not surprising that the cash rate fell below 25 basis points (Graph 4). Since the latter part of April, it has generally been either 13 or 14 basis points. Daily volumes of cash transactions between banks have declined, since many banks don't need to borrow overnight from one another given the relatively large balances they each have in their ES accounts. Indeed, on some days there have been insufficient volumes to calculate the cash rate based on market transactions. On these days we have instead used expert judgement as set out in our fall-back procedures to determine the published cash rate. These fall-back procedures ensure that we can continue to publish the cash rate. Typically, we have used the last published rate based on sufficient market transactions. But there has been one occasion when we published another rate that we judged to have better reflected recent market conditions.[4]
One thing we are continuing to do as usual during our regular operations is to buy back AGS that are near to maturity. This is done in order to reduce very large swings in the supply of ES balances that would otherwise occur on days when a large bond line matures. These buy-back operations occur either via our OMOs or bilaterally. They are conducted separately from the purchases at auctions for the purposes of hitting the target for the 3-year AGS yield and to improve market function.[5]
The low level of the cash rate and the high levels of liquidity provided by the Bank have contributed to low rates in other money market instruments, such as bank bills (Graph 5). For some time now, 3-month and 6-month bank bills have been trading around market expectations of the future cash rate (i.e. the OIS rate).
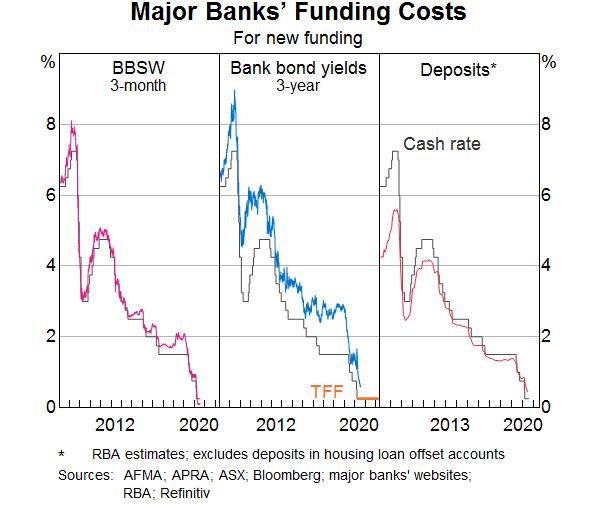
So the actions of the Reserve Bank have contributed to historically low funding costs for banks. Also, banks have benefited from an influx of low-cost deposits. Some of that has come from businesses that tapped their lines of credit but then left those funds on deposit. There are a number of other reasons for the increase in bank deposits. This includes increased spending by the Australian Government (net of taxes), which leads to funds being paid out from the government's account at the Reserve Bank to customers of commercial banks. The purchase of government bonds by the Reserve Bank from non-banks has the same effect.[6]
Market Function
A number of key financial markets became dysfunctional through early March, including the critical markets for AGS and semi-government securities (semis). This was recently discussed by my colleague Guy Debelle, so I'll just provide a short summary of some key points before turning to the mechanics of these operations.
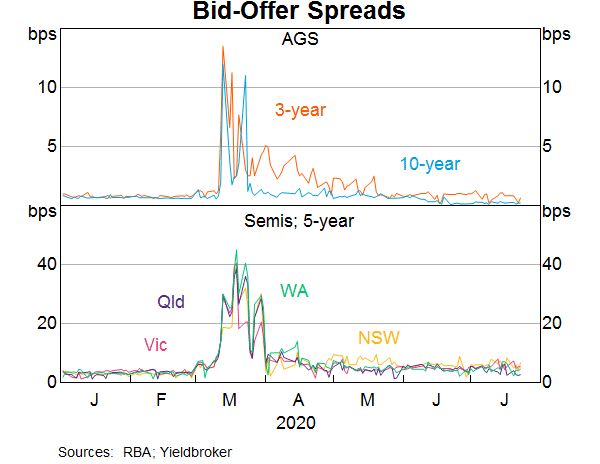
The substantial fall in risky asset prices in early March underpinned a sharp increase in financial market volatility more broadly. This meant that a range of investors needed to sell assets to reduce leverage, cover margin calls, and meet redemptions. Many investors sold government bonds and it didn't take long before dealers were unable to absorb more of the one-sided flows, including because of their own internal risk limits. Hence, we faced the extremely unusual situation whereby prices of risky and risk-free assets were both falling. The fact that markets were not functioning well was apparent in a range of other metrics, including: the sharp rise in bid-offer spreads for AGS and semis; a sharp fall in the ability to trade in bond futures without moving the price; and the breakdown of various no-arbitrage relationships, including between bond futures and the underlying bonds that they reference (Graph 6).[7]
Given that the underlying cause of the market dysfunction was an urgent need to sell bond holdings and raise cash, the Bank decided to step in and provide the market with some liquidity. We did this by offering to buy government bonds at auctions. For each auction, we announced the amount we would purchase, which particular bond lines we would be willing to buy, and let counterparties bid to sell those bonds to us. The bonds we actually bought within that suite depended on the bids at auction, whereby we purchased those at the lowest possible prices (highest yields).
The choice of which bonds we offered to buy, and the overall amount, was informed by a number of sources including liaison with market participants, the AOFM, and the state and territory government borrowing authorities. We also assessed the extent of dysfunction based on some of the indicators I mentioned earlier, including which bonds appeared most mispriced.[8] The auction results themselves were also informative for subsequent auctions. For example, at some auctions we received a lot of offers to sell bonds, and those offers were priced ‘to sell’ (that is, they were offered at yields above mid-market levels). That was a good indication that there was an excess stock of bonds in that segment of the market clogging up dealer balance sheets. In such cases, we conducted further auctions in that part of the yield curve within quick time. On the other hand, if an auction did not receive that many offers, or the pricing we received was relatively unattractive, this indicated that there was no large supply-demand imbalance and, therefore, no pressing need for further auctions in that part of the curve.
The Bank's purchases have had the intended effect: as we purchased bonds the imbalance of supply and demand was redressed. This was evident in a decline over time in the volume of attractively priced offers to sell.[9] It was also evident in other measures, including bid-offer spreads, mispricing along the yield curve, and the ability to trade in futures without moving the price. These all improved, to be close to pre-crisis levels. The general improvement in financial sentiment – aided by the range of other policies, both monetary and fiscal – is also likely to have played a role. In any case, since late April we have scaled back purchases significantly and have not needed to purchase any bonds for some time. We stand ready though to buy bonds if bond market conditions deteriorate significantly, or indeed, if needed to achieve the target of around 25 basis points for the 3-year AGS yield.
Term Funding
Another initiative from the Bank was the Term Funding Facility to lower borrowing costs and support lending, particularly to businesses. The TFF does this by providing a guaranteed source of funding to ADIs for 3 years at the low cost of 25 basis points, with an incentive to increase lending to businesses, especially small and medium-sized enterprises (SMEs). Funds provided under the TFF are secured against collateral, as is the case with the Bank's other facilities.
The TFF provided banks with the option of an initial allowance of around $90 billion. This has since grown to around $150 billion, with additional allowances granted to individual banks that have increased their lending to businesses since the facility began in April.
Take-up of the TFF is currently around $26 billion, or around 17 per cent of the total currently on offer (Graph 7). There are a few reasons why banks have not taken up more of this funding at this stage in the program. One is simply that many banks have accessed even cheaper funding from other sources in recent months, albeit at shorter tenors than three years. In particular, banks have been able to issue bank bills at rates below 25 basis points. Similarly, bank deposits have grown, and an increasing share of deposits have been paying rates below 25 basis points. Also, the TFF provides funding for three years from the date of the drawdown, so the longer an ADI waits to draw funds, the later they will have to repay the money. With no pressing funding need right now, and ample alternative short-term funding at low cost, delaying the drawdown is a useful option.
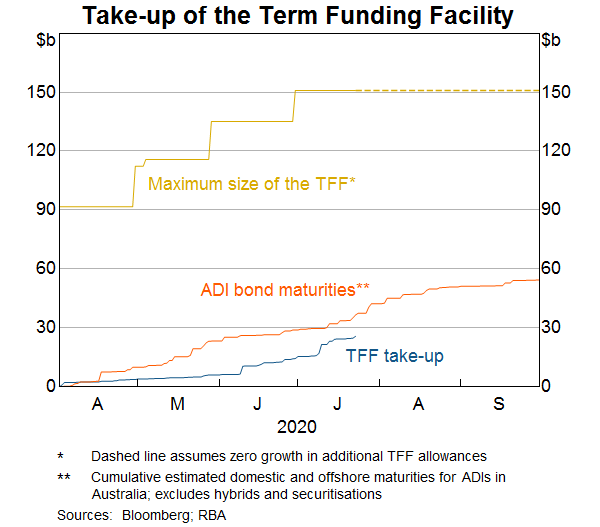
The calculus underpinning the decision of some banks to delay drawing on their initial TFF allocations will change closer to the deadline of 30 September. At that time, it will make sense for banks to compare the certain 25 basis point cost of the TFF with the uncertain cost of other sources of funding over the next three years, including bonds that would mature over that period. So our expectation and liaison with the banks suggest that the take-up of the TFF will ramp up as we get closer to the end of September.
Despite only part of the funding being drawn down to date, it's worth noting that the TFF – combined with the Bank's other policy measures – has already had a significant impact. On the funding side, the ability to draw on the TFF means that banks can be selective in how they raise money, and this has contributed to overall bank funding costs falling by around 60 basis points since February. And on the lending side, we have seen interest rates on new fixed-rate mortgages fall by around 65 basis points since February, and rates on SME loans fall by around 60 basis points.
Private Sector Fixed Income Markets
I now want to turn my attention to what all of these developments imply for private sector fixed income markets.
Like government bond markets, private sector fixed income markets also became dysfunctional in March. These markets were significantly disrupted for a time as concerns and uncertainty about the economic and financial effects of the pandemic rose sharply. Issuers typically try to avoid going to market with new bonds at such times, given the very high premiums demanded by investors, particularly if they have the option of waiting because they are already well funded or have other funding options. However, with the aid of monetary and fiscal policies, it did not take too long for financial conditions to settle and fixed income markets to ‘reopen’. Issuance though has varied considerably across different types of issuers.
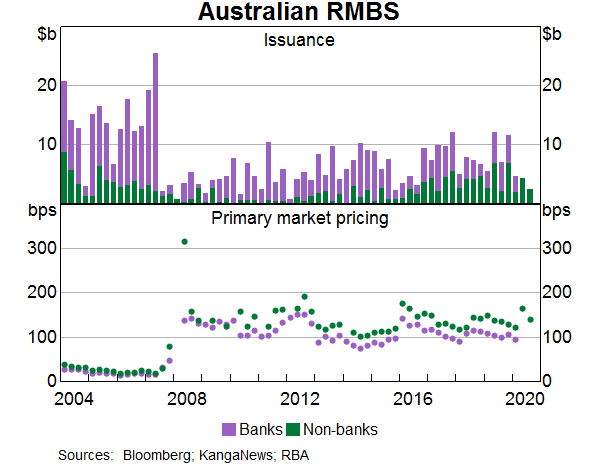
The major banks have let their existing bonds mature without replacement, so their issuance has declined in net terms, and they have not issued any residential mortgage-backed securities (RMBS, Graph 8). This is not surprising given a number of forces at work. First, with credit growth likely to remain low or even decline, their funding needs will remain modest for a time. Second, they had issued quite a lot of bonds prior to the pandemic and have subsequently found themselves flush with other sources of funding, including low-cost deposits. While those sources do not have the same maturity profile as longer-term bonds, they lessen the need for near-term issuance. And third, they have the option of accessing funds from the TFF at a cost of 25 basis points, while the cost of a newly issued bond of similar maturity is around 30-60 basis points (based on secondary market prices in recent weeks).
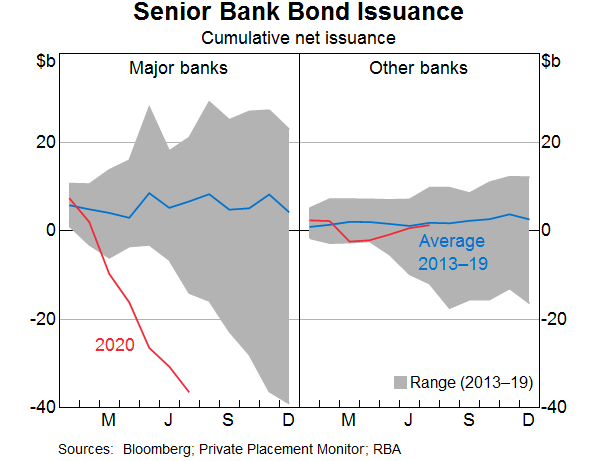
Other, smaller banks, have issued bonds over recent months. In part this reflects the fact that they haven't benefited to the same extent as the major banks from an influx of deposits. But in any case, their issuance is roughly offsetting maturities so in net terms issuance isn't increasing. Similarly, mortgage originators have resumed issuance of RMBS over the past few months, following a pause in April. The AOFM has supported this by purchasing RMBS directly at issuance, and in the secondary market (with investors then recycling those funds into new primary issuance).[10] Spreads at issuance are a little higher than they were at the start of the year, but do not stand out when taking a slightly longer perspective (Graph 9). And yields are at low levels, driven by the fall in BBSW rates.
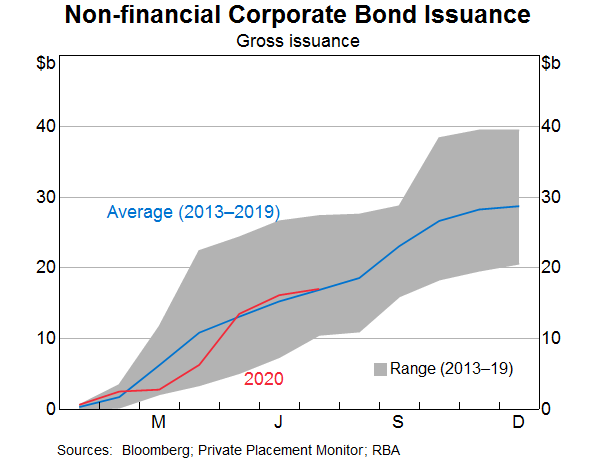
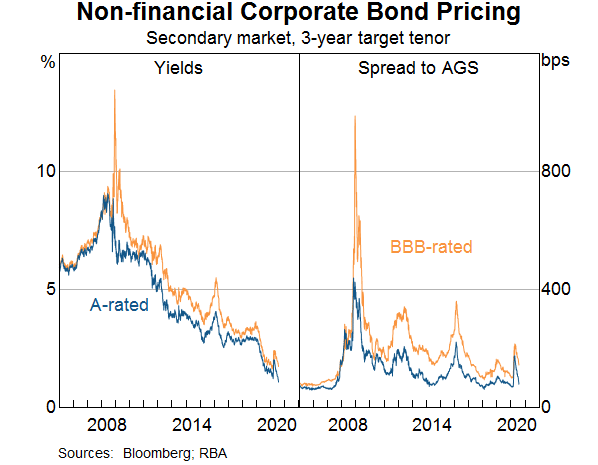
Over the year to date, non-financial corporations have been issuing bonds to about the same extent as they have in recent years (Graph 10). After a period when markets were disrupted during the height of the market stresses in March, these firms have been able to issue bonds in good quantities and relatively favourable yields, which is welcome (Graph 11). The relatively low level of yields reflects the historically low level of risk-free rates, with 3-year AGS yields consistent with the Board's target of around 25 basis points. Also, spreads on corporate bonds are relatively low. Spreads in secondary markets rose earlier in the year in response to fears about the health of the business sector, but have eased somewhat since then, aided by significant support provided by monetary, fiscal and prudential policies.
Finally, many large firms also tapped their credit lines at banks in March and April, providing a significant boost to business credit. Part of that appears to have been precautionary given that firms have repaid some of their revolving facilities more recently. Another source of funding has been the very substantial issuance of equity in recent months by a wide range of listed firms. Those companies raising equity cited the desire to strengthen their balance sheets, and in some cases to pursue opportunities for growth.
Conclusion
In response to the severe impact of the pandemic on economic activity and financial markets, the Australian authorities have provided unprecedented support, including via fiscal, monetary and prudential policies. Monetary policy has been focused on supporting the economy by keeping the cost of borrowing low and helping to maintain the supply of credit to households and businesses.
To help achieve these ends, the Reserve Bank has undertaken a number of significant operations. First, it responded to the sharp rise in the demand for liquidity by the banking system by scaling up its daily open market operations. It met the demand for liquidity from banks, providing that at longer terms, against high-quality collateral. Second, the Bank provided much needed liquidity in a different manner, by purchasing government bonds outright at a time when there were plenty of sellers and very few buyers in those critical markets. And third, we provided the option of low-cost funding to banks by rolling out the Term Funding Facility. While we refer to this as funding, it is liquidity provision by another name – the banks obtain cash, for three year terms, by posting collateral. So while these operations are novel in some respects, in many ways they can be thought of as representing the ‘bread and butter’ of central banking – providing liquidity to meet demand at a time of considerable need, thereby acting to stabilise crucial markets.
From my perspective, these operations have worked well. Along with other monetary, fiscal, prudential and health policies, they contributed to a noticeable improvement in market sentiment and accommodative financial conditions. Among other things, we clearly see the effect of that in the ability of firms to gain access to a wide range of funding, at low rates, including in fixed income markets.
Endnotes
I thank Richard Finlay for invaluable assistance in preparing this material. [*]
Debelle G (2020), ‘The Reserve Bank's Policy Actions and Balance Sheet’, Address to the Economic Society Australia, 30 June. [1]
For further details see https://www.rba.gov.au/media-releases/2020/mr-20-07.html. [2]
For further details see https://www.rba.gov.au/media-releases/2020/mr-20-08.html. [3]
This option allows us to account for information about the rates and size of trades that have occurred over a number of days, even if the volume on any one of those days was not sufficient to publish a reliable measure of the cash rate. For full details of the fall-back procedures see https://www.rba.gov.au/mkt-operations/resources/cash-rate-methodology/cash-rate-procedures-manual.html. These procedures allow for the cash rate to continue to be published, including in the absence of market transactions, and allow for changes in the benchmark design in response to market conditions to ensure that the cash rate continues to reflect the interest rate relevant to unsecured overnight funds. [4]
Statistical Table A3 contains data on such purchases; see https://www.rba.gov.au/statistics/tables/xls/a03.xls. [5]
The purchase by commercial banks of the bonds of the states and territories also contributes to a rise in bank deposits since the states and territories hold their accounts with commercial banks, whereas the Federal Government holds their accounts at the Reserve Bank. [6]
For further details see Finlay R, C Seibold and M Xiang (2020), ‘Government Bond Market Functioning and COVID-19’, RBA Bulletin, September. [7]
See Finlay R, C Seibold and M Xiang (2020), ‘Government Bond Market Functioning and COVID-19’, RBA Bulletin, September. [8]
As market function improved and the supply-demand imbalance lessened, the Bank reduced the size of its auction operations, and it is possible that this reduction may also have contributed to the fall in attractively priced offers to sell bonds. [9]
For further details see <https://www.aofm.gov.au/sfsf>. [10]
