Speech The State of Economics

Jacqui Dwyer
Head of Information Department
Address to The Economic Society of Australia
Sydney –
Thank you for having me join you today to talk about the state of economics.[1] Economics is an important discipline because economic decisions can have far-reaching consequences for the welfare of individuals and society. In fact, the Nobel Laureate, George Stigler, described economics as one of a group of disciplines that most people should have a ‘modicum’ of knowledge about – or rather, some level of literacy.[2] He argued that literacy in some disciplines is required because their vocabulary and logic are so pervasive in our lives that ordinary people must use them without recourse to expert advice.[3]
So if a discipline is worth most people knowing something about, how do we check its health? And how do we encourage public engagement with it? The Australian Mathematical Sciences Institute (AMSI) has, for some years, conducted a comprehensive ‘state of the discipline’ assessment of mathematics.[4] It takes detailed snapshots of the learning, teaching, utilisation, research and application of mathematics in Australia. Today, I borrow from its approach to discuss the economics landscape and propose the idea of us as a profession looking more closely, and regularly, at the state of economics.
We are already aware of the consequential fall in the size and diversity of the economics student population. To look at the economics discipline in a structured way, we might ask the following set of questions:
- Who studies economics?
- What is the pipeline of potential economics graduates?
- How are economics skills rewarded by the labour market?
- What is the level of economic literacy in the community?
- What are the developments in economic thought and research?
Today I will talk to the first four of these questions, looking through the prism of the RBA’s public education program – presenting a high-level summary of our observations about the landscape of economics education and economic literacy.
Who studies economics?
A person’s initial exposure to the formal teaching of economics is often at high school. Some of those students will continue to study economics at university, while others will come to the discipline after their high school careers with no prior exposure. The number of students who choose economics at high school and university – as well as the characteristics of these students and those who teach them – has important bearing on the state of the discipline.
Economics at high school
When I first presented to this group five years ago, the RBA had only recently become aware of the dramatic fall in economics enrolments at high school. It was a surprise; most of us in this forum had studied economics when it was a popular and widely offered subject. As shown in Graph 1, enrolments in Year 12 economics remain around 70 per cent lower than in the early 1990s – with the size of this fall now a stylised fact of the landscape for economics enrolments. Most of the fall occurred during the mid-1990s, with enrolments then drifting down before persisting at relatively low levels for the past decade.[5]

Also nationally, we were alerted to the stark fall in female participation (Graph 2). Whereas in the early 1990s, male and female students accounted for roughly equal shares of economics enrolments in Year 12, female participation has steadily fallen so that males now outnumber females by two to one.

In a federated education system, it is actually not straightforward to drill down into the drivers of these national outcomes; each state has different authorities responsible for the collection of education data and they do so in different ways. Consequently, we often focus on New South Wales to gain deeper insights into the economics discipline because the NSW Education Standards Authority (NESA) has a particularly rich dataset.[6] New South Wales also has the largest body of economics students, so tends to shape the national results.
Looking at the Year 12 economics enrolments data for New South Wales, there is the same pattern of decline as is the case nationally, but we can also see the displacement of economics by business studies following its introduction in the early 1990s, along with a resurgence of business studies in recent years (Graph 3). To help understand the drivers of this, my colleagues Livermore and Major surveyed high school students, while Parsons and You surveyed teachers, on their ideas and perceptions of both disciplines.[7] These RBA surveys revealed that business studies is perceived as easier to learn and easier to teach than economics (with fewer concepts to explain and more readily available content), while also being considered highly employable. Economics, on the other hand, is perceived as difficult to learn and difficult to teach (with more concepts to explain and too little relevant Australian content) and having an unclear career path. Furthermore, students generally think that economics is less interesting than business studies, have little desire to know more about it and believe it has a higher workload. These negative perceptions dominate students’ recognition that economics can be used for the good of society. In short, students think it is a risk to study economics.

The perceptions of economics and the revealed preference for business studies has had bearing on the decision of schools to offer economics. As shown in the first quadrant of Graph 4, in the early 1990s, economics was offered in almost every school in New South Wales – government, non-government, religious, secular, country, city. There has since been a steady fall in the offering of the subject and this has been most pronounced among government schools, of which only 30 per cent these days offer economics. This has been consequential. Government schools are mainly co-educational and they accept students from all backgrounds. So when fewer government schools offer economics, it weighs on diversity. It has contributed to the fall in female participation, with outcomes in New South Wales mirroring those nationally. But it has also contributed to a fall in participation by students from less advantaged backgrounds (as measured by the socio-economic status of their school).[8] This fall has been offset by increased participation from students from advantaged backgrounds – a shift that has accelerated over the past few years. And we can see a fall in participation at non-metropolitan schools, such that it is now a rarity for economics to be offered at schools outside the major cities.

These developments at school are foundational to who is engaged with economics and who might choose further study in economics at university.
Economics at university
At university, it is necessary to first establish what we mean by economics because it can be taken as a degree, a major or a subject within many different degree programs. We rely on each university’s judgment about how much economics counts as an economics enrolment when they report on this to the Department of Education (DET). Using these data, Graph 5 shows that economics enrolments at university flatlined for an extended period, though have picked up somewhat recently.[9] This contrasts with growth in other fields of study, notably those that are business-oriented – just as is the case at high school – along with STEM fields (science, technology, engineering and maths). And, as at school, economics university is perceived as a risk to study, with an uncertain relevance and less well-defined career path than other disciplines.

Against a background of fairly stagnant enrolments in economics, many of the trends in diversity that we have seen at school continue at university. Graph 6 shows us that there has always been a gap between female and male participation in economics at university (unlike school where balance between sexes once existed). This gap became progressively wider before efforts to increase female participation saw it increase – but only back to a level where males outnumber females by nearly two to one.
Even more pronounced than the decline in female participation is the loss of diversity in socio-economic status (Graph 6).[10] The trend rise in participation by students of high socio-economic status at high school continues into university, so that over 55 per cent of economics students are from advantaged backgrounds, while those from disadvantaged backgrounds are a distinct minority. In fact, economics has become a socially exclusive subject, with a higher share of students from advantaged backgrounds than is the case for most other disciplines.

Feeding into this profile of advantage is the fact that fewer universities are offering economics. Furthermore, more than half of all enrolments in economics are at universities in metropolitan New South Wales and the Australian Capital Territory, presenting geographical barriers to diversity.
The fall in the size and diversity of the economics student population matters. The number of students who study economics – both at school and university – influences the level of economic literacy in society. And the diversity of those students influences the whole discipline, including approaches to public policy. Diversity has bearing on the economic questions we ask, our approaches to answering them and how we implement solutions to economic problems. For these reasons, we should be interested in the pipeline of potential economics graduates.
What is the pipeline of potential economics graduates?
Studying economics at high school is not a prerequisite for doing so at university. Furthermore, interest in economics at university is low, even for those who studied it in Year 12. Almost two-thirds of Year 12 economics students, and around 95 per cent of other Year 12 students, applying for tertiary institutions in New South Wales and the Australian Capital Territory did not preference an economics course for university (Graph 7). However, Lovicu has shown that the path from school to university is an important one.[11] The latest data from the Universities Admissions Centre (UAC) indicate that of those students who study economics at school, only 7 per cent go on to study economics at university. Yet these students account for around 60 per cent of university enrolments in economics.[12] Furthermore, the transition rate from school economics to that at university has been consistently lower for female students over the past decade. Consequently, our diminishing and increasingly homogeneous pool of high school economics students dominates university enrolments and thereby those who go on to become economists or use economics in the workplace.

How are economics skills rewarded by the labour market?
Given that economics is perceived by many students as having a less certain career path – indeed, being less employable than business studies – let’s look at how the study of economics is rewarded by the labour market. Bishop and Guttmann literally asked the question ‘does it pay to study economics?’.[13] The answer is ‘yes’. Part of the answer relates to the types of jobs one can obtain with an economics degree. Another part relates to the skills that are developed through studying economics and what employers are prepared to pay for them.
Bishop and Guttman have updated their core findings using data from the 2021 Census. Graph 8 shows that, among 82 different fields of study, economics allows for one of the most diverse ranges of employment destinations, both in terms of industry and occupation. An economics graduate may be employed as an economist in a variety of industries, or their economic skills may be relevant to employment in a variety of occupations.

How are these skills valued? Graph 9 shows the average earnings of an economics graduate compared with those of other disciplines. They are only eclipsed by those who studied engineering (up from the third-highest ranking at the previous census). Bishop and Guttmann looked at 10 specific skills acquired in different fields of study and modelled the ‘skill premium’ for these different skills, finding that the earnings outcomes for economics graduates largely reflected the return to economics knowledge, mathematical skills and analytical skills.
So, with a wide range of employment destinations and relatively high pay, there is much to recommend the study of economics. And yet it is not unreasonable for students to feel uncertainty about where economics can take them. Despite having higher earnings on average, the unemployment rate of economics graduates is higher than some disciplines (such as health, education and business), particularly at the time of graduation, suggesting some difficulty in obtaining an initial job in the field.[14] However, the unemployment rate for economics graduates is similar to some those in STEM fields such as science and information technology.

What is the level of economic literacy in the community?
Against the background of the falling size and diversity of the economics student population – and a more general ‘image problem’ of the discipline – an important question is whether this has bearing on economic literacy in society. It is hoped that those who study economics acquire some level of economic literacy. And for those who don’t study economics, engagement with economic news can also be associated with the ‘modicum’ of knowledge that matters for economic literacy. Those who are economically literate make more informed economic choices, better understand the world around them and can influence public discourse and the actions of government. They can also contribute to the effectiveness of public policy by aligning their expectations or behaviour with it. But there is no settled definition of economic literacy, so measuring it is difficult. This contrasts with defining and measuring financial literacy, which is a mature field academically,[15] and there are authorities that are responsible for supporting financial literacy in the community.[16]
As part of our work in the public education program, McCowage and I recently proposed a working definition of economic literacy that lends itself to practical efforts to assess economic literacy, and we invited others to contribute to a debate on this definition.[17] To summarise, someone is economically literate if years after they have been taught, they can apply essential principles of economics to situations in their lives and have a basic understanding of core topics that explain their economic environment.
The RBA then conducted a survey of 3,000 Australian adults that included five questions based on those used in long-running tests of economic literacy in the United States.[18] These questions were about:
- the relationship between a recession and unemployment
- the relationship between inflation and purchasing power
- the relationship between investment and output growth
- the relationship between interest rates and decisions to spend or borrow
- the monetary policy response to a recession.
We gave each respondent a literacy ‘score’ (of between 0 and 5) based on how many of the five questions that were answered correctly.[19] So this was far from a comprehensive assessment of economic literacy, but our first foray into the area for Australian adults.[20]
I’ll highlight the key findings. We found that around 80 per cent of respondents correctly answered the questions about the relationship between a recession and unemployment, and about the effect of inflation on purchasing power (Graph 10). While we didn’t know what to expect, this was a high share of correct responses – perhaps because these questions touch on lived experience and include variables that are widely reported on. By contrast, the remaining questions had a low share of correct answers, perhaps because they are about abstract macroeconomic concepts that have a less direct effect on individuals or draw on pre-existing knowledge.

We averaged the correct responses of each person to form a simple literacy score for Australian adults. We only have a snapshot for this point in time, but we can look at scores for different social groups, and these vary significantly (Graph 11). Males, older Australians, those with higher incomes, those with degrees, those who have studied economics, those who were employed and those who were engaged with economic news had higher average economic literacy scores. People who were aged 18 to 24 years, unemployed or without a degree had the lowest economic literacy scores.
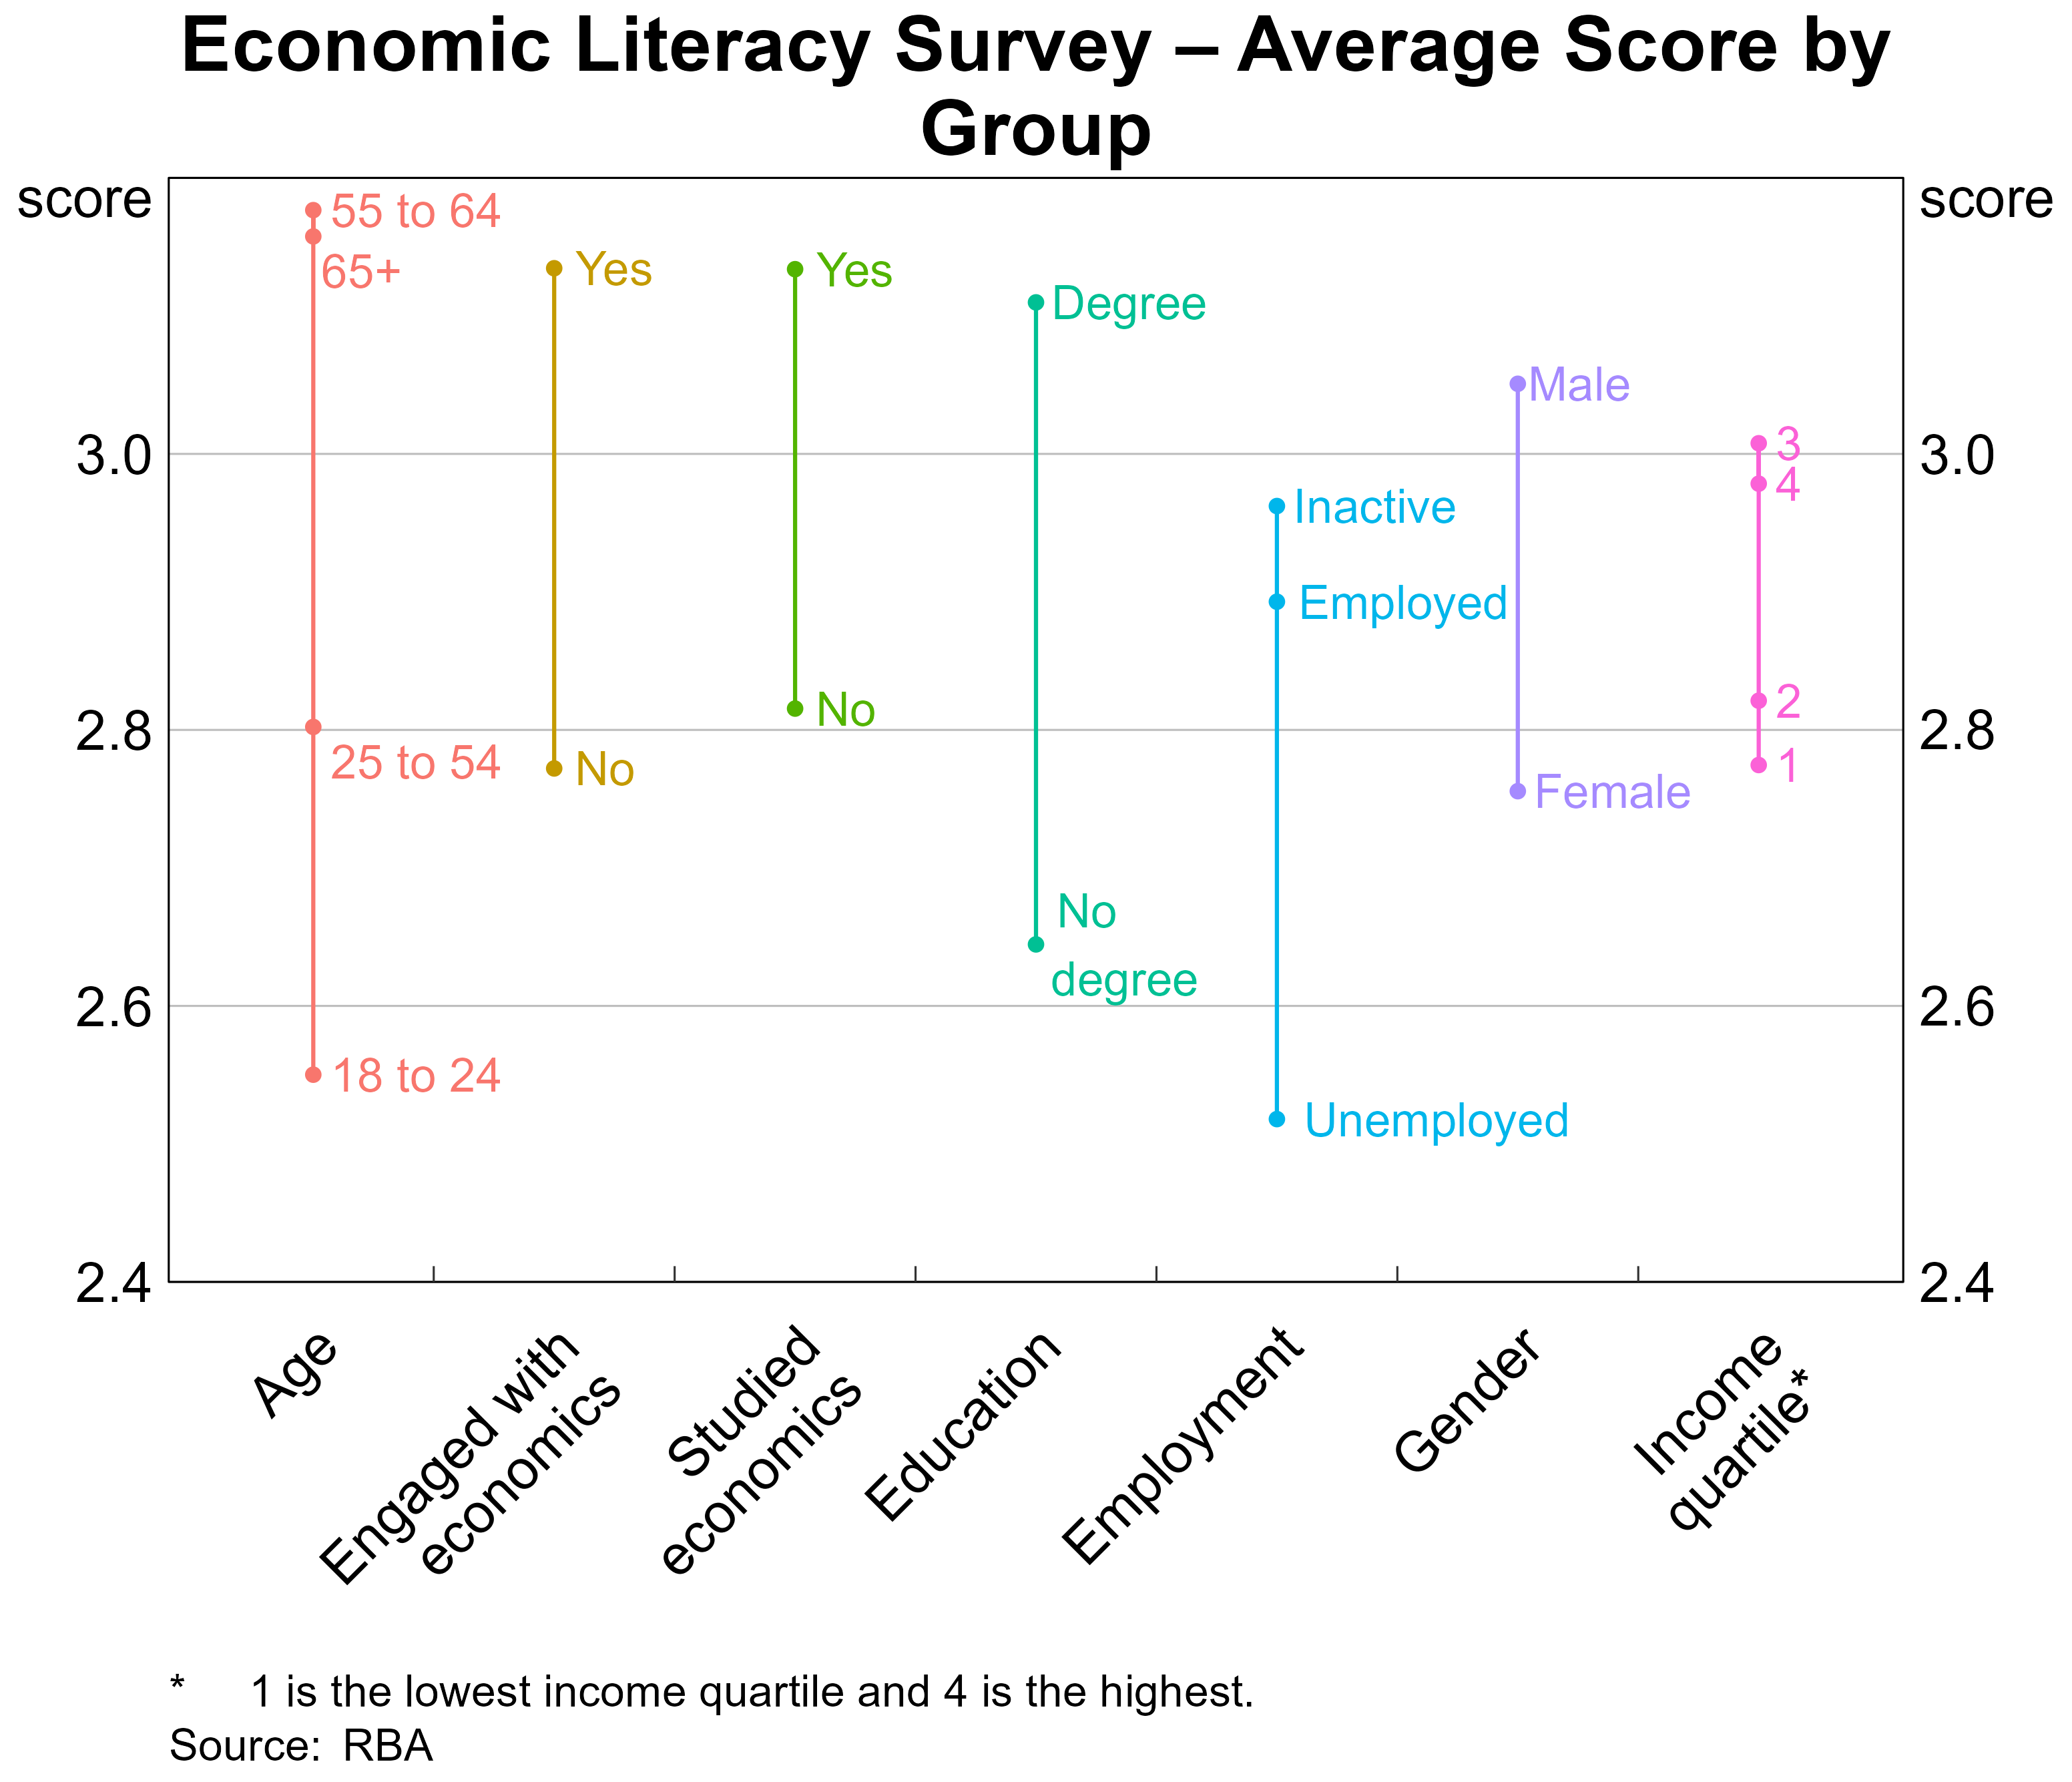
In many respects, the different outcomes in economic literacy across demographic groups reflects the fall in diversity we see in the economics student population.
In the same survey that tested the economic literacy of Australian adults, we also asked respondents about their engagement with economic news – and thereby economics.[21] It gets to where we have an image problem, how we can advocate for the study of economics, and how we communicate economic matters to the broader community.
In the first instance, we know that there are distinct differences in the level of engagement with economic news between males and females – consistent with differences in their participation in the study of economics (Graph 12). The share of females who report that they ‘never or rarely’ read economic news is nearly twice that of males. And while around half of males report that they engage with economics ‘every day’ or ‘every week’, only one-fifth of females report doing so.

Looking more closely at those who engage with economic news, we find that they include those who had studied economics or finance in the past, those in the highest income quartile and those with degrees (Graph 13). Young people also reported to be engaged with economic news, at least on a weekly basis (a promising finding given their low measured levels of economic literacy). Those who least engaged with economic news are the unemployed, females, those with low incomes, and those with lower levels of formal education (including in economics).

Reflecting on the state of economics
Our leaders in economics today are the product of another era of economics education – one that has since produced our current and unprecedented number of female leaders in economics. For the first time, a woman is heading up the RBA, the Australian Government Department of Finance and the Productivity Commission, and we have a raft of female chief economists. It is tempting to think that they are in the vanguard of change and that others will follow and usher in a more inclusive discipline. But as I have shown you, there are few followers.
A previous era of economics education has produced current leading academics and a succession of prominent agency heads from diverse socio-economic backgrounds – notably in the Treasury. But again, we have few followers.
So despite the importance of economics as a discipline, we have seen a significant fall in the size and diversity of the economics student population, along with social divides in levels of economic literacy and engagement with economic news. Exclusivity is becoming a hallmark of economics and yet a robust and inclusive discipline can raise economic literacy, shape the future of economic thought and practice, and improve the quality of both public discourse and public policy.
As Stigler reminded us, people choose ‘to speak and vote on economic problems’.[22] This alone is a compelling reason to regularly review the state of economics. In this endeavour, economic scholars, educators and institutions all have a role to play.
Thank you.
Endnotes
This talk summarises aspects of research and analysis by the RBA’s public education program since it began in October 2016. I would like to acknowledge all current and former members of the public education team. I would also like to thank Stephanie Parsons in particular for her comments on this talk and Ryan Couston for his assistance with data and graphs. [1]
Stigler GJ (1970), ‘The Case, If Any, for Economic Literacy’, The Journal of Economic Education, 14(3), pp 77–84. [2]
Stigler, n 2, p 78. [3]
For the latest of seven reports on the state of the mathematics discipline, see Wienk M (2020), The State of Mathematical Sciences 2020: 7th Discipline Profile of Mathematics and Statistics in Australia. Available at <https://amsi.org.au/publications/the-state-of-mathematical-sciences-2020-7th-discipline-profile-of-mathematics-and-statistics-in-Australia>. [4]
Note that data referred to in the RBA’s public education outputs are for mainland states. A ‘state of the discipline’ would benefit from timely access to a consistent time series of enrolments data in all Australian states and territories. [5]
I would like to thank Adrienna Gellerfy from NESA for her efforts in providing panel of school-level enrolments data for New South Wales that have been central to the RBA’s analysis of the landscape for economics enrolments. [6]
Specifically, Livermore and Major analysed the results of a large-scale survey of NSW high school students (implemented on behalf of the RBA by Ipsos) that examined students’ approaches to subject selection and their perceptions of economics as a subject and as a discipline: see Livermore T and M Major (2020), ‘Why Study (or Not Study) Economics? A Survey of High School Students’, RBA Bulletin, June; Livermore T and M Major (2021), ‘What Is Driving Participation and Diversity Trends in Economics? A Survey of High School Students’, RBA Research Discussion Paper No 2021-06. The survey is to be re-run in late 2024. Parsons and You provide insights into the perceptions and needs of economics teachers involved with the RBA’s education program: see Parsons S and C You (2021), ‘Supporting Economics Teachers: Their Insights on Economics Education and the RBA’s Education Program’, RBA Teacher Reading; Parsons S and C You (2024), ‘An Update on Supporting Economics Teachers’, RBA Teacher Reading. [7]
For our NSW schools’ data, socio-economic status is measured by the Index of Community Socio-educational Advantage (ICSEA) score that is calculated for schools by the Australian Curriculum, Assessment and Reporting Authority (ACARA). Among other things, the ICSEA score gives emphasis to parental education and occupation, and school location. [8]
Note that results for Macquarie University are excluded because it has a different approach to classifying its Economics enrolments. [9]
At university we must rely on postcode as a proxy for advantage, which is a less precise indicator than the ICSEA scores used for schools. However, given that both postcode and ICSEA scores paint a similar picture of trends in diversity at high school, we are confident of the signal that postcode provides for diversity at university. [10]
Lovicu G (2021), ‘The Transition from High School to University Economics’, RBA Bulletin, June. [11]
Thanks to Helen Tan from UAC for her provision of detailed university admissions data and to Emma Chow for her extension of the original work done in Lovicu, n 11. [12]
Bishop J and R Guttmann (2018), ‘Does It Pay to Study Economics?’, RBA Bulletin, September. [13]
It may be that a postgraduate qualification is more relevant for many economist roles, or that employers may not fully recognise the applicability of the frameworks and skills acquired in the study of economics. [14]
For recent research on financial literacy in Australia, see Preston A (2020), ‘Financial Literacy in Australia: Insights from HILDA Data’, Presentation at the UWA Public Policy Institute, March; Preston AC and RE Wright (2019), ‘Understanding the Gender Gap in Financial Literacy: Evidence from Australia’, Economic Record, 95(S1), pp 1–29. [15]
In Australia, the Commonwealth Treasury is responsible for the National Financial Capability Strategy and the Australian Securities and Investments Commission is responsible for provision of the services and tools associated with its implementation. [16]
McCowage M and J Dwyer (2022), ‘Economic Literacy: What Is It and Why Is It Important?’, RBA Bulletin, December. [17]
Led by my colleagues Peter Rickards and Madeleine McCowage, the RBA designed a survey that was implemented on our behalf by BIT. It has supported various pieces of research, including McCowage M (2023), ‘Economic Literacy in Australia: A First Look’, RBA Bulletin, September. [18]
Additionally, we asked them a factual question about the RBA’s inflation target, though this was not included in the literacy score as it was knowledge-based rather than explaining understanding of an economic concept. [19]
In fact, we are not aware of other efforts to measure economic literacy in Australia aside from a large-scale survey testing economic literacy of Queensland high school students in 1998, also based on the Test of Economic Literacy (TEL): Lietz P and D Kotte (2000), The Importance of Economic Literacy, Peter Lang GmbH, Frankfurt. [20]
I want to thank Madeleine McCowage for her unpublished work on this topic. [21]
Stigler, n 2, p 82. [22]