Equity & Diversity Annual Report – 2007 Section 2: Workplace Profile
Section 2.1: Diversity Profile
The current number of total staff is 896. This is a slight increase on last year's figure of 872 and reflects an upward trend over the past four years. This increase in overall staff numbers has not had any significant impact on the designated diversity groups as shown in the graph below.
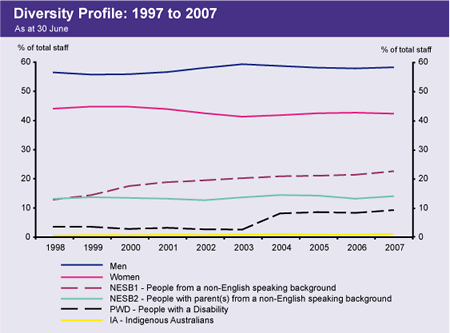
The Bank's diversity profile has remained relatively stable over the past four years. Indigenous Australians continue to account for a very small proportion of staff, 0.8 per cent; 22 per cent of staff identified themselves as NESB1 (staff who were born overseas and whose first language is not English) and the number of staff who have identified as having a disability in 2007 totalled 80, representing nine per cent of total staff. This latter figure does not capture staff who may have acquired a disability since commencing employment, particularly an age onset disability. It also does not include temporary disabilities experienced from various injuries but which are duly accommodated under the principles of reasonable adjustment in the workplace.
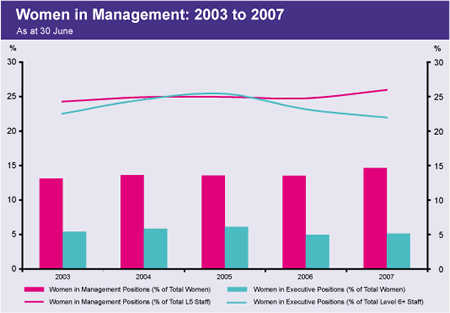
The representation of women in employment has also remained stable over the past four years at around 42 per cent, while women continue to be under-represented at the management levels of the Bank, in particular at the senior executive level.
Since 2003, the representation of women in management positions as a proportion of total female staff has increased incrementally from 24 per cent to 26 per cent. However, only five per cent of all women at the Bank are employed in management positions, similar to last year, compared with 14 per cent of men. Over the past five years the number of women at Manager Level 5 and above has increased by 25 per cent; the total number of staff in management positions has increased by 16 per cent over the same period. To ensure that progress continues, the Equity & Diversity Policy Committee identified a new approach for investigating strategies to increase the proportion of women in management positions. This involves analysing more deeply the career experience of women in the Bank to assess whether there are obstacles that inhibit their progression to management roles.
Section 2.2: Occupational Groups
During the reporting year, the Bank's occupational groups were reviewed and updated with the Australian and New Zealand Standard Classification of Occupations (ANZSCO) replacing the Australian Standard Classification of Occupations (ASCO). All Bank positions were reviewed and recoded to reflect the revised occupational groups contained in the new regime of ANZSCO. However, due to the conversion of positions from ASCO to ANZSCO, no direct comparisons of occupational groups with past years will be possible. This year, the figures will reflect 2006/07 only; next year a second year of ANZSCO figures will be available for comparative analysis.
| ASCO | ANZSCO |
|---|---|
| Managers & Administrators | Managers |
| Professionals | Professionals |
| Associate Professionals | Technicians & Trade Workers |
| Tradespersons & Related Workers | Community & Personal Service Workers |
| Advanced Clerical & Service Workers | Clerical & Administrative Workers |
| Intermediate Clerical, Sales & Service Workers | Sales Workers |
| Intermediate Production & Transport Workers | Machinery Operators & Drivers |
| Elementary Clerical, Sales & Service Workers | Labourers |
| Labourers & Related Workers |
The Bank continues to change from an organisation predominantly comprising clerical and administrative positions to one of a predominantly professional nature. Currently, 46 per cent of all women at the Bank occupy professional positions compared with 59 per cent of all men. There continues to be an over-representation of women in the clerical/administrative occupational group with 45 per cent of all women employed in clerical positions, compared with only 15 per cent of men.
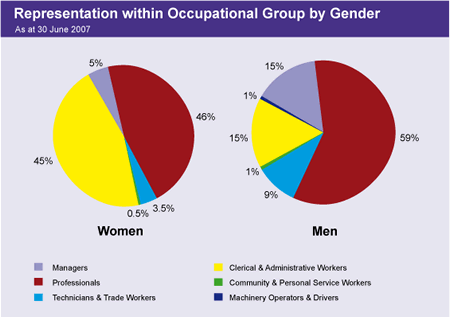
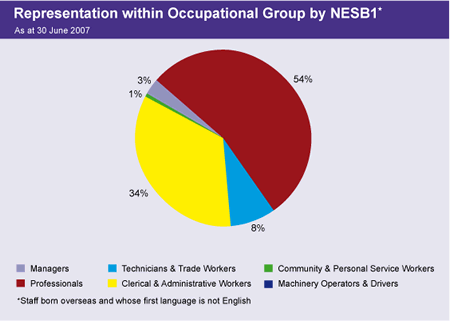
The NESB1 group is highly represented in the professional occupational category with 54 per cent of all NESB1 staff employed in professional roles. Thirty four per cent are currently employed in clerical/administrative positions and three per cent represented in management positions. NESB1 employees are not equally distributed across the Bank but cluster in the information technology, accounting and audit departments.
Section 2.3: Age & Tenure
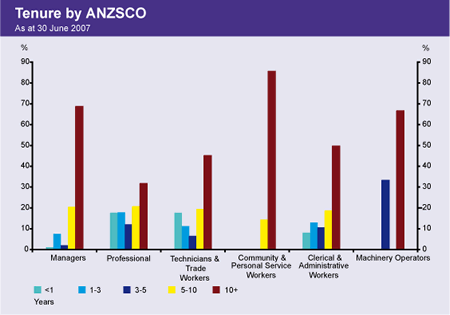
Age distribution and length of service data provide an interesting profile of the Bank and help determine strategies for succession planning and recruitment.
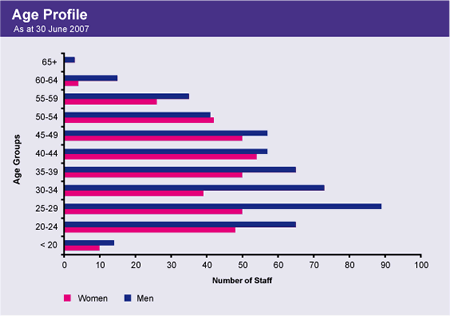
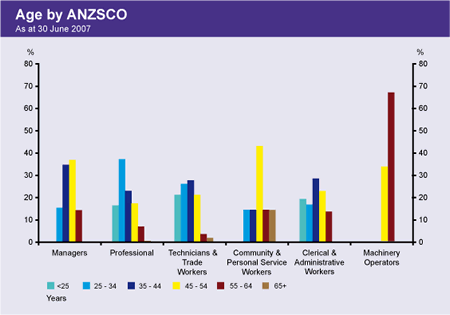
At the end of the 2006/07 year, 44 per cent of Bank staff were under the age of 35. As a group, male staff are younger than female staff, with 47 per cent of men compared with 39 per cent of women under the age of 35. The median age overall is 37. Comparatively, the ABS Census 2006 data reveals that the median age of the general population is 37 while the APS had a median age of 42 as at June 2006. The percentage of Bank staff who are aged more than 55 years of age (eligible for retirement) is now nine per cent, compared with 8.4 per cent last year. It is expected that over the next five to 10 years, up to 28 per cent of current staff will be eligible for retirement.
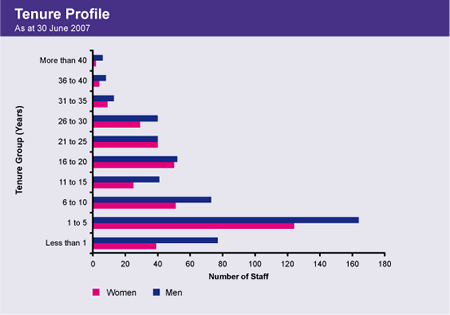
Length of service statistics provide a snapshot of the Bank's changing workforce. In 2000, 31 per cent of staff had been at the Bank for 20 years or more, while 35 per cent had less than five years service. Almost half of all staff (48 per cent) had less than 10 years service. Today, 25 per cent of all staff have been at the Bank for 20 years or more, while the percentage of staff with less than five years service has increased to 55 per cent. The average tenure of Bank staff is 11.4 years, a slight decrease from previous years.
Section 2.4: Educational Qualifications
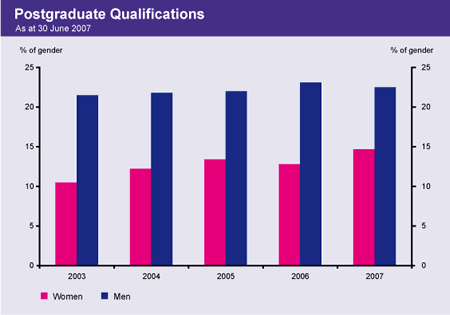
Sixty-seven per cent of staff were recorded as having a post-secondary or tertiary qualification for this reporting period, the same as last year. Overall, 54 per cent of staff now hold a Bachelor Degree or higher, while 19 per cent hold a post-graduate qualification.
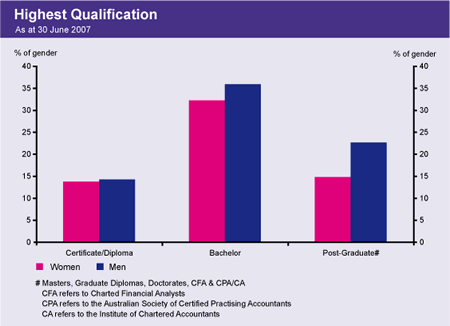
There is no significant difference in the percentage of women when compared with men holding Certificate/Diploma and Bachelor qualifications. However, a significant gap still exists in post graduate qualifications where only 15 per cent of women compared with 23 per cent of men hold post graduate qualifications – but this gap is narrowing. The time-series analysis of this data reveals that while the number of men holding post-graduate qualifications has remained static in the past five years, the number of women with post-graduate qualifications has increased significantly over the same period.
