Reserve Bank of Australia Annual Report – 2005 Operations in Financial Markets
The Reserve Bank has an active presence in financial markets resulting from its operations to implement monetary policy, its provision of banking and other services to clients (mainly the Australian Government) and the management of its balance sheet.
Domestic Markets Operations
While market operations have been used to implement monetary policy since the mid 1980s, the nature of these operations has had to evolve over that time to take account of changing market circumstances. In the case of operations in domestic markets, the main challenge over recent years has been to implement monetary policy without placing undue stress on the market for Commonwealth Government securities (CGS), which has contracted significantly since the late 1990s. Mostly this challenge has been met by broadening the range of securities in which the Reserve Bank has been prepared to deal. The past year saw a further move in this direction, with outright holdings of longer-dated domestic securities broadened in September 2004 to include semi-government paper; previously, outright holdings of longer-dated paper had been limited to CGS. Around that time, the Australian Office of Financial Management (AOFM) also sought further to alleviate stress on the CGS market by introducing a new securities lending facility, which is operated by the Reserve Bank.
Monetary Policy Implementation
Decisions by the Reserve Bank Board on the appropriate setting of monetary policy are made and communicated in terms of a target for the cash rate – the interest rate payable on overnight, unsecured loans between banks. The cash rate is an important determinant of other wholesale and retail interest rates, which, in turn, influence the level of economic activity and inflation.
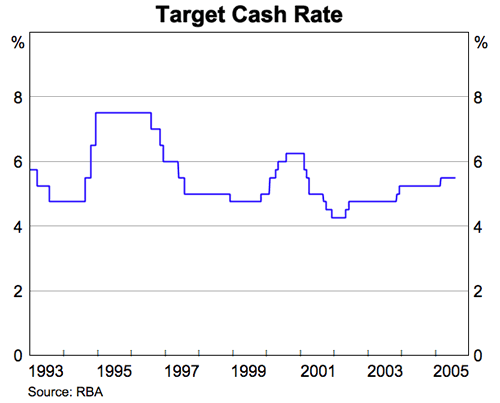
The target for the cash rate was changed only once in 2004/05 – an increase from 5.25 per cent to 5.50 per cent following the March 2005 Reserve Bank Board meeting. Prior to that, the target had been unchanged since December 2003. The rationale for changes in policy is provided at the time by media releases, and subsequently in the Reserve Bank's quarterly Statement on Monetary Policy and in appearances by the Governor before the House of Representatives Standing Committee on Economics, Finance and Public Administration.
Monetary policy decisions are implemented through operations that affect the supply of funds available to banks in the domestic market. The specific funds in question are those held by banks in their Exchange Settlement accounts at the Reserve Bank. These funds, known as Exchange Settlement (ES) funds, are the means by which banks settle their obligations with one another and with the Reserve Bank.
As these deposits earn interest at slightly below market rates, banks seek to hold only enough to meet their day-to-day settlement needs – in aggregate typically around $700–800 million. If the supply were to fall below this for any sustained period, individual banks would tend to increase the interest rate at which they are prepared to borrow in the money market to try to restore their holdings. Conversely, if supply rose excessively, banks would seek to dispose of the excess by reducing the rates at which they are willing to borrow and lend.
The domestic markets transactions used by the Reserve Bank to manage the supply of ES funds may be either outright purchases or sales of securities, or more usually repurchase agreements or ‘repos’, involving the purchase or sale of a security with an undertaking to reverse the transaction at a future agreed date and at an agreed price. Domestic operations may also be augmented with foreign exchange swaps.[1]
These arrangements for implementing monetary policy have proved to be effective, with volatility in the cash rate low by international standards. As in the previous year, measured volatility was close to zero in 2004/05, with the vast majority of overnight transactions in the cash market taking place at the target rate.
| Number of Times Used |
Value(a) ($ million) | |
|---|---|---|
| 2000/01 | 18 | 2,611 |
| 2001/02 | 11 | 673 |
| 2002/03 | 14 | 1,673 |
| 2003/04 | 24 | 2,159 |
| 2004/05 | 11 | 1,394 |
| (a) First leg of transaction | ||
Open market operations are conducted mid morning, with the size of each operation being based on the expected availability of ES funds for the day. A second round of operations may be held later in the day to offset unexpected flows or shifts in demand for ES balances, but such events are rare; in 2004/05, there was only one second-round operation. Banks also have a standing facility under which they can borrow funds overnight from the Reserve Bank, on a secured basis, at their discretion but at a 25 basis point penalty. Banks typically use this facility when there are technical factors that prevent them from sourcing funds in the market. This facility was accessed on 11 occasions during 2004/05.
Each morning, the Reserve Bank publishes its expectation of changes in the supply of ES funds and the types of operations that it is proposing to offset these flows, and invites approaches from the market at preferred maturities. Once bids or offers have been received from market participants, they are ranked in order of attractiveness in terms of yield and transactions are accepted up to the value needed to maintain ES balances in the desired range. Bids or offers are ranked relative to market yields for the relevant maturity. As such, for maturities other than overnight, the yields at which the Reserve Bank buys or sells securities may differ significantly from the target cash rate. The Reserve Bank does not try to influence the shape of the short – term yield curve directly by setting yields at which it is prepared to buy or sell. To do so would deprive it of an important source of market information. One consequence of this approach is that details of the yields at which the Reserve Bank buys or sells do not contain any information about its assessment of the likely future course of monetary policy.
The Reserve Bank provides banking services to various governments, official institutions and overseas central banks. Flows of funds between these customers and the community directly affect the level of ES balances held by the commercial banking sector. A run-up in customer deposits with the Reserve Bank, for instance, withdraws funds from the banking sector. During 2004/05, customer deposits at the Reserve Bank rose substantially and to offset these and other flows during the year, the Reserve Bank was required to be a net purchaser of assets from the market. These included about $3 billion of domestic assets, mostly State government and commercial bank paper bought under short-term repurchase agreements, and $8 billion of foreign assets. Apart from around $2.4 billion of foreign currency that was bought outright over the year to replenish foreign currency reserves, the rest was bought under swap agreements. As noted earlier, the Reserve Bank uses foreign currency swaps to supplement domestic markets operations so as to avoid the undue pressure on domestic markets that might arise if all its buying were concentrated in domestic assets.
The Reserve Bank's total turnover in domestic securities and in foreign exchange swaps for open market operations was about $510 billion in 2004/05, an increase of 20 per cent from the previous year. As well as an increase in day-to-day ES flows, the rise in turnover was due to a shortening of the average maturity of repos.
The shortening of the maturity profile was primarily in response to a preference in the market for short-dated repos. Longer-term repos – with terms of around 90 and 180 days – had been offered in recent years at the behest of market participants to facilitate market development, but demand for such repos proved to be limited.
| 2000/01 | 2001/02 | 2002/03 | 2003/04 | 2004/05 | |
|---|---|---|---|---|---|
| Repurchase agreements(a) | |||||
| – Purchases | 376 | 423 | 304 | 272 | 391 |
| – Sales | 17 | 16 | 17 | 11 | 10 |
| Outright purchases(b) | 5 | 1 | 3 | 5 | 5 |
| Total operations in domestic securities | 398 | 440 | 324 | 287 | 405 |
| FX swaps(a) | 90 | 90 | 90 | 139 | 106 |
| Total | 488 | 530 | 414 | 426 | 511 |
|
(a) First leg of transaction. (b) CGS only until 2002/03. Thereafter includes State and Territory government securities. |
|||||
While a shorter maturity profile for repos increases the roll-over task of the Reserve Bank, this has not raised any specific difficulty, partly owing to the widening in the range of securities eligible for repo in recent years. The repo book rose from an average of $11 billion in 2003/04 to around $15 billion in 2004/05. Of this, about $5 billion were repos in bank bills and certificates of deposit (CDs), following the decision in March 2004 to include such securities in repo operations. The weighted average rate at which repos involving bank instruments were accepted was around 7 basis points above the weighted average rate offered on the ‘next best’ repo collaterised by CGS.
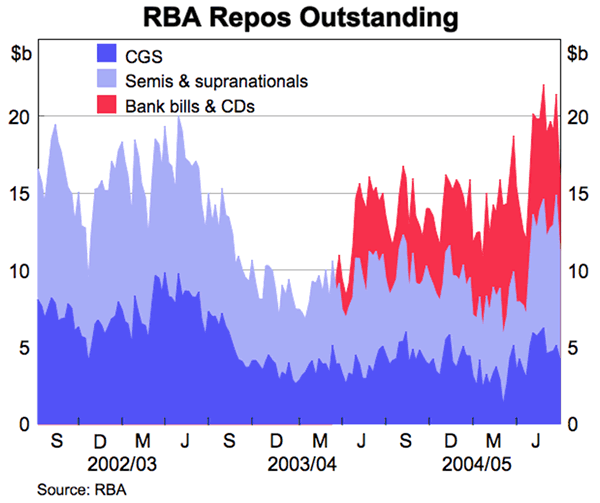
Had the Reserve Bank continued to confine its market operations to CGS, rather than expanding the pool of eligible instruments to encompass other domestic securities and foreign exchange swaps, its holdings of CGS by end 2004/05 would have accounted for over 80 per cent of all CGS outstanding.
Long-dated Liquidity Operations
As noted in the introduction, the Reserve Bank has made a number of changes to its domestic dealing arrangements in recent years to keep pace with market developments and changes in the structure of its balance sheet. One of these measures has been to broaden the range of long-term domestic securities held on an outright basis to include domestic issues by Australian State and Territory government central borrowing authorities. This change took effect in September 2004.
The decision to broaden outright holdings was aimed at rebuilding the Reserve Bank's domestic securities portfolio. Traditionally, the only domestic securities the Reserve Bank had held on an outright basis had been CGS. Over the past 10 years or so, however, as the amount of CGS on issue has declined, the Reserve Bank has reduced its purchases of these securities. As a result, its holdings on an outright basis had fallen to around 4 per cent of its total assets, compared with 40 per cent a decade ago.
Before deciding to undertake outright purchases of longer-dated semi-government securities, the Reserve Bank consulted widely with State borrowing authorities and bond market participants. A number of measures have been taken to ensure that the Reserve Bank's purchases are transparent and have minimal impact on secondary market activity: purchases are through mini-tenders; they take place on a regular basis, around once a month; they are carried out with a view to maintaining the maturity structure of the Reserve Bank's holdings at about the same as the market's; and purchases generally do not exceed $150 million in total at each operation. Eight operations involving long – dated securities were undertaken between September 2004 and June 2005, with total purchases of $700 million (see table).
| Date of Operation | Range of Maturities Accepted |
Amount Purchased (face value, $ million) | Weighted Average Yield Accepted (per cent) | Bid-to-Cover Ratio |
|---|---|---|---|---|
| 22 September 2004 | March 2008 to August 2008 | 102 | 5.392 | 16 |
| 26 October 2004 | December 2010 to May 2012 | 100 | 5.495 | 10 |
| 25 November 2004 | July 2009 | 50 | 5.330 | 13 |
| 24 February 2005 | March 2008 to May 2010 | 151 | 5.717 | 7 |
| 29 March 2005 | May 2010 | 101 | 5.950 | 8 |
| 28 April 2005 | June 2013 to October 2015 | 102 | 5.636 | 6 |
| 30 May 2005 | September 2007 | 50 | 5.385 | 18 |
| 27 June 2005 | October 2007 | 50 | 5.310 | 15 |
As discussed in the chapter on ‘Risk Management’ (see section on ‘Balance Sheet Risks’), the ongoing acquisition of longer-dated (domestic) securities will see some reversal of the trend towards lower interest rate risk in the Reserve Bank's portfolio of domestic assets. But this rise is quite modest, with the sensitivity of the portfolio to changes in interest rates still considerably lower than a decade ago.
Securities Lending
The Reserve Bank maintains a securities lending facility through which it is prepared to lend to market participants any issue of domestic securities that it holds on an outright basis. This activity assists market participants to meet their settlement obligations in government bonds. Until recently, the Reserve Bank priced its stock lending so as to be the most expensive lender in the market and thereby avoid displacing private activity. This made it the securities lender of last resort.
In October 2004, securities lending operations were changed to improve the availability of securities to the market. The role of lender-of-last-resort for Treasury bonds was assumed by the AOFM, with the introduction of a facility to lend CGS from the Government's holdings. The AOFM's facility, which is operated by the Reserve Bank, allows participants to obtain access to specific lines of Treasury bonds when they are not readily available in the market, but at a significant penalty relative to market prices for stock lending.
With the introduction of the AOFM's facility, the Reserve Bank discontinued lending stock at penalty rates and began lending from its portfolio at market prices. As a result, the value of stock lent by the Reserve Bank more than doubled in 2004/05, to $12 billion, though earnings on individual transactions fell as the securities were no longer priced on a last-resort basis. The average maturity of each loan was around 10 days. Most of the transactions were loans of CGS, although around $450 million of the Reserve Bank's newly acquired holdings of semi-government securities were also lent to the market. In addition to this, the Reserve Bank lent over $900 million of stock on behalf of the AOFM.
| Number of Transactions |
Amount Lent (face value, $ billion) | Net Income ($ million) | |
|---|---|---|---|
| 2000/01 | 75 | 1.2 | 0.1 |
| 2001/02 | 119 | 3.1 | 0.3 |
| 2002/03 | 32 | 0.9 | 0.1 |
| 2003/04 | 185 | 5.0 | 0.5 |
| 2004/05 | 264 | 11.9 | 0.6 |
Foreign Exchange Operations
The Reserve Bank operates in the foreign exchange market both on behalf of clients and on its own account. Client transactions are mainly for the Australian Government, which has a large ongoing need for foreign exchange for defence expenditure, foreign aid payments and the cost of embassies. In the past year, this amounted to around $4.2 billion. In the previous couple of years the Government's foreign exchange needs had been substantially higher owing to the repayment of foreign currency swaps. The Reserve Bank covered sales to the Government during the past year by buying foreign exchange in the market, so these sales had no net impact on its holdings of foreign exchange. This is the normal practice unless the exchange rate is unusually low, in which case the Government's needs are met directly from foreign exchange reserves in the first instance.
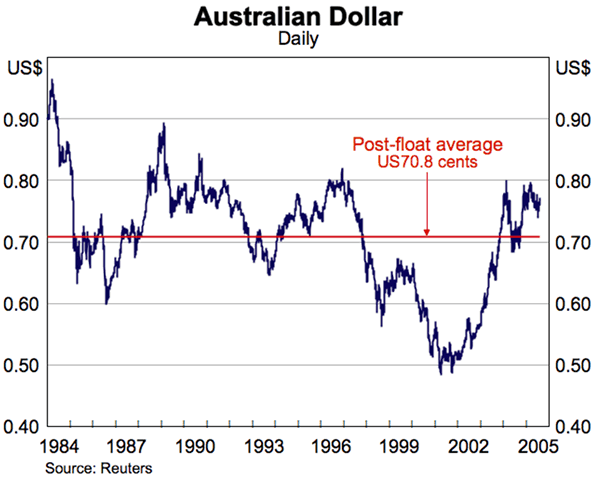
Transactions on the Reserve Bank's own account fall into three main types. The most prominent are those intended to influence the exchange rate of the Australian dollar. These transactions, referred to as intervention, are typically undertaken only when the exchange rate has moved a long way from its long-term average and in a manner inconsistent with economic developments. Over the past year the behaviour of the Australian dollar did not warrant any such operations.
Other transactions on own-account are those undertaken to restore foreign reserve holdings after a period of intervention. This has been the main type of transaction the Reserve Bank has been undertaking since early 2002. These operations involve purchases of foreign exchange in a low-key way, usually in small amounts spread out over a period of time. While they are intended primarily to rebuild reserves, they may at the margin nonetheless have some effect on the exchange rate.
Having rebuilt foreign exchange reserves during 2003/04 to levels that took them into the range which is seen as broadly adequate, the Reserve Bank was content to be opportunistic in adding further to its reserve holdings during 2004/05, doing so during periods of strength in the exchange rate. Most of the purchases were in late 2004 and in February–March 2005, when the exchange rate was around its highs for the year. Net market purchases over the year were A$2.4 billion, at an average exchange rate of around US78 cents. At the end of June net foreign reserves (i.e. official reserve assets excluding those held under foreign currency swaps) were A$26.4 billion.
Foreign currency swaps are the third type of transaction on the Reserve Bank's own account. These do not involve the outright purchase or sale of foreign currencies, but the exchange of two currencies for an agreed period, with the exchange rate for the reversal of the transaction also agreed.[2] As discussed earlier in this chapter, the Reserve Bank makes use of foreign currency swaps to help in domestic liquidity management. For example, if the banking system is short of funds, the Reserve Bank will undertake a swap in which it provides Australian dollars in exchange for foreign currency. This has the same effect on domestic liquidity as using domestic markets operations to buy government securities under a repo agreement.
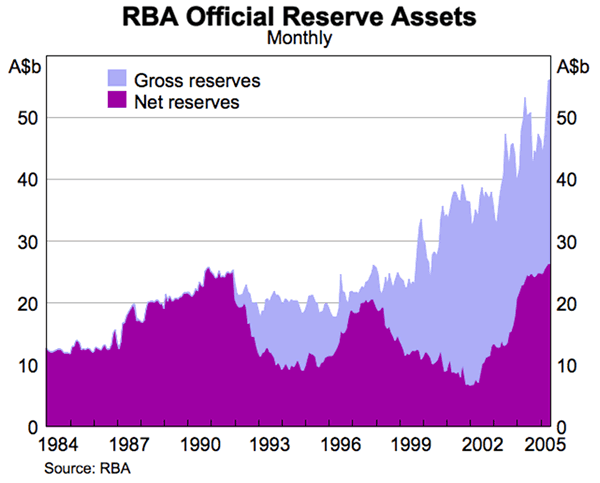
Although the Reserve Bank continued to make substantial use of foreign currency swaps for domestic liquidity management in 2004/05, total turnover in swaps, at $106 billion, was lower than in the previous year. This was because the average term of swaps was a little longer and fewer roll-overs of maturing swaps were required. Swaps outstanding at the end of June 2005 were A$29.8 billion, a little higher than a year earlier. Reflecting these holdings of foreign exchange, together with the $26.4 billion held as net reserves, total official reserve assets stood at $56.2 billion, up from $50.3 billion a year earlier.
Reserves Management
The Reserve Bank holds foreign currency reserve assets to facilitate its intervention in the foreign exchange market. These assets may be required at short notice and consequently priority is given to liquidity and security when managing them. Within these constraints, the reserves are managed with the aim of maximising returns. To reflect this, a benchmark has been designed that optimises the risk/return trade-off given the overall liquidity and security constraints. This benchmark is reviewed on a regular basis.
The benchmark specifies the allocation of the reserves portfolio across currencies and assets. Since February 2002 the allocation has been 45 per cent to the United States, 45 per cent to Europe and 10 per cent to Japan. The assets that can be held are securities issued by the US, Japanese, French and German governments and their agencies, repurchase agreements, commercial bank deposits with highly rated banks, and investments at the Bank for International Settlements. The duration of the portfolio in each currency is set at 30 months.
| US | Europe | Japan | |
|---|---|---|---|
| Asset allocation (% of total) | 45 | 45 | 10 |
| Currency allocation (% of total) | 45 | 45 | 10 |
| Duration (months) | 30 | 30 | 30 |
The return on foreign currency assets rose over the past year from the low level of 2003/04. In the US portfolio, the return was 4.1 per cent, with higher short-term interest rates and capital gains on longer-dated securities both contributing to the result. In the European portfolio the return was 5.8 per cent, with the result again boosted by capital gains on long – term bonds; interest rates at shorter maturities in Europe remained little changed at historically low levels. In Japan, the return rose to 1.1 per cent, again primarily owing to capital gains on bond holdings, with short-term interest rates remaining close to zero.
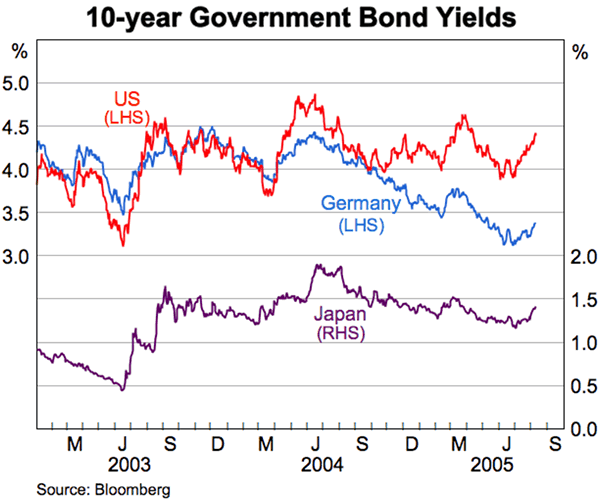
The constantly changing size and composition of reserves, owing to both valuation effects from movements in exchange rates and yields and the Reserve Bank's daily operations, means that for practical reasons the actual portfolio is maintained in a narrow range around the benchmark rather than precisely in line with the benchmark at all times. This gives portfolio managers a small amount of discretion to manage investments associated with the day-to-day flows of funds. Decisions taken by portfolio managers under the trading discretion available to them added $38 million, or 14 basis points, to returns for the year. This incremental return was achieved through transactions that took advantage of short-term market anomalies ($24 million) and returns from lending securities ($14 million). The extent to which the return exceeded the benchmark was lower than in the previous few years as income from both anomaly trading and securities lending was down. The latter was mainly because the increased supply of US government securities, reflecting on-going budget deficits, has reduced the instances where specific lines of stock end up in short supply in the market. The result for the year was also adversely affected by exchange rate changes, as the higher value of the Australian dollar reduced the value of income earned in foreign currency.
| US | Europe | Japan | |
|---|---|---|---|
| 2000/01 | 8.60 | 5.65 | 2.27 |
| 2001/02 | 6.09 | 4.68 | 0.40 |
| 2002/03 | 6.65 | 7.19 | 1.34 |
| 2003/04 | 0.01 | 1.89 | 0.04 |
| 2004/05 | 4.06 | 5.77 | 1.10 |
As noted in last year's Annual Report, a small amount of foreign exchange reserves has been invested in the Asian Bond Fund (ABF). An initial investment of US$50 million was made in July 2003 in ABF1, a fund that invests in US dollar debt issued by a number of Asian sovereign and quasi-sovereign borrowers. This fund has performed well since its inception. In the latest financial year it returned 8.6 per cent, well in excess of the 4.1 per cent earned on the core US dollar reserves portfolio, which is invested in assets in the United States.
Towards the end of 2004/05 the Reserve Bank invested US$222 million in a second fund (ABF2), which invests in local currency bonds issued by Asian governments and their authorities. It is too early to assess the returns on the ABF2 investment.
| Rates of Return in SDR (per cent) | Value of Difference (A$ million) | ||
|---|---|---|---|
| Actual | Benchmark | ||
| 1991/92 | 9.8 | 8.9 | 165 |
| 1992/93 | 16.3 | 11.6 | 420 |
| 1993/94 | 4.0 | 3.8 | 31 |
| 1994/95 | 5.2 | 7.4 | −331 |
| 1995/96 | 4.0 | 3.7 | 40 |
| 1996/97 | 4.5 | 4.2 | 34 |
| 1997/98 | 4.5 | 4.6 | −19 |
| 1998/99 | 4.9 | 5.1 | −26 |
| 1999/00 | 2.8 | 3.8 | −202 |
| 2000/01 | 11.0 | 10.8 | 74 |
| 2001/02 | 3.9 | 3.7 | 63 |
| 2002/03 | 6.7 | 6.4 | 77 |
| 2003/04 | 0.5 | 0.3 | 67 |
| 2004/05 | 4.7 | 4.5 | 38 |
Gold
The Reserve Bank holds around 80 tonnes of gold, which is currently valued at around A$1.5 billion. As the US dollar depreciated during the first half of 2004/05, the gold price rallied from around US$400 per ounce to above US$450 per ounce before settling back to around US$435 at year end. The Australian dollar price of gold closed the year virtually unchanged around A$570 per ounce.
The Reserve Bank makes collateralised gold loans to major banks in the gold market. Demand for gold loans is highly dependent on the hedging policies of major gold producers and end users. With the gold price remaining buoyant in US dollar terms, there has been little hedging activity from miners and interest rates on gold loans have continued to fall. Interest rates for one – year loans averaged only 0.05 per cent, compared with 0.50 per cent and 0.20 per cent in 2002/03 and 2003/04 respectively. With interest rates so low there has been little incentive on a risk/reward basis for the Reserve Bank to roll-over maturing loans, and some 15 tonnes have been repaid over the year. Returns from gold lending in 2004/05 were A$15.5 million, compared with A$16.1 million in 2003/04.
Footnotes
The Reserve Bank adds to ES balances through a foreign exchange swap by providing Australian dollars to banks in exchange for foreign currency, with an agreement to reverse the transaction on an agreed forward date and at an agreed exchange rate. Such transactions have no effect on the exchange rate. [1]
The exchange rate for the reversal is determined by adjusting the current exchange rate for the interest rate differential between the two relevant countries for maturities similar to the swap. Because the exchange rate for the reversal is fixed, foreign exchange held under swaps does not expose the Reserve Bank to risk of capital loss from adverse exchange rate movements. [2]