Bulletin – November 2004 US Capital Flows[1]
- Download 64KB
Introduction
Discussion of the US balance of payments tends to focus mainly on the current account deficit, which has increased to around 5¾ per cent of GDP from around 1½ per cent of GDP a decade ago (Graph 1). There is less focus on the matching increase in the US capital account surplus. For a country with a floating exchange rate, the current account and capital account positions are equal and offsetting, and simultaneously determined by a wide range of factors affecting the economy.[2]
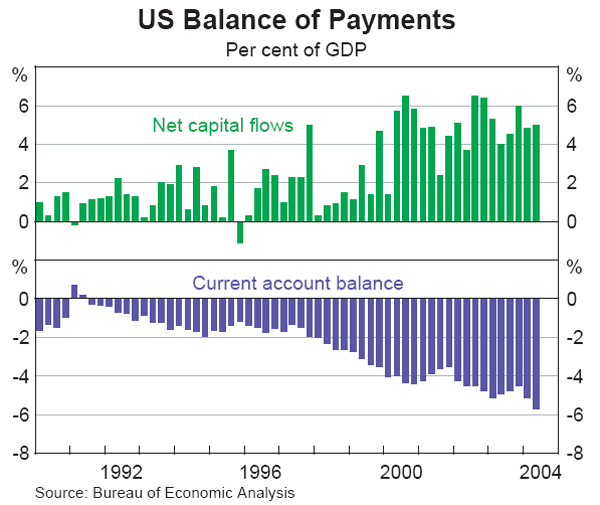
This article looks at recent trends in US capital flows, and in particular at the composition of the large increase in net capital inflows into the US since the second half of the 1990s.
Capital flows can usefully be divided into four categories:
- Official sector flows. These are cross-border purchases and sales of financial instruments by central banks and government agencies. Official inflows to the US consist predominantly of purchases of US Treasury securities by foreign government entities, particularly central banks.
- Private equity flows. These take the form of either foreign direct investment (where the equity holding in the target company is greater than 10 per cent) or portfolio equity investment.
- Private sector portfolio debt flows. These comprise primarily the purchase and sale of debt instruments such as government bonds and corporate bonds by private entities. Historically, these have been the largest source of capital inflow to the US.
- Other private sector flows. These consist largely of flows channelled through the banking system and money market. The majority of these flows are short-term inter-bank flows, and take the form of either deposits or loans.
Capital flows can also be separated into investment by foreigners in the US (i.e. inflows of funds) and investment by US residents in other countries (i.e. outflows of funds). Both inflows and outflows increased over the past decade (Graph 2), in keeping with the globalisation of world capital markets which has seen investors increase the proportion of their investment that takes place in countries outside of their place of residence. This phenomenon is sometimes also described as a reduction in ‘home-country bias’ among investors, and is evident in most developed economies. For example, in Australia, the proportion of funds invested offshore by superannuation funds, life offices and other investment vehicles has doubled over the past 15 years to around 20 per cent.
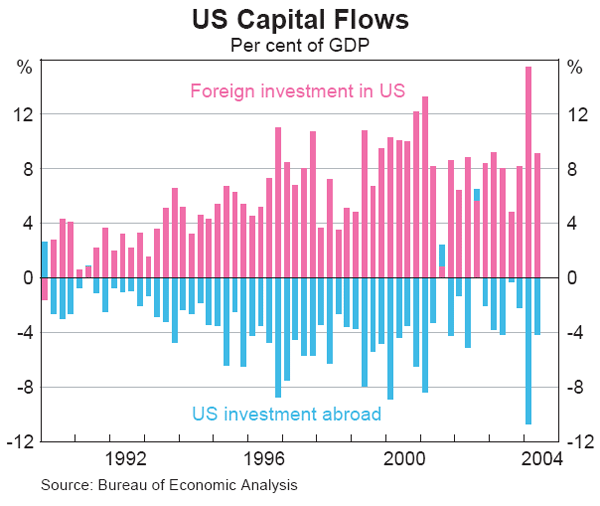
The US has benefited more than most from this global trend, reflecting the strong performance of its economy over the second half of the 1990s and the relative attractiveness of US capital markets because of their size, liquidity and transparency. US capital markets have a higher weight in the global indexes followed by investors than would be suggested by the size of US GDP. For example, while the US economy accounts for 30 per cent of global GDP, the US share market accounts for 54 per cent of the MSCI global equity market index against which many global equity investors benchmark themselves.[3]
In sum, these considerations have made the US relatively attractive to foreign investors, with the result that capital inflows into the US have grown at a faster pace than capital outflows from the US, thereby leading to a growing net inflow of capital. The most noteworthy developments in capital inflows into the US have been (Graph 3):
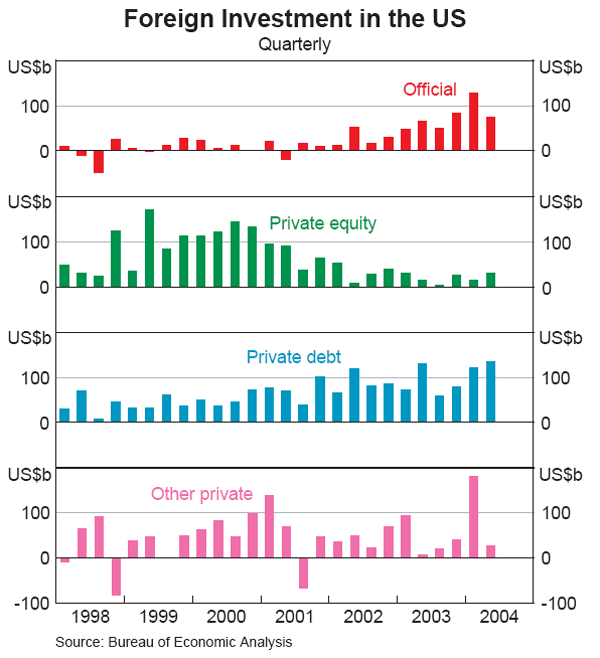
- the large rise in official capital inflows over the past couple of years, predominantly reflecting the purchase of US debt by Asian central banks as part of their actions in the foreign exchange market over the period;
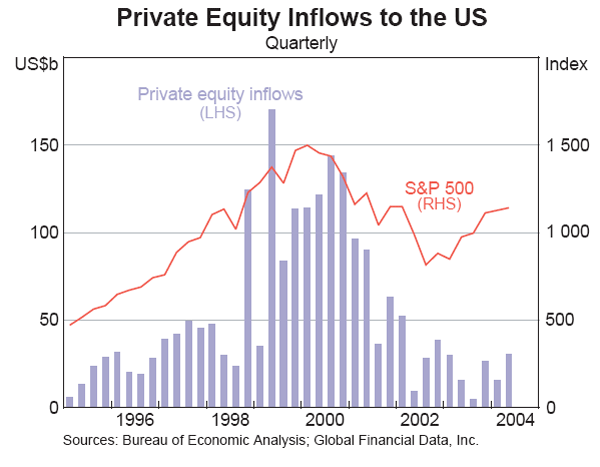
- the surge in private equity inflows in the late 1990s and their subsequent decline; and
- the continuing strong private portfolio debt inflows in recent years, but with a notable change in the type of debt purchased.
Official Sector Inflows
The US has typically been a net recipient of official sector inflows, reflecting the role of the US dollar as a global reserve currency. Over the 1990s, these inflows averaged around ¾ per cent of GDP per year, making them a relatively small component of capital inflow into the US. Over the past two years, however, there has been a very large increase in official capital inflows to the US. Annual official inflows increased from around $US25 billion in 2001 (where they had been for much of the previous decade) to nearly $US250 billion in 2003. In the March quarter of 2004, official inflows reached an annual rate of about $US500 billion (4.5 per cent of GDP) before easing to around half that rate in the June quarter.[4]
The large increase has primarily comprised the purchase of US government securities by Asian central banks (Graph 4), reflecting their substantial intervention in foreign exchange markets over the period. This intervention has been motivated by the desire either to maintain fixed exchange rates to the US dollar or to limit upward pressure on floating exchange rates. Accordingly, Asian central banks have sold their domestic currencies and purchased US dollar assets in the form of US securities or US dollar-denominated bank deposits. The majority of these flows have been into US Treasuries. Japanese holdings of US Treasuries have increased by over US$400 billion since the beginning of 2002, while Chinese holdings have increased by close to US$100 billion. India, Korea and Taiwan have also amassed large holdings in the recent period.
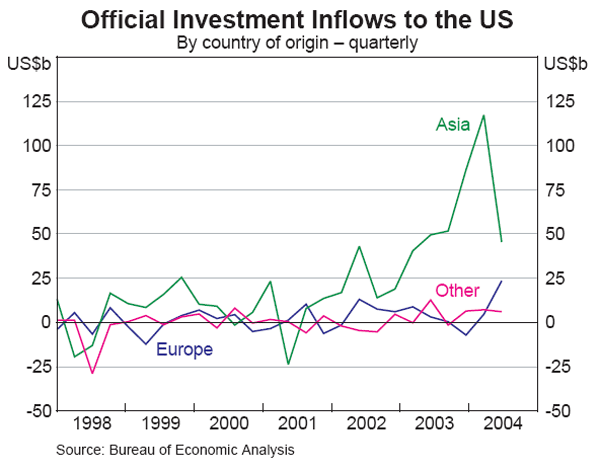
The moderation of official capital flows in the June quarter coincided with the stabilisation of the US dollar after its large depreciation through 2003 and early 2004. The Bank of Japan ceased its intervention in the foreign exchange market and the pressure on other currencies in the region to appreciate against the US dollar subsided.[5] Despite this moderation, official inflows to the US still remain high by historical standards.
There have been other periods of sustained increases in official inflows into the US. For instance, in the mid 1980s, the G7 central banks engaged in concerted intervention to halt the rapid depreciation of the US dollar, a process co-ordinated as part of the Louvre Accord. The distinguishing feature of the current period is that, in contrast to the 1980s episode, the intervention has been unilateral and unco-ordinated.
Private Equity Flows
During the late 1990s and into 2000, private equity flows to the US increased sharply, reflecting the perceived attraction of the US equity market at the time. They became the largest source of capital inflows into the US. These foreign inflows, which included particularly large flows from Europe, may well have contributed to the final surge in US equity prices prior to the peak in early 2000. Since that peak, both portfolio and direct equity investment in the US have eased significantly and are now similar to where they were in the mid 1990s (Graph 5).
Private Debt Flows
Private debt inflows have been a consistent source of financing and are currently the largest source of capital inflows into the US. The composition of the debt inflow has altered over the years, away from government debt towards corporate bonds (Graph 6).
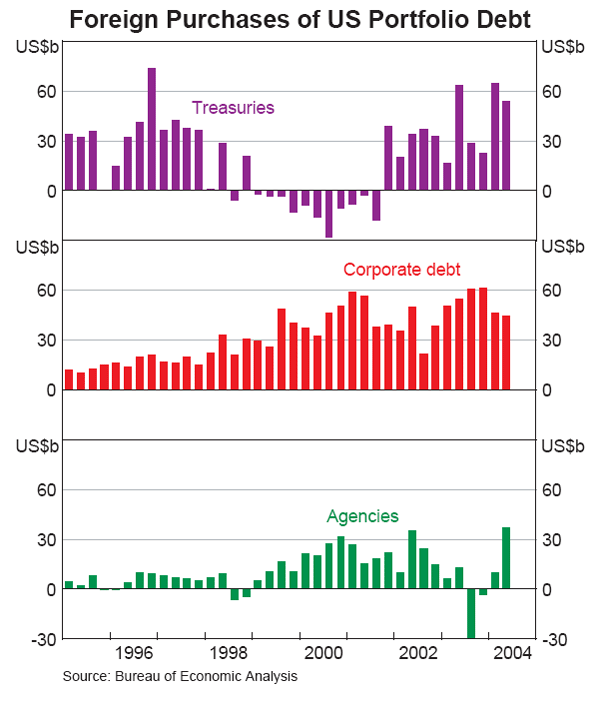
That change in composition of foreign debt purchases began in the late 1990s, and may in part have reflected the diminishing supply of Treasuries as the US Budget position moved into surplus. As a result, investors diversified into alternative debt instruments, including agency bonds (bonds with the implicit backing of the US government, but which are not direct obligations of the government) and corporate bonds. More recently, concerns about some of the largest issuers of agency bonds have seen purchases of these instruments decline, while purchases of Treasuries have recovered. Purchases of corporate debt have continued at high levels, as investors have sought higher yielding instruments in the low-yield environment of recent years.
Capital Flows by Region
While the above analysis disaggregates the balance of payments data by the type of investment, it is also possible to disaggregate the data by region (Graph 7). Capital flows to the US over the past decade have predominantly been sourced from Europe. However, since the beginning of 2002, the share of inflows coming from Asia has increased noticeably, again reflecting the large rise in official inflows from that region.
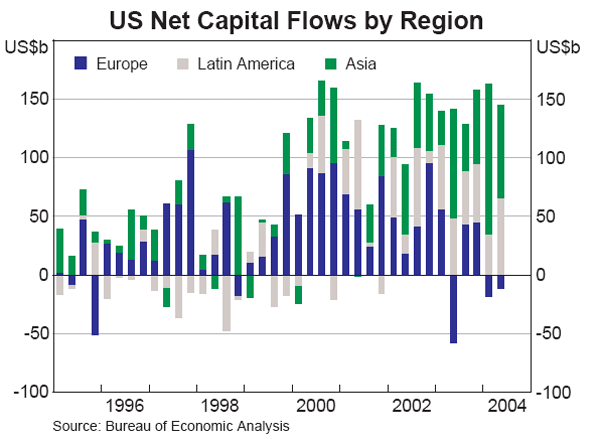
Capital outflows from the US have also predominantly gone to Europe, although at times there have been large flows of capital from the US to Latin America (but see below). Taking account of both the flows into and out of the US, Asia has been the largest source of net capital flows to the US in recent years.
There are limitations to analysing cross-border transactions by region, as the data are collected on a transactor basis, which indicates the residence of the initial foreign purchaser or seller, but not the ultimate foreign holder. The increasing use of financial intermediaries in third countries, such as the financial centres of the United Kingdom and the Caribbean (which is included in Latin America), means the data show disproportionate purchases and sales of securities to residents of these financial centres.
Net Foreign Assets
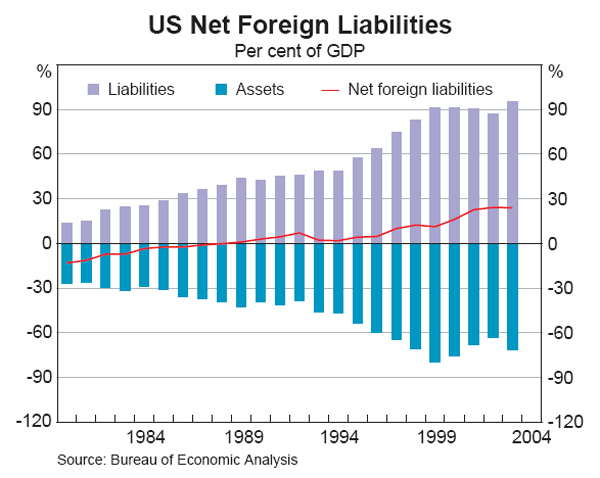
The large increase in capital inflows has boosted the stock of foreign liabilities of the US from 58 per cent of GDP in 1995 to 96 per cent of GDP in 2003. The stock of foreign assets held by US residents has increased by a smaller extent, growing from 54 per cent of GDP in 1995 to 71 per cent in 2003. Net foreign liabilities of the US – known as the net international investment position – have increased from 4 per cent of GDP to 24 per cent of GDP (Graph 8).
Despite the growing stock of net foreign liabilities, the US still receives net income inflows from the rest of the world. This is because the rate of return earned on US investment abroad substantially exceeds that earned by foreigners on their investments in the US. While the causes of this cannot be fully explained, this very favourable outcome for the US may be due to a number of possible reasons, including the following:
- Foreign investment in the US is heavily biased towards debt instruments including large holdings of short-term government debt by foreign central banks, returns on which have been relatively low in recent years.
- Rates of return on equity investments in the US by foreigners may be relatively low because a lot of this investment took place in the late 1990s and 2000 when asset values were inflated and earnings yields were low.
- The depreciation of the US dollar since 2002 has seen an increase in foreign income on assets of US residents held in foreign currencies, but because assets held in the US by foreigners are US dollar denominated, the income paid on them has been unaffected by exchange rate changes.
To date, the fact that net income flows have remained positive has limited the widening in the US current account deficit. The rapid rise in US foreign debt, and the prospect of increasing interest rates on that debt in the period ahead, raise the possibility that the net income balance may turn negative, contributing to a further widening of the US current account deficit. Against this, the fact that US liabilities to foreigners are denominated in US dollars, while US assets are mainly denominated in foreign currency means that any further depreciation of the US dollar will tend to boost the net income balance, leading to a narrowing of the current account deficit.
Footnotes
This article was prepared by Natasha Cassidy and Guy Debelle of International Department. It is based on information as of 10 November 2004. [1]
Small differences between the current account balance and the capital account may arise due to errors and omissions. The capital account is now generally referred to as the financial account in balance of payments statistics. [2]
However, if one examines investors' holdings of all financial assets, both domestic and foreign, the US is still underweight in other countries' portfolios, reflecting the large influence of home bias. [3]
The published data may even understate official purchases of US debt. This is because official purchases of US securities that occur through private intermediaries are classified in the data as private purchases. For example, if an Asian central bank purchased US Treasuries through an investment bank based in London, the transaction would be recorded as a private debt inflow sourced from the UK rather than as an official flow sourced from Asia. [4]
For example, the non-deliverable forward (NDF) rate for the renminbi against the US dollar moved closer to the fixed parity. This implies that the markets reduced their assessment of the probability of an appreciation in the currency, were it to be allowed to float or revalue. [5]