Bulletin – December 2008 Liquidity in the Interdealer Foreign Exchange Market[1]
- Download 550KB
Introduction
The interdealer segment of the spot foreign exchange market is where trades occur between foreign exchange dealers, as opposed to between dealers and their end customers, such as exporters and importers, asset managers, hedge funds, central banks and retail investors. Recent estimates indicate that this segment accounts for almost half of daily turnover in the Australian dollar/US dollar (AUD/USD) spot market (BIS 2007). A core function of the interdealer market is to provide a source of liquidity for dealers needing to trade away residual foreign exchange positions arising from transactions with end customers. Therefore, liquidity in the interdealer segment of the market is an important indicator of how well the broader foreign exchange market is functioning.
This article examines several indicators of liquidity in the interdealer foreign exchange market for AUD/USD. These indicators show that liquidity on the Reuters electronic broking system, where interdealer trading of the Australian dollar predominantly occurs, has significantly improved as electronic broking has matured as a method of executing trades. However, liquidity has deteriorated somewhat since the onset of financial market turbulence in August 2007. The second part of the article uses these indicators to examine liquidity in the AUD/USD interdealer market on two days in August 2007 when disorderly conditions led the Reserve Bank to buy AUD to support liquidity in the market. While this was the first time the Bank had intervened since 2001, on a number of occasions over the past year the global financial crisis has generated disorderly conditions in the interdealer foreign exchange market which have required the Bank to intervene to restore liquidity.
Liquidity in the Interdealer Market since 1997
Liquidity is a difficult concept to define and therefore measure. In general terms, a liquid market is one where transactions can take place readily, with low transaction costs and little impact on price. As in the markets for other financial instruments, liquidity in foreign exchange markets can be assessed in terms of: the difference between buy and sell prices (transaction costs); the ability for large transactions to be absorbed without affecting prices (‘depth’); the time taken for prices to return to normal after temporary order imbalances (‘resilience’); and the speed at which trades are executed (‘immediacy’).
To examine liquidity in the AUD/USD interdealer market we use trade and order data from the Reuters electronic broking platform, which are available from 1997.[2] We calculate three alternative indicators that attempt to capture different aspects of liquidity. These are: the number of trades; the ‘best bid-ask spread’; and the ‘price impact’ of each trade. Analysts often use the number of trades (or some other measure of turnover) as a proxy for liquidity, although strictly speaking, the number of trades does not measure any one of transaction costs, depth, resilience or immediacy on its own. The best bid-ask spread is a measure of transaction costs, and the price impact indicator is related to both market depth and resilience. The three indicators show that the long-run structural increase in the number of trades on the Reuters platform since 1997 has been associated with a marked improvement in liquidity, as indicated by the bid-ask spread and price impact measures, but that temporary spikes in the number of trades often coincide with periods of illiquidity and volatility.
The number of AUD/USD trades on the Reuters platform has averaged around 11,000 per day since January 2008, a twenty-fold increase since 1997 (Graph 1). Growth in overall spot market turnover, though rapid, has been much slower than this, indicating that growth in the number of trades on electronic platforms is largely the result of dealers substituting away from bilateral trading done over the telephone.[3] In what was a market with relatively low transparency, electronic broking platforms have provided dealers with transparent market prices, trade immediacy and pre-trade anonymity.
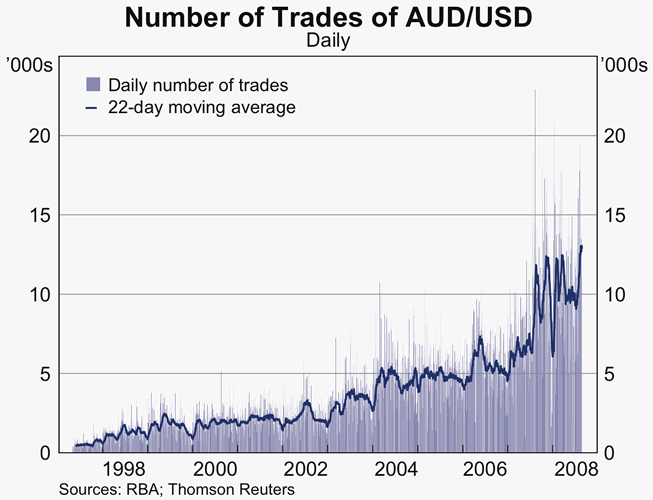
In addition to the long-run trend, there are large short-run fluctuations in the number of trades that are often (but not always) positively related to exchange rate volatility. For example, the daily number of trades picked up markedly in August and November 2007, and February, April and August 2008, all periods that correspond to episodes of heightened intraday volatility (Graph 2).
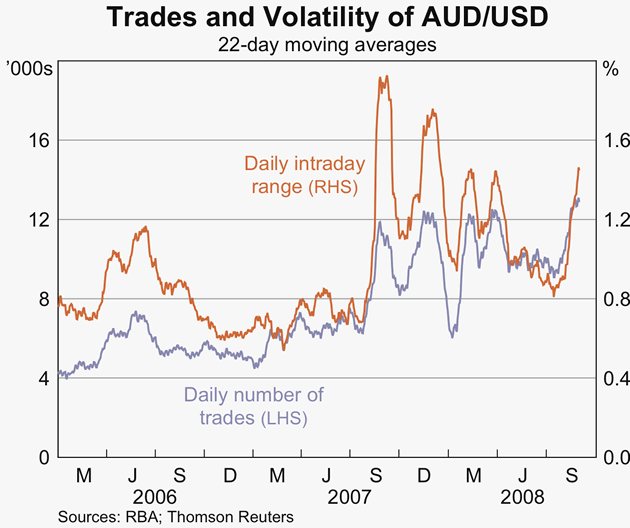
There are several reasons why the number of trades and volatility may be positively related in the short run. The first relates to dealers attempting to minimise risk when exchange rate volatility increases. Dealers may respond to higher volatility by breaking trades into smaller parcels in order to reduce the price impact of their trades as they adjust their foreign exchange inventory to the desired level. This will increase the number of trades but not total turnover. Dealers may also respond to higher volatility by lowering their holdings of foreign exchange to help minimise inventory risk. This will cause them to pass on customer trades more rapidly to the interdealer market, increasing both the number of trades and turnover in the interdealer market. Second, as exchange rate adjustment and the desire of investors to trade are both influenced by the arrival of new public information, such as the release of economic data or financial news, more frequent new information can drive increased volatility and trading activity. Finally, a distinct, though complementary, explanation is the potential for herd behaviour among investors. If, for example, a common financial shock precipitates large customer flows in one direction, the interdealer market may become ‘one-sided’, meaning that orders on one side of the market dry up and the number of sell (or buy) orders in the electronic broking platform are significantly greater than the number of buy (or sell) orders. In a one-sided market a large number of trades can still occur, but as the market lacks depth, each trade has a larger impact on the exchange rate than in a market with a more even distribution of orders. This is because the price jump to the next-best order following each trade will be relatively large, resulting in an increase in exchange rate volatility.[4]
All these explanations are likely to be relevant for understanding the increase in activity and heightened volatility in the foreign exchange market over the past year. Compared with earlier in the decade, the period since August 2007 has not only seen an increase in the frequency of financial news, but also significant uncertainty as to the implications of this news for the economic outlook, and by extension greater disagreement among market participants about the appropriate exchange rate response. But there is also evidence that on a number of occasions financial shocks have driven large one-way flows in currency markets as many traders have been forced to unwind positions based on popular trading strategies, such as ‘carry trades’. Regardless of which explanation is most applicable, it is clear that in the short run there is a positive association between the number of trades and periods of heightened volatility. However, as the two liquidity indicators discussed below show, in the long run, growth in the number of trades is associated with improved liquidity.
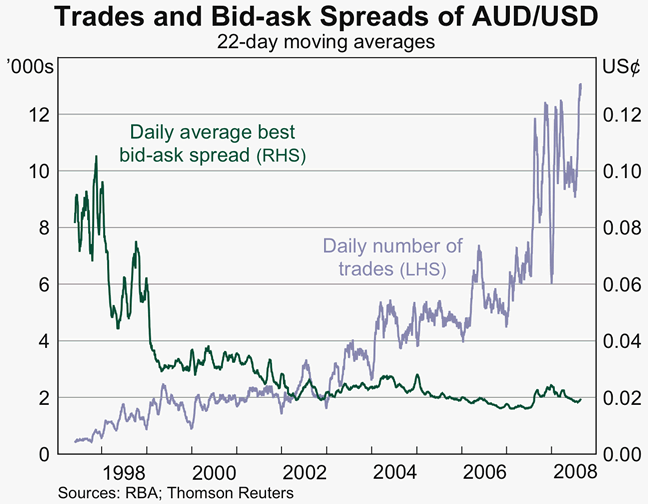
Our second measure of liquidity, the ‘best bid-ask spread’, measures the difference at a point in time between the lowest sell order and the highest buy order in the electronic broking system. Conceptually this indicator measures dealers’ own transaction costs. A narrower best bid-ask spread means that dealers can trade immediately at a rate closer to the ‘market’ exchange rate, resulting in lower costs and indicating a more liquid market.
The average daily best bid-ask spread tightened considerably over the past decade as the number of trades going through the electronic platform increased (Graph 3). Although the most pronounced contraction in the average best bid-ask spread came prior to 1999, spreads continued to fall, halving between 2000 and 2007, to an average daily best bid-ask spread of US 0.016 cents in July 2007. However, since August 2007, the average best bid-ask spread has widened to be back around 2005 levels. This widening suggests that liquidity in the Australian dollar market deteriorated somewhat following the onset of the financial crisis amid the heightened volatility.
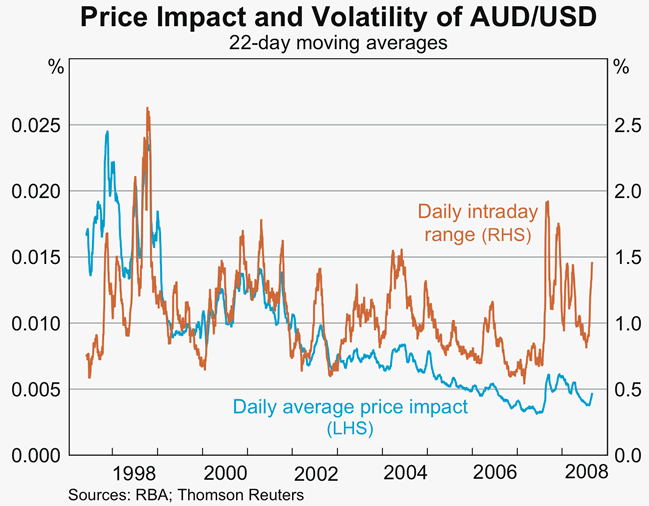
Our third indicator of market liquidity, the ‘price impact’, is calculated as the average absolute price change per trade. Assuming similar trade sizes, a deeper market (one with more orders around the current exchange rate) will have a smaller average price change per trade than a shallower market. Again, according to this measure, market liquidity has improved significantly over the past 11 years (Graph 4). Even the significant increase in volatility (measured here by the daily intraday range) since August 2007 saw only a relatively small pick-up in the average price change per trade as the number of trades going through the platform also increased sharply.
Liquidity during a Period of Market Stress
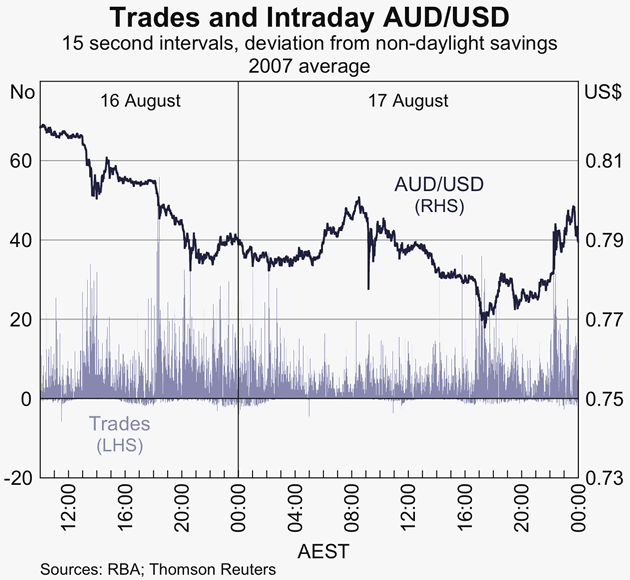
Although the liquidity measures outlined above are not available in real time owing to publication lags for the underlying data, they are nevertheless useful for retrospectively characterising liquidity during episodes of market stress. An example of such an episode is during 16–17 August 2007, when the AUD/USD fell by US 5½ cents amid significant intraday volatility. According to the Bank's routine liaison with market participants, these two days were somewhat unusual in that activity did not appear to be driven by new public information, but rather was the result of large flows associated with portfolio adjustment as many investors attempted to unwind similar positions. These large flows resulted in the market becoming one-sided, with contacts indicating market conditions were thin and disorderly.[5] Market liaison and available real-time data suggest that conditions were similarly disorderly on several days during October and November 2008.
While the reports of ‘thin’ market conditions may suggest a lower number of trades than usual were being executed, there was actually an increase in the total number of trades over the two days in question relative to the average number of trades in 2007 (Graph 5).[6] In addition, during several (but not all) of the periods of high intraday volatility the number of trades clearly spiked higher, rather than lower. This positive relationship between trades and volatility is consistent with the short-run relationship discussed above.
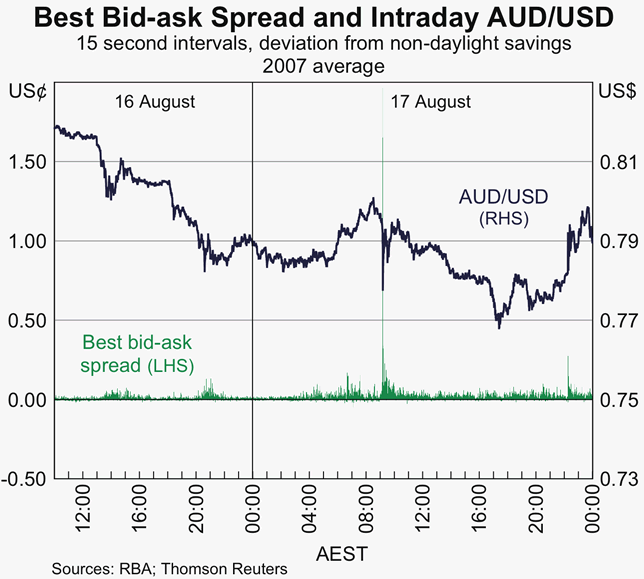
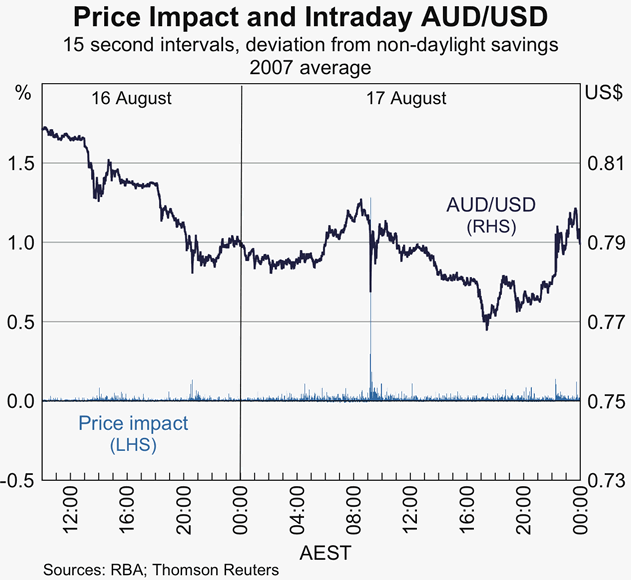
Our other two liquidity indicators clearly support the market liaison reports of illiquid conditions. The best bid-ask spread, which had averaged US 0.016 cents in June 2007, was elevated over the entire period, averaging US 0.030 cents. Further, the spread widened sharply on several occasions over the two days (Graph 6). The most dramatic of these was during the sharp drop in AUD/USD on 17 August, when the best bid-ask spread and price impact widened out sharply as buy orders briefly evaporated. The price impact of trades was similarly elevated relative to the average level over the two days (Graph 7). The spikes in price impact correspond with the widening bid-ask spreads and liaison reports of thin conditions.
Summary
Although liquidity in the foreign exchange market is a difficult concept to define and measure precisely, understanding the available liquidity indicators is essential to interpreting the behaviour of the AUD/USD spot market, particularly during periods of heightened volatility such as that seen since August 2007. Over the past 11 years liquidity in the electronic interdealer market for the AUD/USD has improved significantly as the market has matured. However, the liquidity measures analysed in this article indicate that average liquidity has deteriorated since the onset of financial market turbulence in August 2007 and that conditions on several days became particularly illiquid and disorderly. Nevertheless, prior to September 2008, the date up to which data are currently available, the deterioration was not acute, with average liquidity returning to around its level in 2005.
References
BIS (Bank for International Settlements) (2007), ‘Triennial Central Bank Survey of Foreign Exchange and Derivatives Market Activity in 2007 – Final Results’, available at <http://www.bis.org/publ/rpfxf07t.htm>.
Clifton K and M Plumb (2007), ‘Intraday Currency Market Volatility and Turnover’, RBA Bulletin, December, pp 1–9. Available at <http://www.rba.gov.au/publications/bulletin/2007/dec/1.html>.
Fan M and RK Lyons (2003), ‘Customer Trades and Extreme Events in Foreign Exchange’, in P Mizen (ed), Monetary History, Exchange Rates and Financial Markets: Essays in Honour of Charles Goodhart, Volume 2, Edward Elgar, Cheltenham, pp 160–179.
Footnotes
This article was prepared by Emily Poole and Patrick D'Arcy of International Department. [1]
The data are supplied by the Securities Industry Research Centre of Asia-Pacific (SIRCA) on behalf of Reuters. As these data are subject to a publication lag, the indicators in this article are only available up to end August 2008. [2]
It is also important to distinguish between the number of trades and turnover, which measures the size (dollar value) of trades. Although the high-frequency dataset is rich, it does not contain data on the size of the trades. Therefore, it is not possible to examine whether the average trade size has changed over time. [3]
For further analysis of the relationship between volatility and turnover see Clifton and Plumb (2007). [4]
Fan and Lyons (2003) provide support for the argument that large flows from financial institutions can generate one-sided markets. They find that in general, extreme movements in the exchange rate at high frequencies are associated with large net flows due to portfolio shifts from financial institutions, with the flows of non-financial institutions tending to be significantly smaller and more stable. [5]
In order to abstract from the intraday patterns observed in foreign exchange markets (see Clifton and Plumb 2007), all the high-frequency liquidity indicators in this section of the article are calculated as deviations from the average level of the indicator at that period of the day during 2007. However, as daylight savings changes the Australian Eastern Standard Time (AEST) of regional market openings, these averages are only calculated over days in which daylight savings was not in place (as this was the case during August 2007). [6]