Bulletin – April 2009 The Composition and Distribution of Household Wealth in Australia[1]
- Download 516KB
Introduction
This article updates previous work done by the Bank using data from the Household, Income and Labour Dynamics in Australia (HILDA) Survey to describe the composition of household wealth and its distribution across households.[2] The analysis is largely based on data from the latest wealth module of the HILDA Survey, conducted in 2006. The article describes how household wealth changed over the period since the earlier HILDA Survey in 2002, and briefly examines how developments in house prices, equity prices and superannuation returns may have affected the composition and distribution of household net worth in 2007 and 2008.
We draw four main conclusions. First, the increase in net worth between 2002 and 2006 was broad-based across households, although it was generally more rapid for those residing in the resource-rich states and for older households. Second, growth in real-estate assets was the primary driver of growth in net worth between 2002 and 2006, and this factor drove most of the variation in trends in household net worth across the states. Third, growth in financial assets over the period was mainly due to superannuation assets and was broad-based across households of different ages and wealth levels. Fourth, the declines in net worth over 2008 are likely to have been mostly incurred by households at the top end of the wealth distribution, as the assets with the most significant price declines are predominantly held by those households.
The HILDA Survey
The HILDA Survey is an annual survey of around 7,500 households. Every four years it includes detailed questions on assets and liabilities, most recently in late 2006.[3] Using these data we compare snapshots – or cross-sections – of the composition and distribution of assets and liabilities held by households in 2002 and 2006. As the HILDA Survey largely tracks the same households in each period – that is, it is a longitudinal survey – we also use it to assess financial developments for particular groups of households through time.
To present the data from the HILDA Survey we use summary statistics that describe assets, liabilities and net worth (assets less liabilities) across a number of dimensions, such as the age, income and location of households. The main summary statistics used are the mean and median. The median is the value for the middle household in a distribution and is often more representative of the ‘typical’ household than the mean, or simple average.[4] To describe trends across households we divide the distribution of households into five equal-sized groups – referred to as quintiles – based on a ranking of their level of net worth, and present data across this dimension, as well as age and location. Because one of the key purposes of this article is to assess how real wealth has changed over time, we adjust for the change in purchasing power between the periods due to inflation; specifically, we use the CPI and report values in September quarter 2006 dollars. A set of detailed tables comparing assets and liabilities across a number of dimensions for 2002 and 2006 is provided in an Appendix.
Changes in Household Wealth between 2002 and 2006
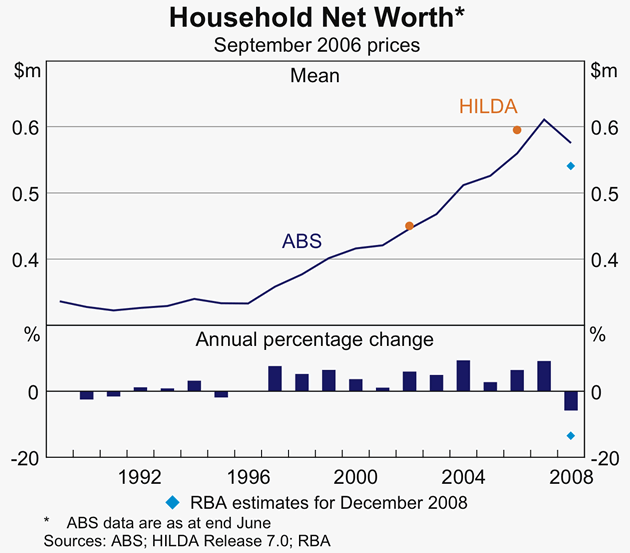
Household net worth grew strongly between 2002 and 2006. According to the HILDA Survey, average real household net worth per household increased by 7 per cent a year over this period, while the ABS measure indicates broadly similar growth of 6 per cent a year – the fastest rate of growth in this measure in any four-year period in the previous two decades (Graph 1).[5] The rise in net worth over this period was driven by both financial and non-financial assets, with the single largest contributor being growth in house prices. In 2006, mean net worth of households in the HILDA Survey was $596,000, up from $450,000 (in September quarter 2006 dollars) four years prior. In comparison, median household net worth increased from $245,000 to $325,000, or by 7½ per cent a year.
The difference between mean and median levels of household net worth reflects the uneven distribution of wealth across households. This unevenness (or skew) is due to a number of factors, including differences between households in their stage of life, labour market and education status, and income. One way to assess the degree of skewness is to compare medians from each quintile in the distribution. In 2006, median net worth of the households in the highest wealth quintile (the wealthiest one-fifth of households) was $1.35 million, which was around twice the median value of the second highest quintile, at $601,000, and around 10 times that of the second lowest quintile at $124,000 (Graph 2[6]). The lowest quintile had net worth of $6,000 in 2006. In comparison, the distribution of income is less skewed. The median income of the highest income quintile was 1½ times that of the second highest quintile, and four times that of the second lowest income quintile.
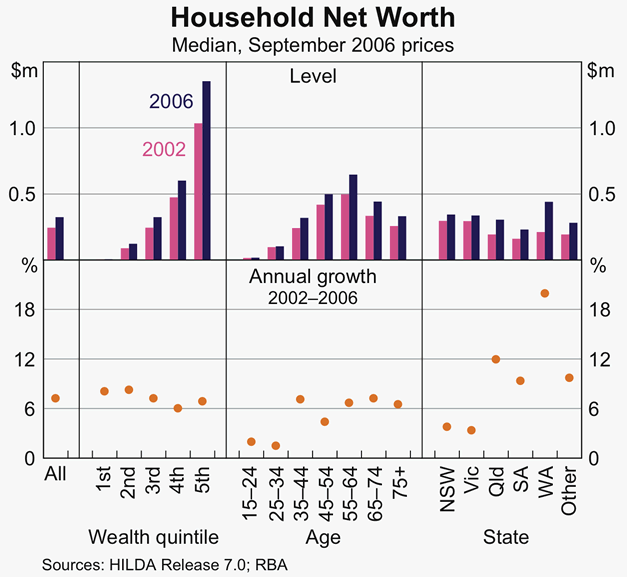
The cross-sectional data from the HILDA Surveys in 2002 and 2006 suggest that the skew in both the distribution of wealth and income remained broadly stable between the two periods. For household net worth, this is evident in the similar percentage increases for each of the wealth quintiles over the period. In addition, the longitudinal dimension of the survey suggests that most households (around three-fifths) that responded to both surveys remained in the same quintile of the wealth distribution in both periods. In particular, households in the top and bottom quintiles were more likely to remain in their initial quintiles than households in the middle quintiles.
As pointed out above, part of the reason for the unevenness of the distribution of wealth (and income, to a lesser extent) is the life cycle of households. For example, households that are nearing retirement are likely to have accumulated savings, while younger households are more likely to have debt associated with education or the purchase of a home. The life cycle therefore results in a hump-shaped distribution of wealth across age groups, which is apparent in both the 2002 and 2006 HILDA data. For both years, the level of net worth peaked for households with a head aged between 55 and 64 years. Growth in net worth between the periods was also generally higher for older households. The exception to this growth pattern across age groups was households with a head aged between 35 and 44 years, reflecting strong growth in both their non-financial and financial assets (discussed further below).
Across the states and territories, the strongest growth in household net worth was in Western Australia and Queensland. This is in line with rising incomes in these states resulting from a large increase in commodity prices and the effect on house prices in particular. The median level of Western Australian households' net worth in 2006 was the highest among the states and territories. In addition, the regional areas had stronger growth in household net worth than the capital cities over the period; growth in median household net worth in the regional areas was 10 per cent a year over the period, while it was 6½ per cent a year in the capital cities. This partly reflects the impact of the resources boom in some of these regional areas.
Household non-financial assets
Non-financial assets largely comprise holdings of real estate, motor vehicles and small business assets. Households in the HILDA Survey reported that on average non-financial assets accounted for 70 per cent of the total value of their assets in 2006.[7] Of these assets, residential property accounted for the largest share, at 60 per cent of the value of total assets in 2006, up from 54 per cent in 2002. Non-financial business assets (such as, farms and other small business equipment) accounted for 7 per cent of total household assets in 2006 and were largely held (85 per cent of the value) by households in the highest wealth quintile.
Responses to the HILDA Survey show that between 2002 and 2006 the median real value of households' non-financial assets increased by 9½ per cent a year, to $322,000. The increase was broad-based across households, with the longitudinal dimension of the survey suggesting that around three-quarters of the households that responded to both the 2002 and 2006 HILDA Surveys had an increase in the real value of these assets over the period. Of the one-quarter of households with no change or a fall in their non-financial assets, the bulk did not own a residential property.
Comparing the two periods as separate cross-sections, the percentage increase in the median real value of non-financial assets was fairly similar for the top three wealth quintiles, at around 8 per cent a year (Graph 3). Growth was strongest for the second lowest quintile at 12 per cent a year; over half of these households had a head aged between 25 and 44 years. Net worth for the lowest quintile increased by the least amount among the quintiles; in both periods these households tended to be young and renters, with motor vehicles accounting for a relatively large share (around one-third) of the value of their non-financial assets.
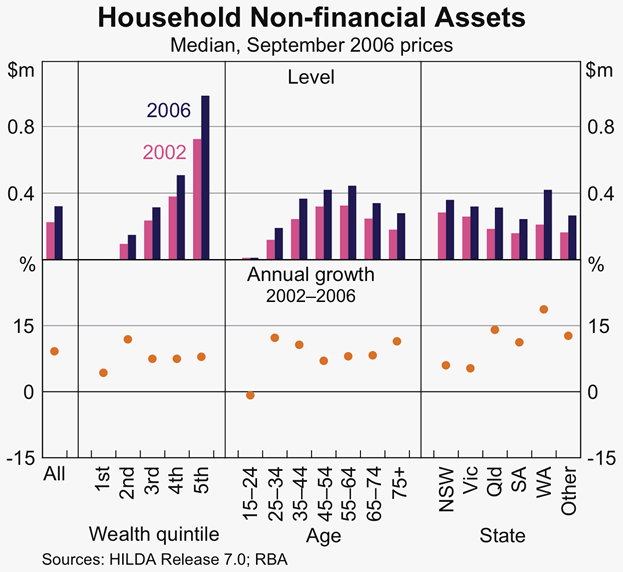
Across states and territories there was significant variation in growth in non-financial assets, in line with differences across state housing markets. In Western Australia the increase in the median value of non-financial assets reported in the HILDA Survey was around 20 per cent a year, while it rose by 15 per cent a year in Queensland, in line with strong increases in house prices in these states during the period. The rise in Western Australia is consistent with the sharp rise in house prices over the period, especially in 2005 and 2006. In the two largest states, New South Wales and Victoria, median household non-financial assets increased by around 6 per cent a year, as house price growth was slower in these states over the period, following more rapid growth in earlier years.
The home-ownership rate was fairly stable between the survey periods, at around 67 per cent of households, of which around half owned their home outright. There was, however, an increase in the share of households that owned a residential property that was not their primary residence (second homes and investment properties), from 16 per cent in 2002 to 20 per cent in 2006. For the households in the HILDA Survey, the median real value of these properties rose from $225,000 in 2002 to $350,000 in 2006, compared with the median value of owner-occupied housing, which rose from $280,000 in 2002 to $375,000 in 2006. Rates of second home and investment property ownership increased in all states between 2002 and 2006, and rose by the largest amount in Western Australia, to 23 per cent.
Household financial assets
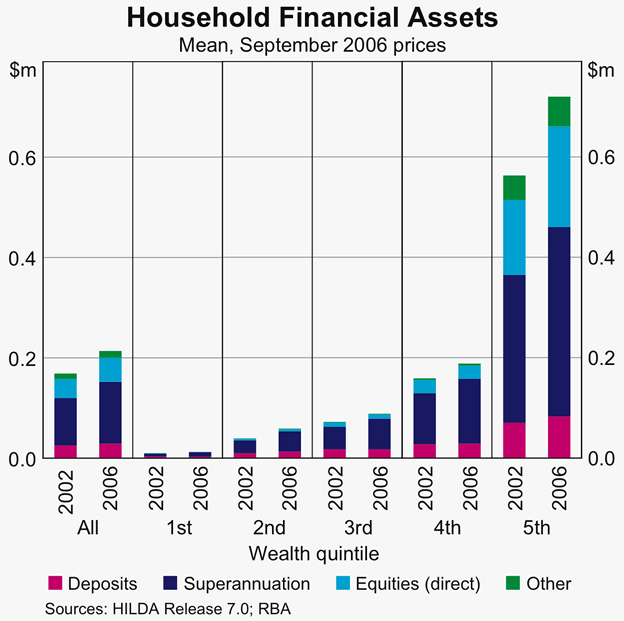
Households in the HILDA Survey reported that financial assets accounted for 30 per cent of their assets in 2006, down from 32 per cent in 2002. In both periods, superannuation accounted for around half the value of financial assets. Superannuation was widely held across households, with 79 per cent of households reporting holdings in the 2006 HILDA Survey, up from 76 per cent in 2002. Deposits were also widely held by households – almost all households reported having a deposit in both periods – although the median deposit size was small, at $7,000 in 2006, and deposits accounted for only 4 per cent of total assets. Direct holdings of equities accounted for 7 per cent of total assets in 2006, though they were held by 38 per cent of households, with these tending to be the wealthiest households.
The median real value of household financial assets increased by 7½ per cent a year between 2002 and 2006, rising to $71,000. The longitudinal dimension of the survey indicates that of the households that responded to both the 2002 and 2006 HILDA Surveys, two-thirds reported an increase in the real value of their financial assets over the period.
Comparing the two periods as separate cross-sections, financial assets increased by less in percentage terms for the upper end of the distribution of household wealth than for the lower end (Graph 4). For the three wealthiest quintiles, the median real value of financial assets increased by around 5 per cent a year, while for the two lowest wealth quintiles it grew by between 9 and 15 per cent. The largest contributor to the increase between the periods across all wealth quintiles was superannuation assets. For the lower quintiles, superannuation assets accounted for almost all of the increase in the value of financial assets. To some extent this could reflect that earlier generations of lower wealth households had lower participation in compulsory superannuation.
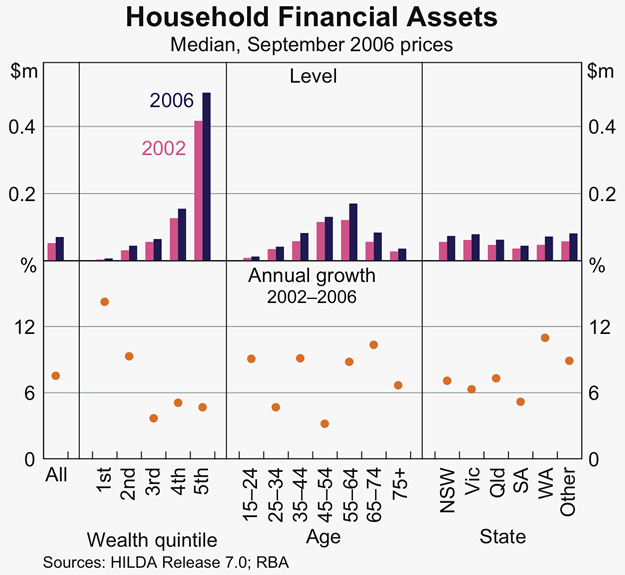
The level of household financial assets has a hump-shaped distribution across age groups, peaking for households where the head is aged between 55 and 64 years, consistent with the life-cycle effect outlined above. Across states and territories, the level and growth in financial assets varied less than for non-financial assets, consistent with house prices being the main driver of variation in household wealth across the states. There was, nonetheless, some variation across states, with Western Australian households reporting the strongest growth in financial assets over the period.
Looking at the types of financial assets held, the HILDA Survey suggests that wealthier households had significantly larger holdings of superannuation and direct equity assets than lower wealth households in both periods (Graph 5). For example, the mean values of superannuation and direct equity asset holdings for households in the highest wealth quintile in 2006 were $351,000 and $196,000 respectively, while they were $39,000 and $4,000 for the second lowest quintile. For superannuation assets, this partly reflects that wealthier households are also older households that tend to be nearing or in retirement. Direct equity holdings of households are more skewed towards the upper end of the wealth distribution than superannuation. In the highest wealth quintile, 72 per cent of households reported direct holdings of equities in 2006, compared with only 25 per cent of households in the second lowest wealth quintile and 8 per cent of households in the lowest quintile.
Household debt
The value of household debt increased by 11 per cent a year in real terms between 2002 and 2006, according to the HILDA Surveys, which is in line with aggregate measures of household debt based on data from financial institutions. Most of the value of household debt is secured against a residential property, with this share rising from 84 per cent to 86 per cent between 2002 and 2006. Other types of debt include loans for vehicle purchase, credit card debt, margin loans and small business debt. Overall, the HILDA Survey reported that around one-third of households had no debt.
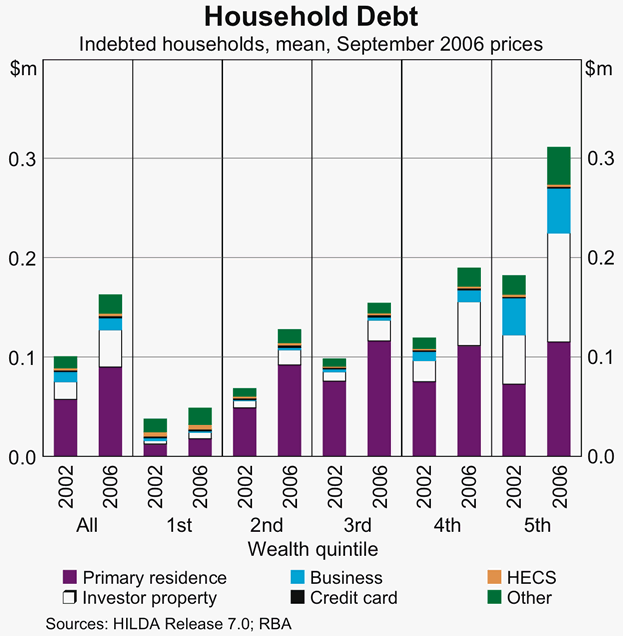
The increase in mortgage debt over the period partly reflected a rise in the incidence of residential mortgages, with the share of households that have debt on their primary residence rising from 33 per cent to 35 per cent between 2002 and 2006. The share of households with debt secured against a second home or investment property also increased, from 7 per cent to 9 per cent. Looking only at households with debt, the mean real value of debt per household increased from $113,000 to $164,000 between 2002 and 2006, while the median increased from $56,000 to $69,000.
The longitudinal dimension of the survey suggests that of the households that responded to both the 2002 and 2006 HILDA Surveys, 42 per cent reported an increase in the real level of their debt. Of the remaining households, 24 per cent reported no change in their real debt – largely because these households typically had no debt in either period – and 34 per cent reported a decline in their real level of debt. Consistent with life-cycle effects, younger households accounted for a large share of those that increased their debt, while reductions in debt were most common for households with a head aged between 45 and 54 years.
Of those households with debt in the HILDA Survey, the households with the highest net worth tended to have the highest levels of debt (Graph 6). Specifically, households in the upper half of the distribution of net worth accounted for two-thirds of the total value of household debt. Looking across the wealth quintiles, households in each of the four highest quintiles had similar levels of debt secured against their owner-occupied residential property, with a mean level of around $100,000 in 2006. Debt for purposes other than the purchase of primary residences was, however, mostly held by households in the top two wealth quintiles (70 per cent by value); this comprised debt for investment properties, small businesses and financial investments, such as margin loans.
To assess levels of household indebtedness, analysts typically look at the ratios of household debt to disposable income and household debt to assets (gearing). The HILDA data suggest that the median debt-to-income ratio for households with debt rose from 109 per cent in 2002, to 128 per cent in 2006, while the gearing ratio increased only slightly – from 23 per cent to 24 per cent (Graph 7).[8]
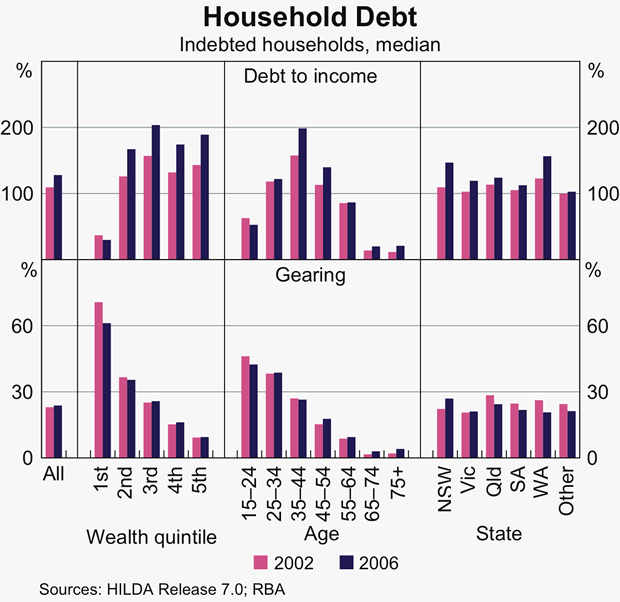
Across the distribution of net worth, the median debt-to-income ratio was similar for indebted households in the four highest wealth quintiles, at between 170 per cent and 200 per cent in 2006, while the lowest wealth quintile had a much lower debt-to-income ratio, at around 30 per cent. In contrast, the gearing ratio tended to be higher for the low wealth quintiles, reflecting the low levels of their assets. Indebted households in the lowest wealth quintile had median debt of around $10,000 in 2006, compared with disposable income of $33,000 and assets of $16,000. Across the age groups, households with a head aged between 35 and 44 years had the highest levels of debt relative to their incomes and their debt-to-income ratio also increased by the largest amount. As might be expected, debt levels were positively correlated with the value of housing assets across the states, which meant that gearing ratios tended to be similar across states.
Changes in Household Wealth in 2007 and 2008
More recently, real net worth per household is estimated to have fallen by 14 per cent over 2008, following a 7 per cent rise over 2007. Aggregate data suggest that growth in household net worth over 2007 was similar to that of the previous four years, driven by a rise in financial and non-financial assets (Table 1). In contrast, the fall over 2008 was the largest in the history of the ABS household wealth data (which commences in 1988). While HILDA wealth data will not be available for 2007 or 2008, data that describe aggregate trends in house prices, equity prices and the value of superannuation can be used in conjunction with the 2006 HILDA Survey data to give an indication of how the composition and distribution of household wealth is likely to have changed over this period.
| 2007 | 2008 | |
|---|---|---|
| Non-financial assets | 6 | −6 |
| Financial assets | 8 | −18 |
| – Superannuation | 17 | −23 |
| – Direct equities | −4 | −47 |
| Debt | 7 | 2 |
| Net worth | 7 | −14 |
|
(a) Excludes non-financial assets of unincorporated enterprises, September quarter 2006 prices Sources: ABS; RBA |
||
Aggregate data suggest that the fall in household net worth over 2008 was mostly driven by large falls in the values of equities and superannuation holdings, with more modest declines in house prices. ABS data suggest the value of households' real direct equity holdings fell by 47 per cent, while the value of their superannuation holdings fell by 23 per cent, both largely reflecting a fall in equity prices. As the HILDA data indicate that households in the highest wealth quintile owned four-fifths of the value of direct equities and three-fifths of the value of superannuation in 2006, the decline in these assets in 2008 is likely to have had a greater effect on these wealthier households. House price data also suggest declines in 2008 were larger in higher-priced suburbs, following stronger price growth in these suburbs over the previous year. In the most expensive one-fifth of suburbs, real house prices declined by 13 per cent over 2008 – fully offsetting the gains from the previous year – while real house prices in the other suburbs declined by 5 per cent, following growth of 8 per cent over 2007.
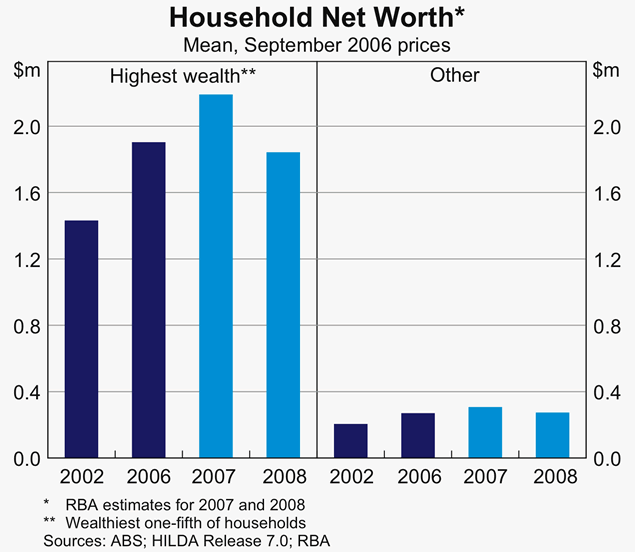
Using these data, and making a number of assumptions, we are able to derive rough estimates of household net worth for the highest and other wealth quintiles for 2008.[9] These estimates suggest that the fall in net worth over 2008 was most pronounced for the wealthiest households (Graph 8). We estimate that average real household net worth fell by around 15 per cent for households in the highest wealth quintile, to be slightly below its 2006 level, while it declined by around 10 per cent for other households, to a little above its 2006 level. Overall, households in the highest wealth quintile held 64 per cent of the value of aggregate household net worth in 2006, but are estimated to have accounted for around 72 per cent of the decline in household net worth over 2008.
Appendix
Please refer to the PDF file for tables A1a, A1b, A2a, A2b, A3a, A3b, A4a, A4b, A5a, and A5b.
Footnotes
This article was prepared by Paul Bloxham and Thomas Betts of Economic Analysis Department. [1]
See Kohler M, E Connolly and K Smith (2004), ‘The Composition and Distribution of Household Assets and Liabilities: Evidence from the 2002 HILDA Survey’, RBA Bulletin, April, pp 1–11. [2]
The HILDA Survey was initiated by the Australian Government Department of Families, Housing, Community Services and Indigenous Affairs and is managed by the Melbourne Institute of Applied Economic and Social Research. [3]
Throughout the article we interchange between means and medians where we deem appropriate. While medians have the advantage of being more representative of the typical household, they have the disadvantage that they are non-additive. For example, while the mean value of financial and non-financial assets adds to the mean value of total assets, the median value of these types of assets does not. [4]
The different growth rates in the ABS and HILDA measures reflect a number of measurement issues, including variations in survey scope. One significant difference is the measurement of residential property assets; while the HILDA Survey asks households to value their own houses the ABS measure uses sale price data. The HILDA data suggest more rapid growth in the value of residential property assets between 2002 and 2006 than the ABS data, which is likely partly to reflect the different measurement techniques. For a detailed comparison of the different household wealth measures for Australia, see Bloxham P and T Betts (forthcoming), ‘Measures of Household Wealth for Australia’, Australian Economic Review, June 2009. [5]
Graphs 2 to 8 show cross-sectional data. The growth rates presented in these graphs compare cross-sections from each period. For example, growth for any particular wealth quintile is the percentage difference between net worth for households in that quintile in 2006 and households in that quintile in 2002. [6]
This is higher than the share suggested by the ABS measure – which was 60 per cent in the June quarter 2006 – mainly reflecting higher values of reported residential property assets in the HILDA Survey than implied by the ABS measure. [7]
For all households, the HILDA Survey suggested mean ratios of 153 per cent and 23 per cent for 2006, similar to those based on financial institutions and national accounts data. [8]
We assume that the composition of assets and liabilities of households in the highest wealth quintile and rest of the wealth distribution from the HILDA Survey for 2006 is representative for the more recent years. We then apply value changes of aggregate household financial assets and liabilities from the ABS data to the household groupings. For housing assets, we assume that the houses in the most expensive suburbs are owned by the wealthiest households. [9]