Bulletin – March 2010 The Labour Market during the 2008–2009 Downturn
- Download the article 217KB
Abstract
The Australian labour market has performed relatively well over the past two years or so, compared with its performance in the early 1980s and 1990s recessions and in a recent international context. This is partly explained by the milder downturn in economic activity, the earlier strength of the labour market, and greater labour market flexibility than in previous downturns.
Introduction
The Australian labour market has performed relatively well over the past two years or so, especially compared with its performance in the early 1980s and 1990s recessions and the recent experience of most other advanced economies. In particular:
- the increase in the unemployment rate has been less than expected, even after taking into account that the economic downturn was less severe than earlier thought likely;
- much of the decline in labour demand occurred via reductions in hours worked, rather than redundancies;
- it took longer than usual for the slowing in domestic activity to be reflected in a rise in the unemployment rate; and
- the decline in labour force participation has been relatively modest.
This article examines these developments, and discusses the key differences in labour market outcomes over the past two years relative to the early 1980s and 1990s recessions.[1]
Adjusting Labour Input: Employment versus Hours Worked
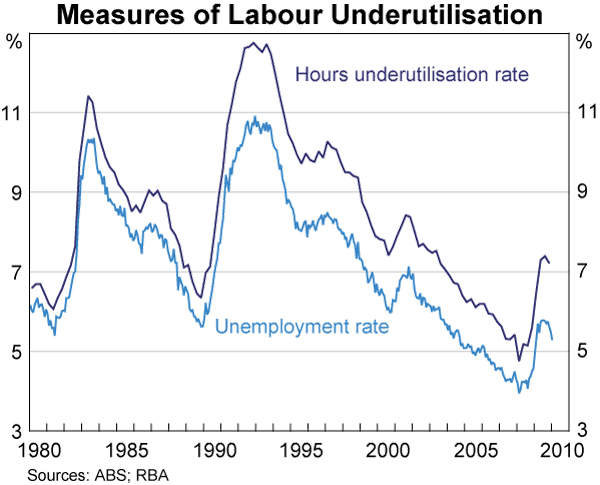
Between early 2008 and mid 2009, the unemployment rate in Australia increased by around 1¾ percentage points, rising from around 4 per cent to 5¾ per cent (Graph 1).
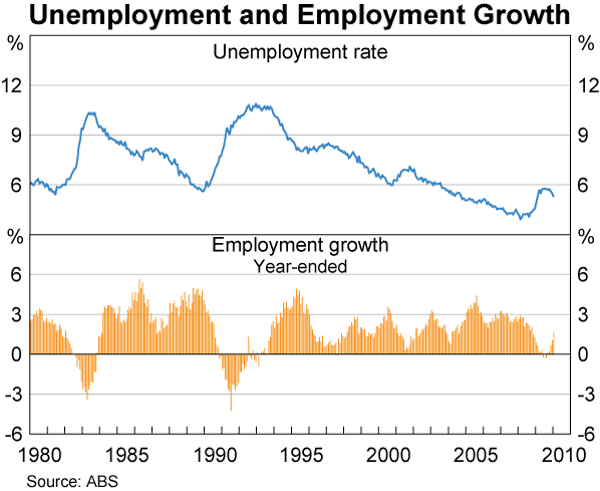
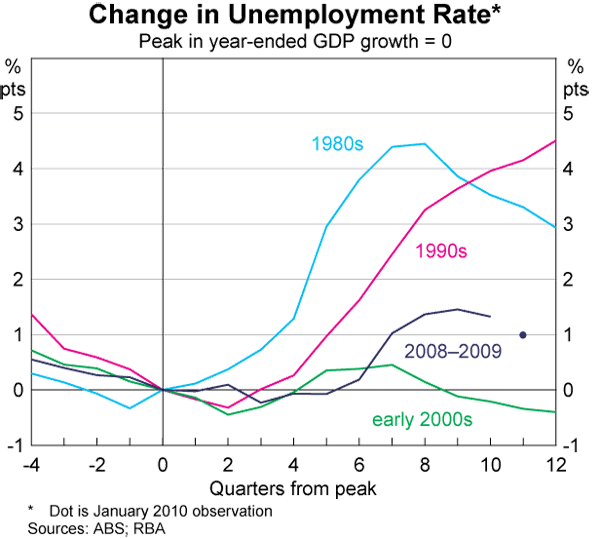
This increase compares with a rise of around 5 percentage points in each of the early 1980s and early 1990s recessions in Australia (Graph 2), and increases in the most recent episode of around 5½ percentage points in the United States and 2¾ percentage points in Europe. The decline in labour demand was also considerably less on this occasion, with a peak-to-trough decline in the level of employment of ½ per cent, compared with 3½ per cent and over 4 per cent in the early 1980s and 1990s.
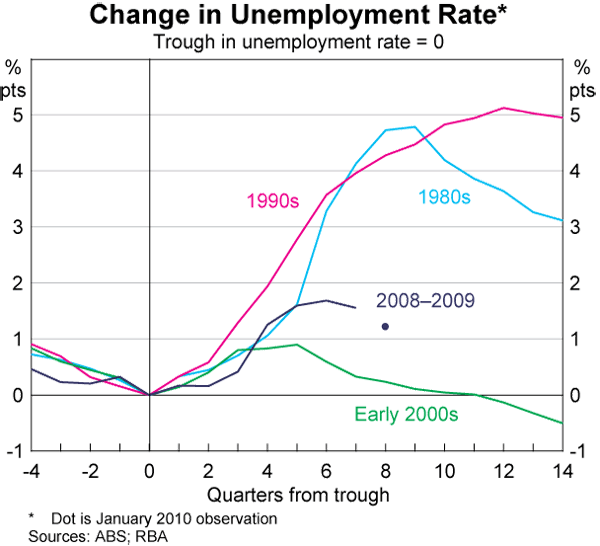
The most obvious explanation for these better labour market outcomes is that the recent downturn in economic activity was milder, with year-ended output growth slowing to a little below 1 per cent, compared with year-ended declines in output of 3.4 per cent and 1.6 per cent in the early 1980s and 1990s. But the milder downturn in growth only accounts for part of the better performance recently. Based on the relationship between output growth and unemployment in the early 1980s and 1990s episodes, a larger increase in the unemployment rate would have been expected recently, given the slowing in the economy that was experienced.
This outcome is partly explained by the greater degree of flexibility in employment and wage-setting practices, compared with those in the 1980s and 1990s recessions. Following a succession of reforms over recent decades, rigidities in the labour market were significantly reduced.[2] This made it easier for firms and employees to negotiate work and pay arrangements that enabled firms to preserve jobs during a period of subdued activity, partly by reducing average hours worked. While lower hours reduce compensation per employee, they avoid the significant social and economic costs associated with unemployment, including detachment from the labour force, skill atrophy and reliance on government assistance.
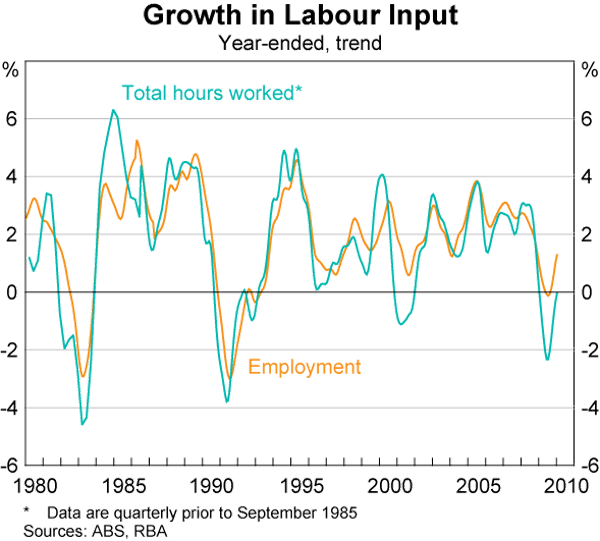
The decline in average hours worked per employee has been significant in the recent episode, as was the case in the early 2000s, with total hours worked falling by significantly more than the number of people employed (Graph 3). This is in contrast to the early 1990s recession, when average hours worked per employee fell only modestly, while the early 1980s episode was affected by a legislated reduction in the working week, rather than direct negotiations between firms and employees.[3]
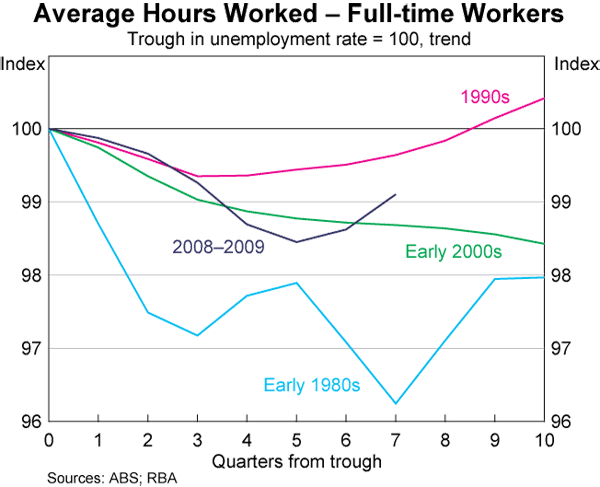
The decrease in average hours worked in the 2008–2009 episode reflected a fall for both full-time and part-time workers. The fall, however, was more pronounced for full-time workers, and followed a broadly similar pattern to the early 2000s (Graph 4). By comparison, in the early 1990s, average hours worked by full-time employees declined only modestly, while the significant decline in the early 1980s was associated with the legislated reduction in the full-time working week.
The decrease in hours worked during 2008–2009 also reflected a shift in the composition of employment from full-time to part-time.[4] While this is a common pattern in downturns – due to a higher proportion of full-time employment in cyclically sensitive industries such as construction and manufacturing – the decreasing share of these industries in total employment tempered this compositional effect in the most recent episode compared with historical experience.
Given that more of the reduction in labour input over 2008–2009 occurred via decreasing the working hours of employees, rather than as a result of redundancies, various measures of labour underutilisation show a more noticeable increase in spare capacity than the unemployment rate. In particular, a measure of labour underutilisation that includes the ‘underemployed’ – those workers who would like to work more hours – increased by nearly 1½ times more than the unemployment rate in the recent downturn (Graph 5).[5] By comparison, for this measure, the relative increase in both the early 1980s and 1990s was not as large, confirming that a higher proportion of the reduction in labour input in the current episode occurred via reducing hours worked.
Lagged Response of the Labour Market
Another feature of the recent downturn is that the unemployment rate didn’t start to rise noticeably until around 1½ years after economic activity began to slow, compared with around a year or less in the early 1980s and 1990s (Graph 6).
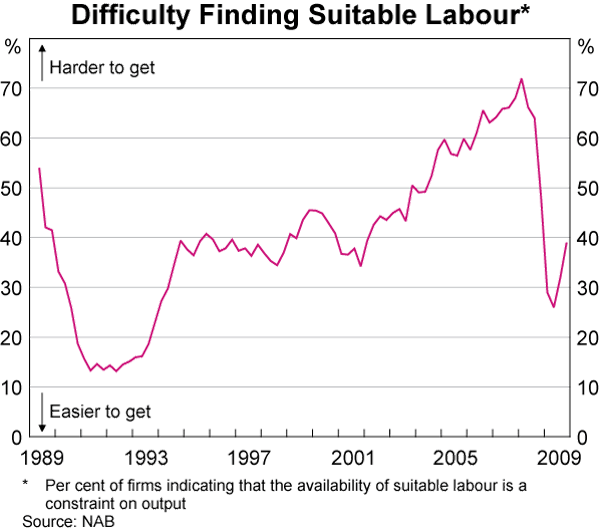
This longer lag partly reflects the significant degree of labour market tightness that existed prior to the recent downturn, with the unemployment rate falling to its lowest rate in over 30 years, employment growing at an above-trend pace, and the participation rate at its highest level since the labour force survey began in the 1960s. These outcomes reflected solid growth in the Australian economy, which has been expanding since the early 1990s. This tightness in the labour market led to a broad-based shortage of skilled labour in Australia throughout late 2007 and early 2008, and many firms found it difficult to find suitable labour to fill vacant positions (Graph 7). It is possible that firms were ‘overutilising’ their existing staff prior to the recent downturn, for instance, by requesting staff to work longer hours than desired. As economic activity slowed markedly through 2008, it took some time for this overutilisation to unwind by, for example, reducing working hours to more normal levels. Firms were also apparently reluctant to let go of skilled workers as activity slowed, because labour had been so difficult to source prior to the downturn. This tempered the increase in the unemployment rate as the economy slowed, and helps explain why unemployment did not rise sharply until late 2008.
Labour Force Participation
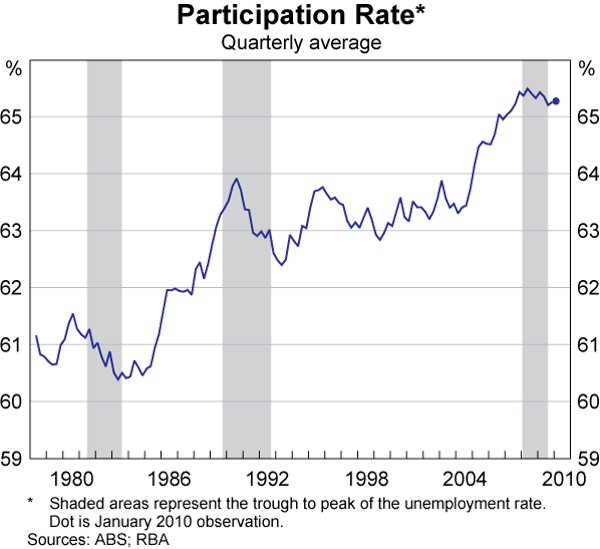
Typically during a downturn in the labour market, labour force participation decreases. As the demand for labour declines, and the pool of unemployed increases, job seekers can become discouraged and eventually give up looking for work, thereby moving out of the labour force (which, by definition, requires active job search). The decline in the participation rate during the 2008–2009 downturn, however, was considerably less than in the earlier episodes; around ¼ percentage point, compared with 1¼–1½ percentage points in the early 1980s and 1990s (Graph 8). Again, this appears to reflect more than the relatively milder downturn in 2008–2009.
Disaggregating labour force participation data (by age, gender and marital status) shows that while most groups recorded declining or flat participation during the 2008–2009 downturn, two groups reported strong participation outcomes: older workers (those aged 55–64 years); and married females (at least in the early stages of the downturn).
One explanation is that workers who were nearing retirement age decided to stay in the workforce longer – regardless of deteriorating employment prospects – in order to make up for the decline in expected retirement income following the sharp falls in asset prices associated with the global recession. The participation rate of older workers increased sharply during 2008–2009, after having trended upwards since the early 1990s and flattening prior to the recent downturn (Graph 9). In the early 1980s, the participation rate of this group declined noticeably, while in the 1990s it remained broadly steady. By comparison, trends in the participation rates of other age groups during the recent downturn were consistent with those in the early 1980s and 1990s, with prime-working-age participation remaining broadly flat, and youth participation declining sharply.
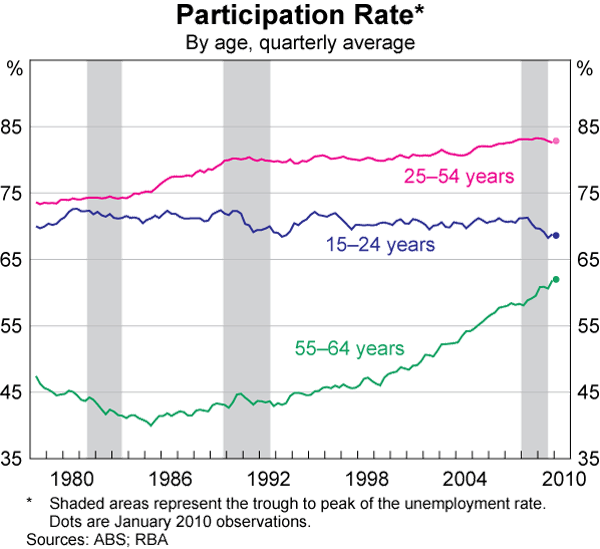
The participation rate of married women continued to trend upwards in the earlier stages of the recent labour market downturn, and at least as rapidly as in the period prior to it. One possible explanation is that previously non-working spouses entered the labour force in an attempt to diversify household income, owing to expectations of rising unemployment. This is in contrast to the previous two recessions, when this group's participation rate remained broadly flat. As expectations of rising unemployment subsided, the participation rate of married females moderated somewhat.
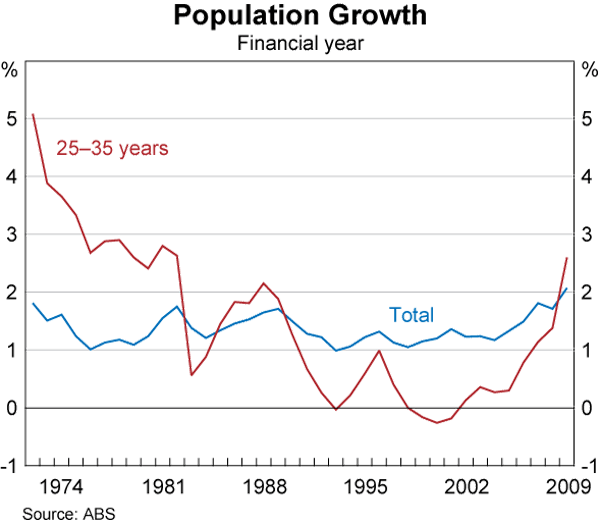
In addition, strong population growth in recent years has been driven by strong growth in the number of people aged 25–35 years, who typically have a high participation rate (Graph 10). This could partly reflect relatively high levels of immigration, with immigrants tending to have relatively high participation rates in recent years.[6]
Conclusion
The Australian labour market fared relatively well during the 2008–2009 downturn, with the unemployment rate rising by less than expected and labour force participation remaining strong. Much of the weakening in labour demand was reflected in a decline in average hours worked, with firms and their employees negotiating arrangements that preserved jobs. These outcomes were better than might have been expected, based on the experiences of the early 1980s and 1990s recessions.
Footnotes
The authors are from Economic Analysis Department. [*]
For a discussion of common patterns in Australian labour market outcomes during economic downturns, see, for example, Borland (2009). [1]
See, for example, Industry Commission (1998). [2]
See Bureau of Industry Economics (1984). [3]
The ABS defines a full-time employee as someone who usually works 35 hours or more, or who worked 35 hours or more in the survey reference week. [4]
The underemployment measure used here comprises part-time workers who are actively looking to work more hours and full-time workers who have been temporarily put on shorter hours for economic reasons (such as insufficient work available), weighted by an estimate of the additional hours that they want to work; see RBA (2004). This measure differs from the ABS measure of underutilisation, in that it only includes part-time workers who are actively looking to work more hours, not those who only prefer to work more hours. [5]
See Productivity Commission (2006). [6]
References
Borland J (2009), ‘What Happens to the Australian Labour Market in Recessions ’, Australian Economic Review, 42(2), pp 232–242.
Bureau of Industry Economics (1984), ‘Reducing Standard Hours of Work: Analysis of Australia's Recent Experience’, Research Report 15, AGPS, Canberra.
Industry Commission (1998), ‘Microeconomic Reforms in Australia: A Compendium from the 1970s to 1997’, Research Paper, AGPS, Canberra, January.
Productivity Commission (2006), ‘Economic Impacts of Migration and Population Growth’, Final Report, April.
RBA (2004), ‘Box B: Indicators of Labour Market Tightness’, Statement on Monetary Policy, November, pp 35–36.