Bulletin – September 2011 Labour Market Outcomes in Regional Australia
- Download the article 440KB
Abstract
Labour market outcomes in regional areas of Australia have followed broadly similar trends to those in capital cities over the past two decades. The range of unemployment rates across the regions narrowed through the 2000s, as the benefits of economic growth were spread broadly across the country. Nonetheless, there are still some notable differences between labour market outcomes in certain regions, partly reflecting the variation in industry structure across regional areas of Australia.
Introduction
Regional Australia accounts for just over one-third of Australia's population and makes a large contribution to the national economy. There is significant diversity in the industry structure across different regions – with, for example, some regions more focused on agriculture, mining or manufacturing than others. Consequently, understanding economic developments in regional areas is important, especially during periods when there is significant divergence in industry performance. The Reserve Bank monitors these developments through its business liaison program, with State Offices in five capital cities and regular visits by Bank staff to regional areas to gather information on local conditions. In addition to these firsthand reports, the Bank monitors and analyses the available data on state and regional developments.[1]
As a product of this work, this article examines recent labour market outcomes across regional Australia. Overall, the article shows that trends in regional labour markets during the past two decades have been broadly similar to those in capital cities, and that unemployment rates across the different regions have tended to converge towards the national average. However, there remain some significant differences in labour market outcomes across individual regions, in part reflecting differences in industry structure. In particular, regions with a higher-than-average share of employment in mining and agriculture have tended to have lower unemployment rates than regions where employment is more concentrated in the manufacturing and tourism industries.
Definitions
Regional Australia is defined in this article as the area outside the capital city boundaries, as set by the Australian Bureau of Statistics (ABS). The capital city boundaries include areas where the population has strong links to the central business districts and surrounding urban centres (for example, it is possible to commute there for work) as well as those areas covering the expected expansion of the cities over the next 20 years. Outside these boundaries, regional Australia includes large population centres such as Newcastle, the Gold Coast and Geelong, mid-sized towns like Dubbo and Geraldton, and less populous towns and country areas.
Data for regional Australia can be disaggregated in several ways. The ABS labour force survey (LFS) shows unemployment rates and participation rates for around 30 statistical regions outside the capital cities, and these data are used here to compare recent labour market developments across regions.[2] Unemployment rates and population data can be further disaggregated into statistical local areas (SLAs) using information from the Department of Education, Employment and Workplace Relations (DEEWR) and the ABS Regional Population Growth release.[3] These disaggregated data can be used to analyse the relationship between regional labour market outcomes and the industry structure of each region.[4]
Comparing Capital Cities and Regions
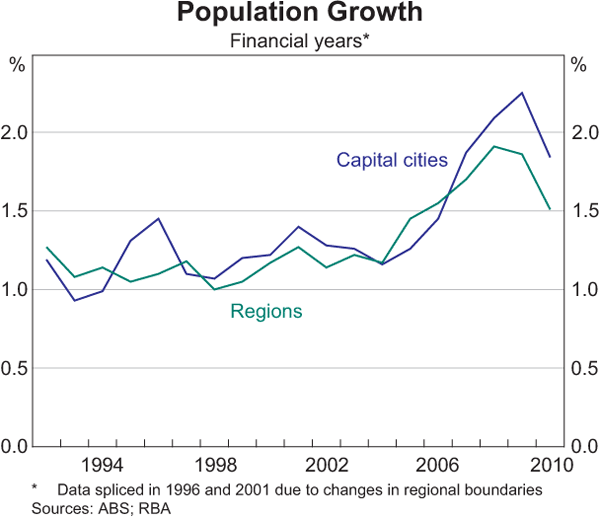
The population of regional Australia has grown at around the same pace as that of the capital cities over the past two decades (Graph 1). Regional population growth averaged 1.3 per cent a year between 1992 and 2010, only slightly below the 1.4 per cent average annual growth in the capital cities. Population growth in regional areas outpaced growth in the capital cities in 2005 and 2006, partly due to population flow into mining areas, but has lagged since then.
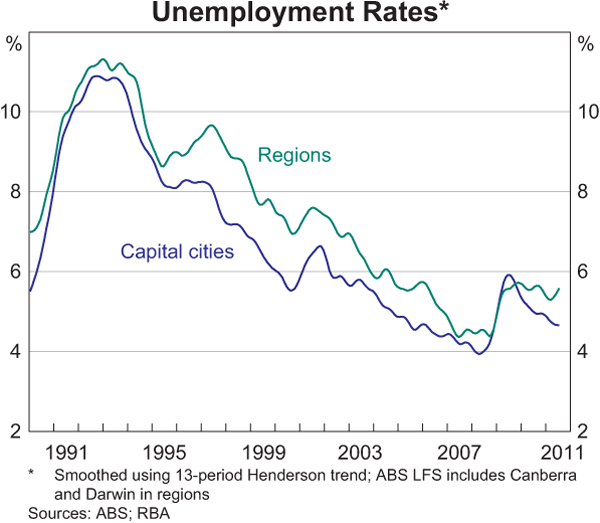
Labour markets in the capital cities and regions have followed broadly similar cycles over the past two decades (Graph 2). Capital city and regional unemployment rates rose to a peak of around 11 per cent during the early 1990s recession, before declining as the economy recovered. In the mid 1990s, unemployment rates stabilised in the capital cities and rose a little in the regions, before resuming their downward trend. In 1997, the unemployment rate in regional areas was around 1½ percentage points above that in the capital cities, and the gap remained around that level for the next few years. However, as the labour market tightened through the 2000s, the regional unemployment rate converged towards that in the capital cities. During the late 2000s downturn, unemployment rates rose in both the capital cities and the regions, and subsequently declined. The change in the unemployment rate was, however, more pronounced for the capital cities.
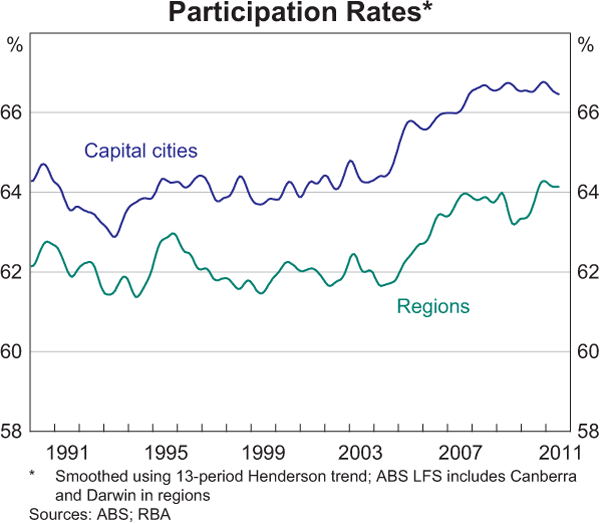
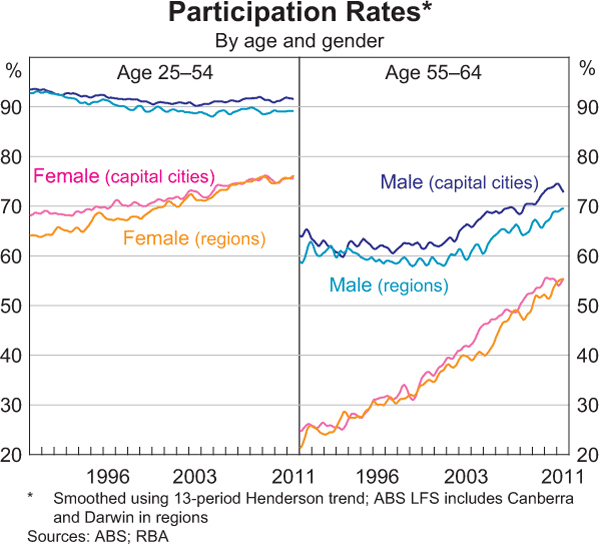
Labour force participation rates in regional areas and capital cities have also displayed similar trends, with participation rates rising by a little more than 2 percentage points over the past decade in both cases (Graph 3). The rise in participation rates reflects similar social and economic factors; labour force participation by female and older workers picked up notably in regions as well as in the capital cities (Graph 4). The participation rate for females in regional areas converged towards that in the capital cities over the past two decades, although the participation rate for males in regional areas generally remained below that in the capital cities.
Comparing Regions
While unemployment rates in capital cities and regional areas have followed broadly similar trends over the past two decades, there has been a wide range of outcomes for individual regions.[5] For the current 29 statistical regions in the ABS labour force survey, recent unemployment rates have ranged from 11 per cent in Wide-Bay Burnett (which includes Maryborough and Bundaberg in Queensland) to 2 per cent in the South Eastern Statistical Region of New South Wales (which includes Goulburn and Cooma); 80 per cent of regions have unemployment rates ranging between 3 and 8 per cent (Graph 5).[6]
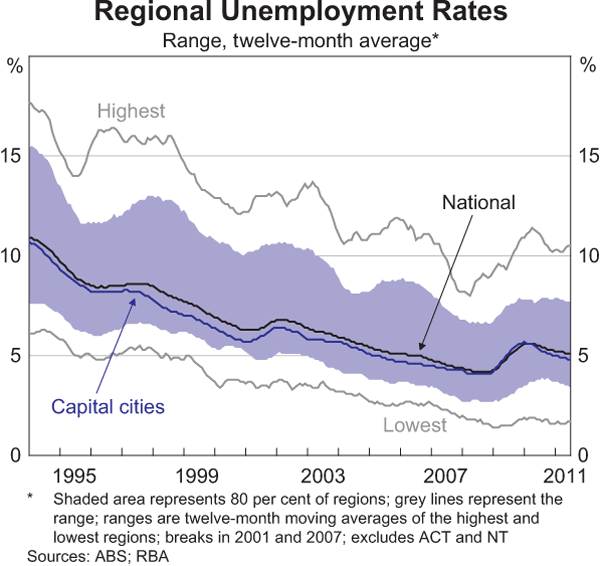
Although regional differences remain noteworthy, the dispersion in unemployment rates has narrowed over time. The range between the highest and lowest unemployment rates averaged around 11 percentage points in 1994, compared with 9 percentage points over the past year. Importantly, for the central 80 per cent of the distribution, the range was 7 percentage points in 1994 and 4 percentage points over the past year.
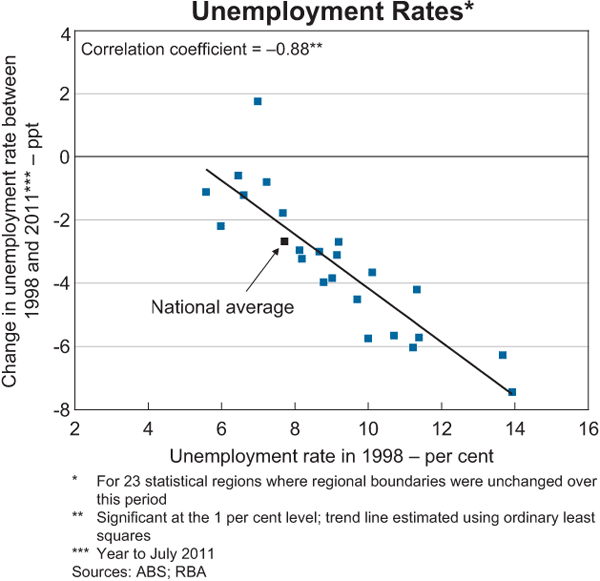
Another way to examine this issue is to look at the relationship between regions' unemployment rates in the late 1990s and the size of their subsequent decline. Regions that started with higher unemployment rates have tended to experience larger declines in their unemployment rates over the following decade or so than regions that began the period with lower unemployment rates (Graph 6). As a consequence, unemployment rates have converged over time.
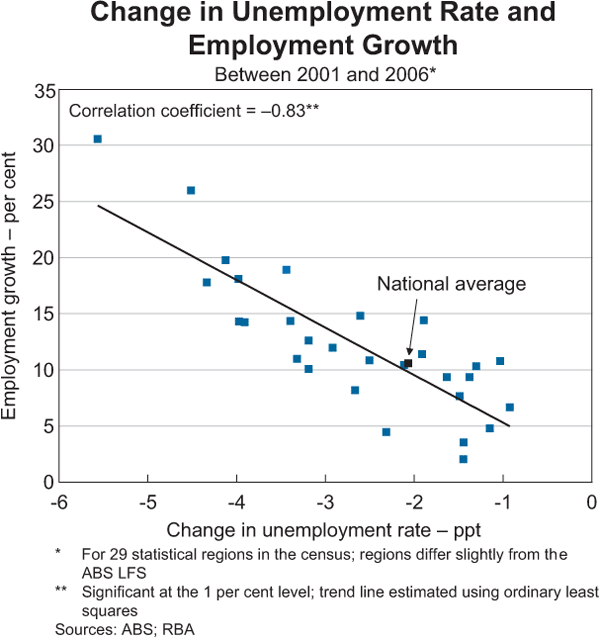
This convergence of unemployment rates across the regions appears to have been mainly driven by unemployed people moving into employment (either in their region or another), rather than leaving the labour force. Using census data to calculate regional employment growth rates, the regions that experienced larger declines in their unemployment rates were also generally those regions that experienced stronger employment growth (Graph 7).
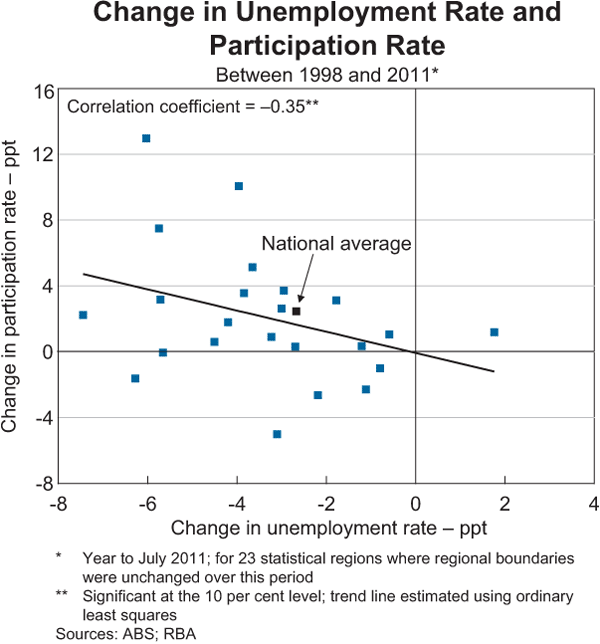
Most regions have experienced an increase in labour force participation regardless of their unemployment rate in the late 1990s. Moreover, participation rates have tended to rise by more in regions that experienced larger declines in their unemployment rates, indicating that more people entered the labour market as jobs became more readily available (Graph 8).[7]
Industry Composition and Labour Markets across Regions
Another way of examining regional labour market outcomes is to group regions with similar industry structures and investigate whether differences between regions grouped in this way help to explain variations in their unemployment rates.[8] For some regions, the industry structure of the labour market is similar to that in the capital cities, with the share of employment in each industry close to that for the national average. Other regions have industry structures that are quite different to the rest of the country. For example, in a few regions around half of all employed people work in the mining industry, compared with the national average of less than 2 per cent.
To examine regional labour markets by industry structure, the data were disaggregated into the 641 regional SLAs that had more than 500 employed people based on the 2006 Census. These SLAs were classified into five industry groups: agriculture, mining, manufacturing, tourism (represented by the accommodation & foodservices industry) and ‘other’ (Table 1).
| Dominant industry in region | Number of SLAs | Population Millions | Share of regional population Per cent |
|---|---|---|---|
| Agriculture | 314 | 2.0 | 25.6 |
| Mining | 30 | 0.5 | 5.7 |
| Manufacturing | 24 | 0.4 | 4.4 |
| Tourism | 23 | 0.3 | 4.3 |
| Other | 250 | 4.8 | 60.0 |
| Sources: ABS; RBA | |||
Each SLA was included in the group for which the industry share of total employment was the highest relative to that industry's share of employment at the national level.[9] Regions where there was no clear difference between industries' share of employment and the national averages, or where the dominant industry was not agriculture, mining, manufacturing or tourism, were classified under ‘other’.[10] For example, SLAs such as Bourke (NSW) and Gatton (QLD) were included in agriculture, Kalgoorlie/Boulder (WA) and East Pilbara (WA) were included in mining, Corio (VIC) and Mount Gambier (SA) were included in manufacturing, and Byron Bay (NSW) and Surfers Paradise (QLD) were included in tourism.
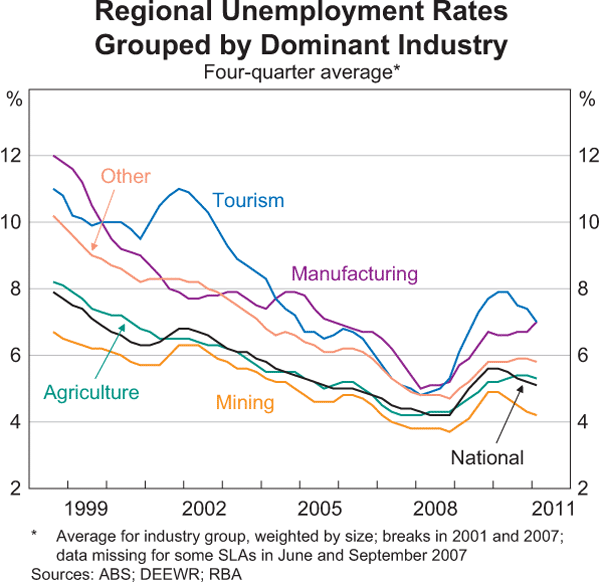
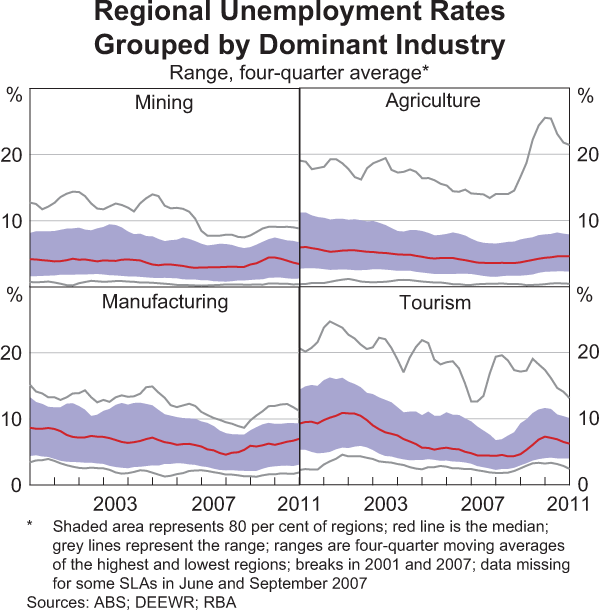
These data suggest that, over the past decade, regional areas that were heavily focused toward mining have tended to have unemployment rates that were lower than average, agricultural areas have generally had around average unemployment rates, and areas focused on manufacturing and tourism have tended to have above average unemployment rates (Graph 9). While there remains significant diversity among unemployment rates within each industry group, these results hold for the majority of SLAs classified within each group (Graph 10). Furthermore, the nationwide trend toward less dispersion in unemployment rates across regions over the past decade is broadly apparent within each group. (An exception is agriculture, where although the range of outcomes for the central 80 per cent of agricultural regions has narrowed over time, the unemployment rate for a few SLAs in North Queensland rose sharply in 2009.)
The low average unemployment rates in mining and agricultural regions are likely to reflect, in part, significant labour mobility in and out of these regions. In general, when employment in the mining and agricultural industries has declined, there has not been a notable increase in the average unemployment rate in the regions where these industries are dominant. National mining employment fell in the late 1990s, but the unemployment rate in mining regions remained low, and the population of mining towns declined during this period (Graphs 11 and 12).[11] Similarly, agricultural employment fell in the early 2000s, with little impact on the unemployment rate in agricultural regions, which experienced almost no population growth during this period. From 2003, national mining employment recovered sharply, and population growth in the mining regions also accelerated. Employment in agricultural regions has been relatively flat since the early 2000s, and population growth in these areas has remained below average.
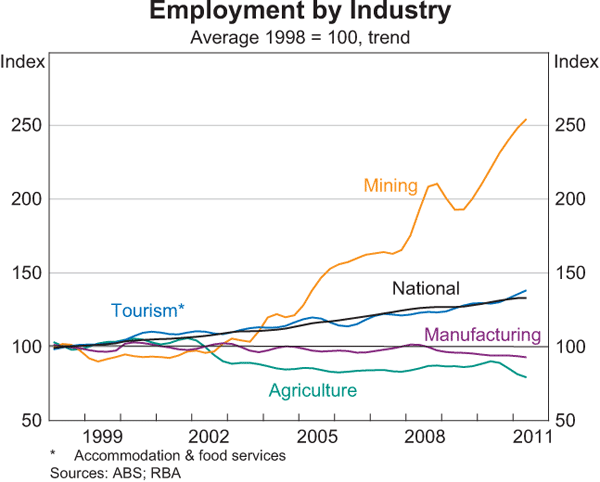
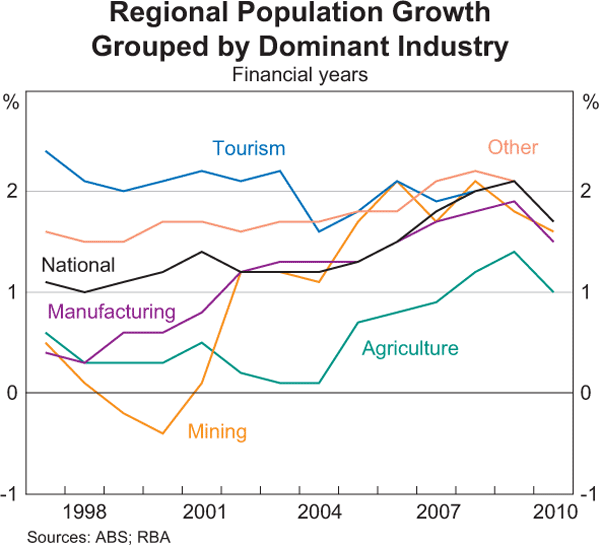
In contrast, regions that are heavily focused towards manufacturing or tourism have experienced population growth around, or above, the national average for most of the past decade, despite higher than average unemployment rates. The labour mobility adjustment mechanism appears to be more important for agricultural and mining regions than for tourism and manufacturing regions; this may reflect differences in regional amenity such as location. While unemployment rates in manufacturing and tourism regions have moved towards the national average over most of the past decade, there has been some divergence since the late 2000s downturn.
Differences between Coastal and Inland Regions
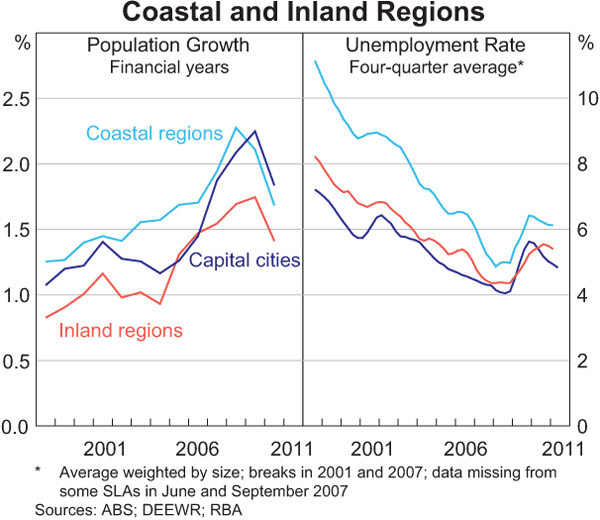
Regional labour market outcomes also vary between coastal and inland areas. While population growth in regions has, in aggregate, been broadly in line with growth in the capital cities, there are marked differences between coastal and inland regions (Graph 13, left panel).[12] Population growth in coastal regions has been notably higher than in inland regions, with annual average population growth of 1.7 per cent and 1.3 per cent, respectively, between 1998 and 2010. Unemployment rates have also been higher in coastal regions than in inland regions, although the gap narrowed through the 2000s (Graph 13, right panel). Over the past year, the unemployment rate for coastal regions has averaged 6.1 per cent compared with 5.4 per cent for inland regions. The higher unemployment rate in coastal regions may reflect a lower likelihood that unemployed people leave these regions to find work elsewhere – perhaps reflecting lifestyle choices – as well as differences in education, skills and the age structure of their population.
Conclusion
Over the past two decades, labour market outcomes in the regional areas of Australia have followed a broadly similar pattern to those in the capital cities. There are notable differences across regions, however, which can be partly explained by variations in regions' industry composition. Regions that are more heavily focused on mining have had low unemployment rates and unemployment rates in agricultural regions have been broadly in line with the national average. Meanwhile, tourism and manufacturing-focused regions have had above average unemployment rates. Nevertheless, the range of unemployment rates across different regions has narrowed over the past decade or so, as the benefits of economic growth have been spread broadly across Australia.
Footnotes
The authors are from Economic Analysis Department. [*]
For earlier Reserve Bank analysis of state and regional developments, see Deverell and La Cava (2008) and Stevens (2010). [1]
The number of statistical regions varies over time because regional boundaries are redrawn following each census. [2]
DEEWR's small area labour markets release disaggregates the regional data from the ABS labour force survey, using data on Centrelink unemployment benefits. [3]
As some of the SLAs are very small, the analysis here focuses on the 641 SLAs that had more than 500 people employed based on the 2006 Census. The number of SLAs varies over time because regional boundaries are redrawn following each census. There are missing data for some SLAs around the time of boundary changes. [4]
For other analysis of differences in regional unemployment rates, see Australian Government (2011) and Borland and Kennedy (1998). [5]
In general, the most disaggregated data from the ABS labour force survey have been used; an exception was the ‘Northern, Far West-North Western and Central West’ statistical region in New South Wales because of missing data for one of its sub-components. [6]
See Debelle and Vickery (1998) for additional discussion of various adjustment mechanisms. For a detailed examination of these factors between 1986 and 1996, see Lawson and Dwyer (2002). [7]
See Garnaut et al (2001) for detailed analysis of industry influences on employment in regional Australia between 1986 and 1996. [8]
The regions included in each industry group change slightly following each census. [9]
To avoid classifying regions into an industry group when there was only a marginal difference between the industry share of employment in the region and the national share, or where no single industry was dominant, a region was only included in an industry group when: there was more than a 50 per cent difference between the region's dominant industry share and the national industry share; and there was at least 2 percentage points between the dominant industry's share relative to the national average and the next largest industry's share relative to the national average. The results are robust to a range of different benchmarks. [10]
Employment by industry is shown at a national level as a time series is not available for SLAs. Note that unemployment rates in this article are based on place of residence, not place of employment, and so cannot account for ‘fly-in fly-out’ workers. For further details on developments in the mining sector and mining employment over the past decade, see Connolly and Orsmond (2011). For discussion of the long-run changes in the industry structure of Australian employment, see Connolly and Lewis (2010). [11]
For detailed analysis of population growth across regions, see BITRE (2011) and Garnaut et al(2001). [12]
References
Australian Government (2011), ‘Box 2: Regional Unemployment Disparities in Recent Years’, in 2011–12 Australian Government Budget – Budget Paper No. 1, Commonwealth of Australia, Canberra, pp 4-13–4-14.
BITRE (Bureau of Infrastructure, Transport and Regional Economics) (2011), Spatial Trends in Australian Population and Movement, Report 122, BITRE, Canberra.
Borland J and S Kennedy (1998), ‘Dimensions, Structure and History of Australian Unemployment’, in G Debelle and J Borland (eds), Unemployment and the Australian Labour Market, Proceedings of a Conference, Reserve Bank of Australia, Sydney, pp 68–99.
Connolly E and C Lewis (2010), ‘Structural Change in the Australian Economy’, RBA Bulletin, September, pp 1–9.
Connolly E and D Orsmond (2011), ‘The Mining Industry: From Bust to Boom’, Paper presented at RBA Conference, ‘The Australian Economy in the 2000s’, Sydney, 15–16 August.
Debelle G and J Vickery (1998), ‘Labour Market Adjustment: Evidence on Interstate Labour Mobility’, RBA Research Discussion Paper No 9801.
Deverell R and G La Cava (2008), ‘Regional Economic Performance’, RBA Bulletin, May, pp 69–78.
Garnaut J, P Connell, R Lindsay and V Rodriguez (2001), Country Australia: Influences on Employment and Population Growth, ABARE Research Report 2001.1, ABARE, Canberra.
Lawson J and J Dwyer (2002), ‘Labour Market Adjustment in Regional Australia’, RBA Research Discussion Paper No 2002-04.
Stevens G (2010), ‘Monetary Policy and the Regions’, RBA Bulletin, December, pp 83–90.