Bulletin – June 2013 Payments Banking Fees in Australia
- Download the article 150KB
Abstract
The Reserve Bank has conducted a survey on bank fees each year since 1997. The results of the most recent survey suggest that banks' fee income from households continued to decline in 2012, but fee income from businesses increased substantially.
Overview
The Reserve Bank's annual bank fee survey provides information on the fees that banks earn from their Australian operations.[1] It focuses on fee income generated by banks in the process of taking deposits, making loans and providing payment services. The 2012 survey included 17 institutions, which together account for around 90 per cent of the total assets of the Australian banking sector. Other forms of non-interest income, such as income earned from funds management and insurance operations, are excluded from the survey. This article provides a summary of the results of the latest survey covering the banks' financial years ending in 2012.[2]
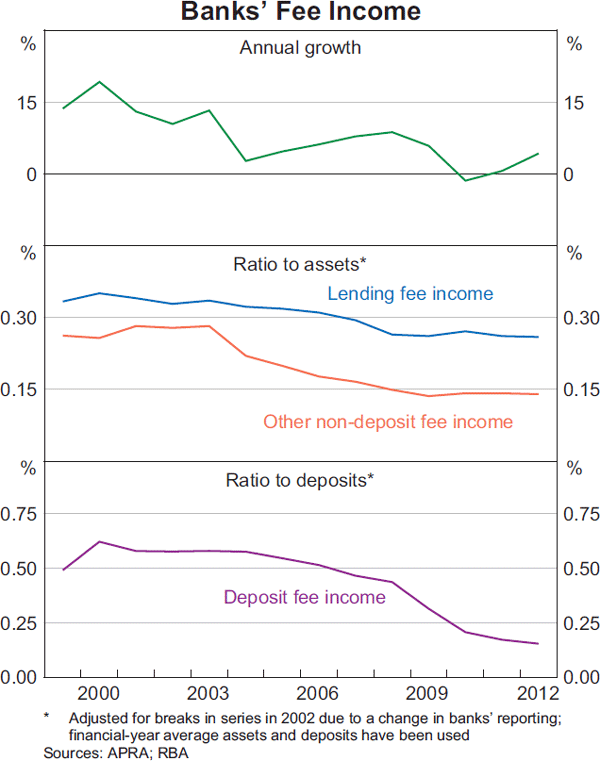
Since 2010, fee income from businesses has risen while banking fees collected from households have fallen. This trend continued in 2012, during which total domestic fee income grew by 4¼ per cent to $11.4 billion (Table 1, Graph 1).
| Households | Businesses | Total | ||||
|---|---|---|---|---|---|---|
| Level $ billion |
Growth Per cent |
Level $ billion |
Growth Per cent |
Level $ billion |
Growth Per cent |
|
| 2009 | 5.2 | 1.5 | 5.8 | 10.1 | 11.0 | 5.9 |
| 2010 | 4.3 | −16.6 | 6.5 | 12.1 | 10.8 | −1.4 |
| 2011 | 4.1 | −5.7 | 6.8 | 4.8 | 10.9 | 0.6 |
| 2012 | 4.1 | −0.3 | 7.3 | 7.0 | 11.4 | 4.3 |
|
Source: RBA |
||||||

Households
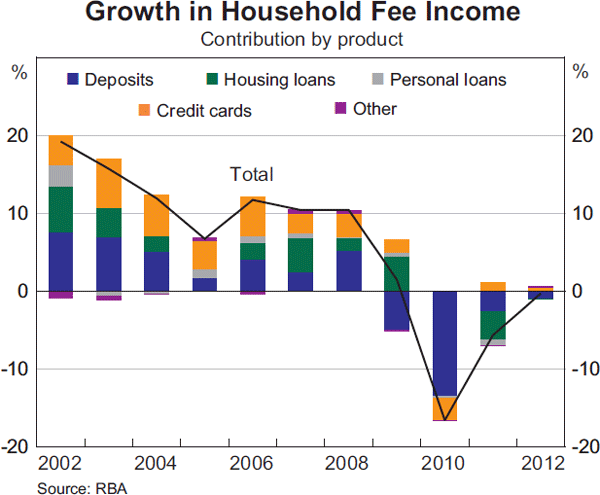
After declining significantly in each of the past two years, banks' fee income from households fell a little further in 2012 (Graph 2, Table 2). Although credit card fee income grew slightly, this was offset by a fall in deposit fee income. Fee income on housing and personal loans remained at around 2011 levels.

| 2010 | 2011 | 2012 | Growth 2012 | Average Growth 2006–2011 |
|
|---|---|---|---|---|---|
| $ million | $ million | $ million | Per cent | Per cent | |
| Loans: | |||||
| – Housing | 1,377 | 1,222 | 1,218 | −0.3 | 6.5 |
| – Personal | 345 | 317 | 317 | 0.0 | 1.8 |
| – Credit cards | 1,244 | 1,293 | 1,312 | 1.5 | 3.8 |
| Deposits | 1,250 | 1,140 | 1,105 | −3.0 | −9.3 |
| Other fees | 94 | 91 | 97 | 6.0 | 6.4 |
| Total | 4,311 | 4,064 | 4,051 | −0.3 | −0.6 |
|
Source: RBA |
|||||
The fall in deposit fee income in 2012 was mostly driven by a decrease in account servicing and transaction fees on transaction deposit accounts. This fall occurred despite a significant increase in household deposits over the year, reflecting both continued competition in the deposit market and the sizeable inflows into at-call savings accounts and term deposits, which are less likely to be subject to fees than transaction accounts. For the household sector, the ratio of deposit fee income to deposits has fallen from 0.6 per cent in 2008 to 0.2 per cent in 2012.
The fall in deposit fee income was partially offset by a slight increase in exception fee income from deposits, which rose for the first time since 2008 (Table 3). Exception fees are charged when there are insufficient funds in an account to cover certain transactions, such as a direct debit payment or a mortgage repayment, or when the credit limit is exceeded on a credit card. The increase in deposit exception fees, which was reported by a limited number of banks, was accounted for by an increase in the number of times that fees were charged, rather than the level of fees. This growth was likely to have been due to the increase in the number of deposit accounts during the year.
| 2010 | 2011 | 2012 | Growth 2012 |
|
|---|---|---|---|---|
| $ million | $ million | $ million | Per cent | |
| Loans | 370 | 315 | 312 | −1.2 |
| – Housing | 44 | 36 | 35 | −2.4 |
| – Personal | 33 | 24 | 25 | 4.1 |
| – Credit cards | 293 | 255 | 251 | −1.5 |
| Deposits | 299 | 235 | 261 | 11.0 |
| Total | 669 | 550 | 572 | 4.0 |
|
Source: RBA |
||||
Fee income from housing loans fell marginally in 2012. Account servicing fee income from housing loans increased in the year but was offset by a fall in other fee income (which includes security fees, exception fees and fees for breaking fixed-rate loans). In the year to September 2012, the growth in housing loan approvals, and therefore establishment fee income, may have contributed to the growth in account servicing fees. Exception fee income from household loans was little changed in 2012 after falling significantly over the previous two years.
The slight decline in housing loan fee income occurred despite the 5 per cent increase in mortgage lending over the year. This divergence partly reflected the decision by a number of banks to waive application and other fees. It also resulted from a continued fall in exit fee income following the Federal Government's ban on exit fees on variable rate home loans in July 2011.[3] In the lead-up to the ban there had been speculation that lenders would increase other fees to compensate for the potential loss of income. However, average fees (excluding exit fees) charged on variable rate mortgages discharged after three years have declined slightly for both bank and non-bank lenders since the ban was implemented (Table 4).[4]
| Lender type | Establishment fee | Service fee (over three years) |
Discharge fee(c) | Total | ||||
|---|---|---|---|---|---|---|---|---|
| Level | Change | Level | Change | Level | Change | Level | Change | |
| Major banks | 449 | 8 | 398 | −89 | 255 | 62 | 1,102 | −19 |
| Other banks | 389 | −68 | 557 | 81 | 213 | −83 | 1,160 | −70 |
| Credit unions and building societies | 546 | −49 | 198 | 76 | 59 | −47 | 803 | −19 |
| Other lenders | 477 | −106 | 249 | −5 | 280 | −83 | 1,006 | −194 |
| All institutions(d) | 442 | −16 | 416 | −42 | 239 | 20 | 1,098 | −37 |
|
(a) Average across institutions, based on a $250,000 loan to owner-occupier discharged
after three years; includes standard variable and package products
Sources: ASIC; InfoChoice; RBA |
||||||||
Fee income earned from personal loans was flat, despite a contraction in personal credit over 2012 (Table 2). Increases in account servicing and other fees contributed to a 1½ per cent increase in credit card fee income. The increase in account servicing fees was due to a small rise in the number of credit cards on issue; annual fees on credit cards were little changed over the year (Table 5). There was also a slight fall in transaction fees in line with a fall in the value of cash advances in the year.
| 2010 | 2011 | 2012 | Change 2012 | Average Change 2006–2011 |
|
|---|---|---|---|---|---|
| Per cent | Per cent | ||||
| Annual fees ($)(b) | |||||
| Low-rate cards | 53 | 54 | 55 | 2.1 | 5.5 |
| Standard cards | 29 | 29 | 29 | 0.0 | 0.6 |
| Standard rewards-based cards | 80 | 80 | 80 | 0.0 | 0.0 |
| Gold rewards-based cards | 151 | 137 | 128 | −6.1 | −0.5 |
| Platinum rewards-based cards | 283 | 283 | 246 | −12.8 | 2.7 |
| Cash advance fees(c) | |||||
| Own bank's ATM ($) | 1.1 | 1.1 | 1.1 | 0.0 | −4.7 |
| – Per cent of value | 1.8 | 1.8 | 1.8 | 0.0 | 10.0 |
| Other institutions' ATM ($) | 1.1 | 1.1 | 1.1 | 0.0 | −8.1 |
| – Per cent of value | 1.8 | 1.8 | 1.8 | 0.0 | 4.7 |
| Overseas ATM ($) | 3.6 | 3.6 | 3.1 | −15.5 | 0.0 |
| – Per cent of value | 1.7 | 1.8 | 1.8 | 3.6 | 4.0 |
| Foreign currency conversion fee (per cent of value) |
2.6 | 2.9 | 2.9 | 0.0 | 3.4 |
| – Late payment fee ($) | 15 | 14 | 14 | 0.0 | −15.5 |
| – Over-limit fee ($) | 14 | 10 | 10 | 0.0 | −20.1 |
|
(a) Simple average of fees for cards with interest-free periods issued by major banks,
except for the annual fee on no-frills cards, which is based on a wider
sample of banks; note that changes in the sample affect the average fee;
as at June Sources: RBA; credit card issuers' websites |
|||||
Businesses
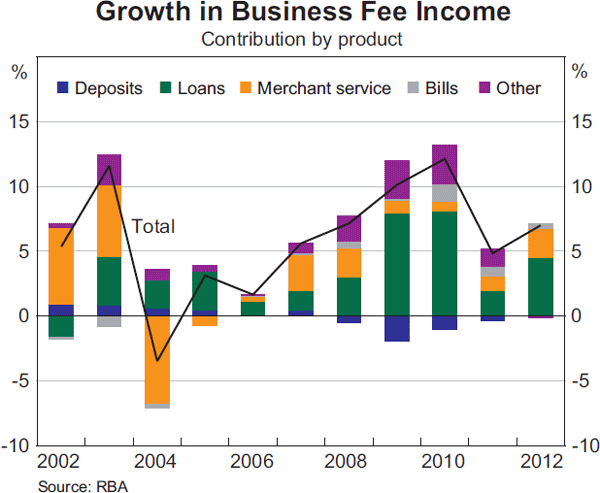
Total fee income from businesses increased by 7 per cent in 2012 (Graph 3, Table 6). Much of this growth was due to fee income from business loans, which increased by 11 per cent. This rise was largely the result of an increase in the account servicing fees charged to businesses and reflects modest growth in the number and value of new loans as well as an increase in the fees themselves. Fee income from bank bills (which includes charges for arranging bank bill facilities and accepting or endorsing bank bills) also increased slightly in the year; however, this was not broad based across banks.[5]

| 2010 | 2011 | 2012 | Growth 2012 | Average Growth 2006–2011 |
|
|---|---|---|---|---|---|
| $ million | $ million | $ million | Per cent | Per cent | |
| Deposit accounts | 646 | 624 | 623 | −0.1 | −5.1 |
| – of which: exception fees | 60 | 50 | 46 | −8.2 | na |
| Loans | 2,708 | 2,837 | 3,144 | 10.8 | 12.1 |
| – of which: exception fees | 52 | 38 | 36 | −5.6 | na |
| Merchant service fees | 1,839 | 1,910 | 2,067 | 8.2 | 4.9 |
| Bank bills | 187 | 236 | 262 | 11.0 | 28.2 |
| Other | 1,135 | 1,222 | 1,212 | −0.8 | 12.5 |
| Total | 6,514 | 6,830 | 7,308 | 7.0 | 7.9 |
| – of which: exception fees | 112 | 88 | 81 | −7.1 | na |
|
Source: RBA |
|||||
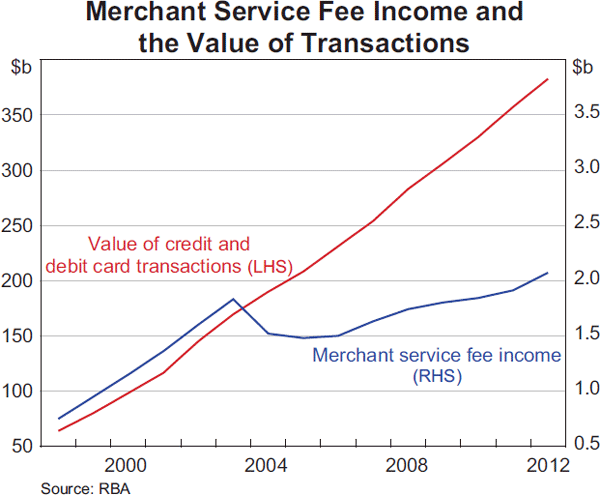
Another driver of growth in business fee income was the increase in fees earned from providing merchant services. These fees are charged by banks for providing merchants with credit and debit card transaction services, with around 70 per cent of these fees paid by small businesses. The increase was the largest since 2007 and reflected growth in the number of transactions, particularly debit card transactions, and changes in the pricing for some services (partly as a result of the pass-through of changes to interchange fees). Since the introduction of the Reserve Bank's credit card interchange fee reforms in 2003, total merchant service fee income has grown by just 13 per cent (the value of card transactions has more than doubled) (Graph 4).

Business deposit fee income was little changed in the year, despite growth in business deposits. This mirrors the development in household deposit fees, where continued strong competition for deposits contributed to the fall in fees charged on deposit accounts. Exception fee income from businesses declined slightly over the year; however, this fall was smaller than in the prior two years.
Footnotes
The author is from Domestic Markets Department. [*]
The data from the survey are published in the Reserve Bank's Statistical Table F6, ‘Domestic Banking Fee Income’. [1]
All data in this article are based on individual banks' financial years, which differ between banks, apart from data presented in Tables 4 and 5. [2]
For more information on the effect of the exit fee ban in 2011, see Rudd and Stewart (2012). [3]
Average fees were calculated over a three-year period as exit fees did not generally apply if a borrower exited the loan after three years. [4]
Note that this year, one bank reclassified fee income from bank bills as interest income in their statutory reports and no longer includes them in the survey; as a result, previous years' figures for bank bills fee income have been revised down to make them comparable to data for 2012. [5]
Reference
Rudd S and C Stewart (2012), ‘Banking Fees in Australia’, RBA Bulletin, June, pp 43–47.