Statement on Monetary Policy – November 2017 Box D: Updated Weights for the Consumer Price Index
The December quarter 2017 Consumer Price Index (CPI) release will include updated weights for the individual goods and services in the index. It is necessary to update the weights periodically to reflect changes in household consumption patterns. The previous update to the CPI weights occurred in 2011. The Australian Bureau of Statistics (ABS) has recently released a paper that provides the updated weights that will be used in the December quarter release.[1] The key changes and the implications for the Bank's assessment of inflation are outlined below.
Changes to the Weighting Scheme
The CPI aggregates the prices of around 1000 items into a single index, which is designed to measure changes in the price of the average basket of goods and services acquired by households in capital cities. Each individual item is categorised into one of around 90 expenditure classes and then into 11 expenditure groups. The weights of the items in the CPI are largely derived from the ABS' Household Expenditure Survey (HES), which is conducted on a 5- or 6-yearly basis. The new weights are based on the survey conducted in 2015/16.
The CPI is a fixed-quantities Laspeyres-type index, which assumes that in the short run consumers do not adjust the quantities of goods and services that they purchase. The weight of each item is fixed in a base period at its expenditure share in the updated HES data. From the base period onwards, the effective weights of components change in line with relative price movements but do not change to reflect changes in the quantity of each item consumed. For example, the effective weight of audio, visual & computing (AVC) equipment in the CPI tends to decline in the years following a reweighting because AVC equipment prices have fallen relative to other goods. Conversely, the effective weight of tobacco has risen since the previous reweighting, as tobacco prices have increased faster than those for other goods.
In practice, however, households regularly adjust the quantities of goods and services that they consume, reflecting changes in preferences, household incomes and relative prices. As a result, the effective weight of an item in the CPI can deviate from the item's actual share in household expenditure until the next time that the CPI index is reweighted using updated HES data. Importantly, households tend to buy more of goods and services that have become relatively cheaper over time, which means that Laspeyres-type indexes like the CPI suffer from positive ‘substitution bias’. This can lead to inflation being overstated when the expenditure weights are out of date.
Table D1 compares the expenditure weights of the 16th series CPI and the new 17th series CPI. Expenditure on housing – which includes rents, the cost of building new dwellings, utilities and maintenance costs – has the largest weight in both the new index and the previous index, accounting for over 20 per cent of the CPI basket. Food and non-alcoholic beverages account for around 16 per cent of household expenditure, while transport and recreation & culture account for a further 10 and 13 per cent respectively.
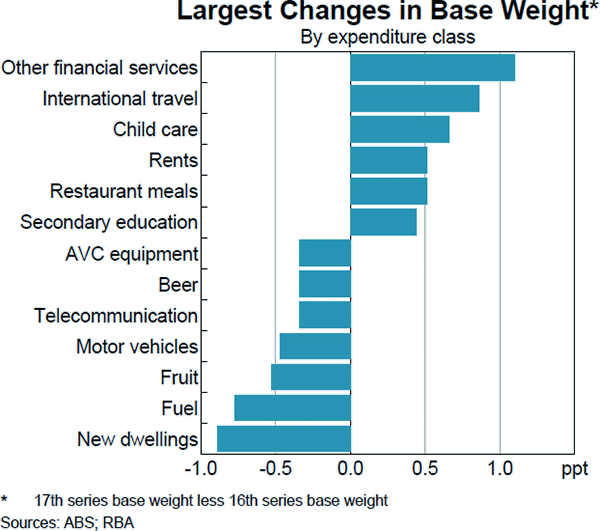
The changes in the base weights of expenditure groups between the 16th and 17th series are generally smaller than the changes that occurred when the index was reweighted in 2011. The largest change in expenditure group weights in the 17th series is a decline in the weight of transport by 1.2 percentage points (Table D1), reflecting lower prices for both automotive fuel and motor vehicles (Graph D1). Meanwhile, the weight of education in the 17th series CPI is 1.1 percentage points higher. This increase was fairly broadly based across all types of education, and was driven by both higher costs and larger student numbers. The weight of childcare in average household expenditure also increased. There has been a further increase in spending on certain types of goods and services as incomes rise, including international travel and eating out. The weight of rents in the CPI has increased since 2011 because the share of people renting has increased. Meanwhile the weight of new dwelling purchases by owner-occupiers has declined, because an increase in the number of purchases has been offset by an increase in the share of attached dwellings, which are typically cheaper than houses.
| Per cent | ||
|---|---|---|
| Expenditure Group | 16th series (2011) | 17th series (2017) |
| Housing | 22.3 | 22.7 |
| Food & non-alcoholic beverages | 16.8 | 16.1 |
| Recreation & culture | 12.6 | 12.7 |
| Transport | 11.6 | 10.3 |
| Furnishings, household equipment and services | 9.1 | 9.4 |
| Alcohol & tobacco | 7.1 | 7.1 |
| Insurance & financial services | 5.1 | 5.8 |
| Health | 5.3 | 5.4 |
| Education | 3.2 | 4.3 |
| Clothing & footwear | 4.0 | 3.6 |
| Communication | 3.1 | 2.7 |
| Total | 100.0 | 100.0 |
|
Source: ABS |
||

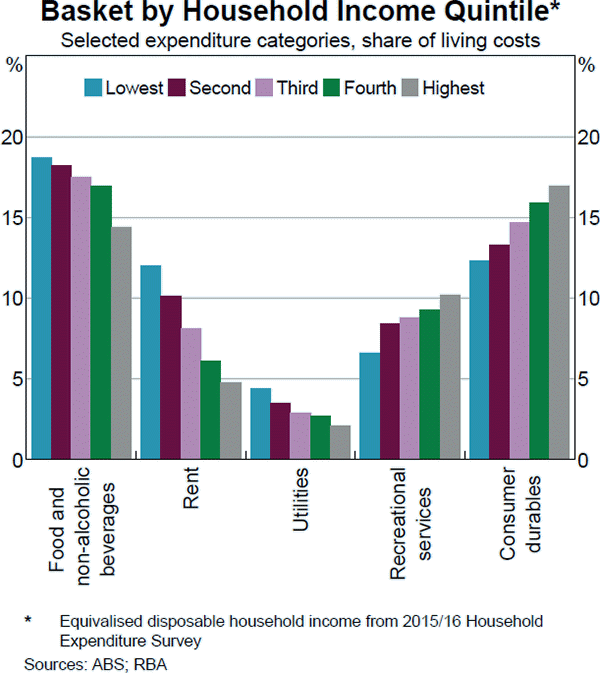
The CPI weights are based on average expenditure behaviour. Expenditure patterns do, however, differ significantly between different households. For instance, lower-income households spend a larger proportion of their income on food and utilities and a smaller proportion on consumer durables and recreational services (Graph D2). The ABS has also published new weights that will apply to the Living Cost Indices from the December quarter that capture some of these differences.

Effective Weights and Substitution Bias
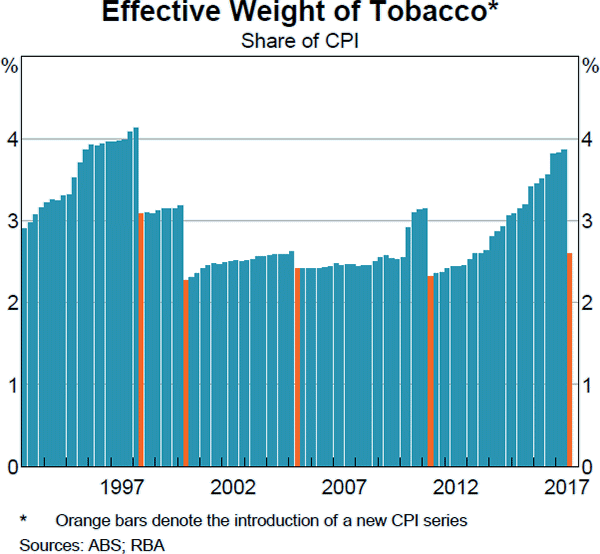
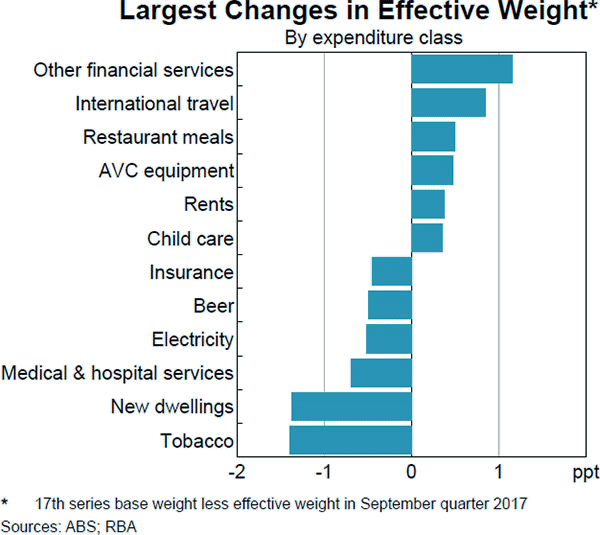
As noted above, the effective weights of goods and services change between base periods in line with changes in relative prices. Items that displayed either particularly strong or particularly weak price growth over the period 2011 to 2017 experienced large fluctuations in their effective weights. For example, the effective weight of tobacco rose from around 2½ per cent in 2011 to be almost 4 per cent by mid 2017 (Graph D3). Over this period, tobacco prices rose sharply, boosted by increases in the tobacco excise. However, in the 17th series CPI, the weight of tobacco in the CPI basket has been revised lower to be back around 2½ per cent, indicating that households have reduced the quantity of tobacco consumed as prices have risen. In contrast, the prices of AVC equipment declined over this period (noting that prices in the CPI are adjusted lower to reflect improvements in quality from technological advances). This saw AVC's effective weight towards the end of the 16th series CPI fall well below the actual expenditure share of AVC equipment. With the introduction of the 17th series, the effective weight on AVC equipment has increased, indicating that households have purchased more AVC goods (in number or quality) as prices have declined (Graph D4).


The ‘substitution bias’ that arises when weights are not updated becomes larger as CPI weights become more out of date and the effective weights diverge from the actual current expenditure shares. Analysis by the ABS of previous reweightings indicates that the average annual substitution bias in inflation is around 0.2 percentage points, but by the fifth year after reweighting the bias is typically somewhat larger. Consistent with this, the Bank estimates that substitution bias had reached around 0.4 percentage points for year-ended CPI inflation to the September quarter 2017.
Substitution bias can also affect measures of underlying inflation, but not by as much as for measures of headline CPI inflation. The Bank estimates that average annual substitution bias in underlying inflation since 1992 has been around half as much as the substitution bias in headline inflation. Using the updated 17th series weights, the Bank estimates suggest that the substitution bias for measures of underlying inflation over the past year has been around 0.3 percentage points.
More Frequent Updates to the CPI in Future
To date, the 5- or 6-yearly release schedule of the HES has determined the schedule for updating the CPI. However, from the December quarter 2018, the ABS will update the CPI weights on an annual basis between HES surveys.[2] These updates will draw upon the Household Final Consumption Expenditure data from the Australian National Accounts. Annual updates to the component weights will then occur each December quarter, until the next HES survey is completed. This process will mean that the CPI better captures consumers' substitution between items, so the size of substitution bias in the CPI will be much lower, and the published measures of CPI and underlying inflation should be more accurate in the future. Nevertheless, the measured CPI will remain subject to other measurement issues, including lower-level substitution bias (for example, substitution between different brands), as well as biases related to quality adjustment and the introduction of new goods. The Bank supports the move to annual reweighting.