Equal Employment Opportunity Annual Report – 1999 Evaluation of the Program
Key Indicators
The data and analysis set out below, together with statistics in Appendix 4, provide a measure of progress of the four designated EEO groups within the Bank, and a benchmark for appropriate future action. Overall staff numbers declined this year by 213, a similar decline to last year (212).
The significant reduction in staff numbers occurred as a result of a redundancy program and the transfer of 70 employees, the majority from Bank Supervision Department, to the new Australian Prudential Regulatory Authority (APRA) in July 1998. For the first time in the Bank's EEO history, total staff numbers have fallen below 1,000 employees. This is a consequence of a greater emphasis on core functions, a number of outsourcing programs over the last three years, and the impact of the Wallis Inquiry which recommended the establishment of the Australian Prudential Regulatory Authority.
An analysis of contract staff was conducted during the year. Contract staff represent approximately 11% of total staff and are heavily represented within the occupational groups: Managers and Administrators (18%); Professionals (36%); and Elementary Clerical & Sales (19%). People from non-English speaking backgrounds account for 33% of contract staff (compared to 28% of total staff). This would appear to be indicative of contract staff employed in the information technology and note processing areas. Women represent 36% of all contract staff.
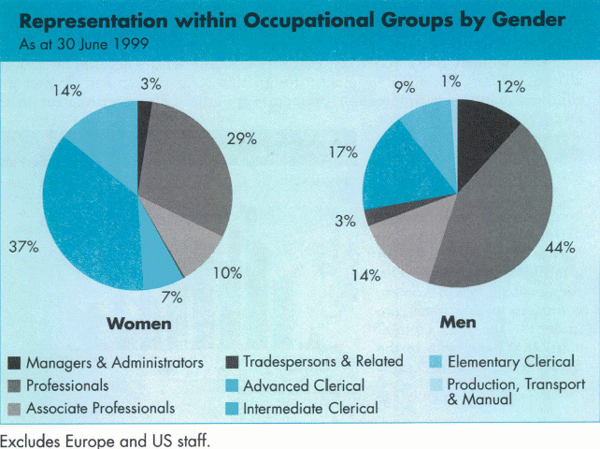
Occupational groupings have been analysed using the Australian Standard Classification of Occupations (ASCO) codes from the Australian Bureau of Statistics. These are described more fully in Appendix 3.
Women
-
Women represent 45% of the Bank's staff, consistent with the representation levels of recent years. When the EEO statistics were first collected in 1987 48% of staff were women. This gradual decline has been largely due to the impact of technology and the resultant loss of clerical jobs. Only approximately 41% of the Bank's staff are engaged in clerical occupations. Of these 64% are held by women compared to 87% in 1991.
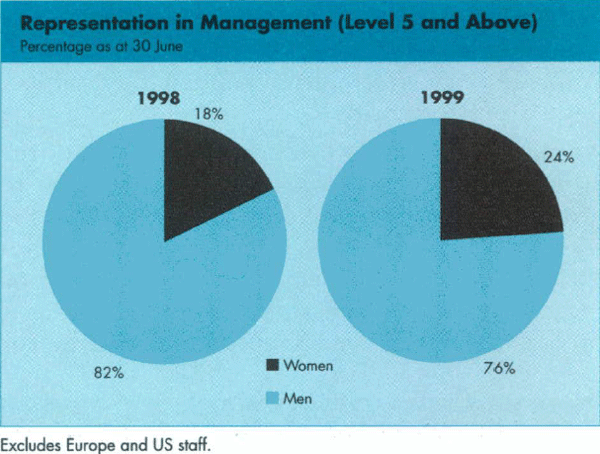
- 57% of the Bank's staff are in managerial or professional positions. 33% of these positions are held by women. The percentage of management positions filled by women (Level 5 and above) increased from 18% as at 30 June 1998, to 24% as at 30 June 1999.
-
Resignations and retirements are shown in separate tables. Of the 251 staff who resigned from the Bank this year, 51% were women, compared to last year's 49%. Redundancies account for 52% of all resignations. The main reasons for resignation for both men and women are concerns about career progression (promotion opportunity, long-term career path) and remuneration. For women, an additional factor influencing their decision to leave was working hours.
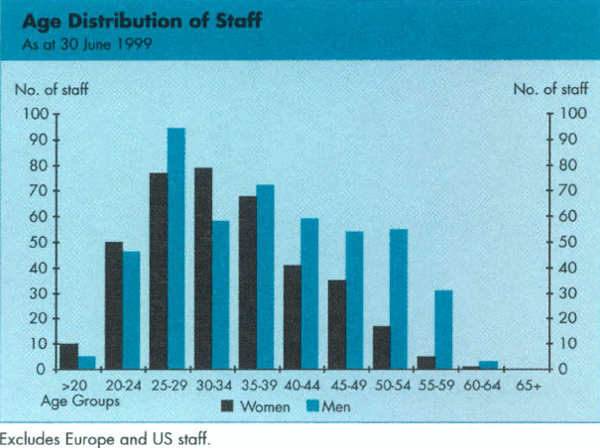
- As a group, women are younger than men, but the difference continues to narrow. At year end, 49% of total Bank staff were under the age of 35; 56% of women, compared to 43% of men are under the age of 35. Of total staff, 48% have been in the Bank for ten years or less.
People from Non-English Speaking Backgrounds
- The representation of people from non-English speaking backgrounds (NESB1 and NESB2) has increased slightly from 25% last year to 28% of staff overall. In 1991 it was 19%.
- Contract staff account for nearly 11% of total staff numbers. Of these, 33% are people from non-English speaking backgrounds (NESB1 and NESB2).
- Overall, 19% of total Bank staff are in management positions (Level 5 and above). The proportion of management positions filled by staff from non-English speaking backgrounds is 14%.
- 49% of the staff from non-English speaking backgrounds are in professional/associate professional occupations, which is not significantly different from staff as a whole where 50% are in these occupations.
People with Disabilities and Aboriginal and Torres Strait Islander People
- The representation of Aboriginal and Torres Strait Islander people has remained the same as last year.
- The representation of people with disabilities has also remained the same as last year.
-
It is important to remember that any analysis of the Bank's performance in the employment of people with disabilities has to take particular account of the problem of under-reporting, reasons for this including:
– the broadness of the category which in many cases leaves the definition of what is a disability to the individual;
– fear or embarrassment about identifying; and
– the fact that a disability can be acquired after commencing employment (data are only collected at the recruitment stage).
Staff Selection
- Recruitment increased from 83 last year to 127 this year, the first increase in two years. Of the staff recruited, 52% were women, 38% were from non-English speaking backgrounds, 2% were people with disabilities and 2% were Aboriginal and Torres Strait Islander people.
- Women represented 33% of applicants for new graduate positions and 25% of the actual intake, a decline of 1% from last year's graduate intake.
- The Bank offered 15 places under the Australian Traineeship Program during the year: 9 recruits were women, 1 was a person with a disability and 2 were Aboriginal and Torres Strait Islander persons.
- The number of promotions has decreased from 146 last year to 101 this year. Overall, the promotion rate for women has declined to 10% and 13% for men. Last year the promotion rates were 13% for women and 14% for men.
- During the year 130 staff selection panels were conducted for both internal and external position applicants. All panels have a representative of Personnel Policy Department. Of these 25% were chaired by a woman and 92% had a female member. This is an increase on last year's figures where 19% of panels were chaired by a woman and 81% had a female member.
Career Development & Staff Training
-
Of all Bank staff 50% attended some formal internal training during the year, a decline from 67% last year. All EEO groups were highly represented in internal training attendances. The rates for attendance at external training were lower than for internal training, with around 38% of staff attending external training. Around 32% of women and 43% of men attended external training. At Levels 1 to 4, the gender imbalance favours men, whereas at Level 5 and above, a higher percentage of women within each classification level attended external training. However, the higher rate of attendance of women at the higher classification levels does not have as great an impact on overall external training levels as 73% of staff are at Levels 1 to 4. This overall imbalance in favour of males may be a reflection of the high level of external training attendance in the Bank's information technology area, traditionally an area where males make up the majority. Seven women attended the Springboard program and two senior women were mentors for the program.
-
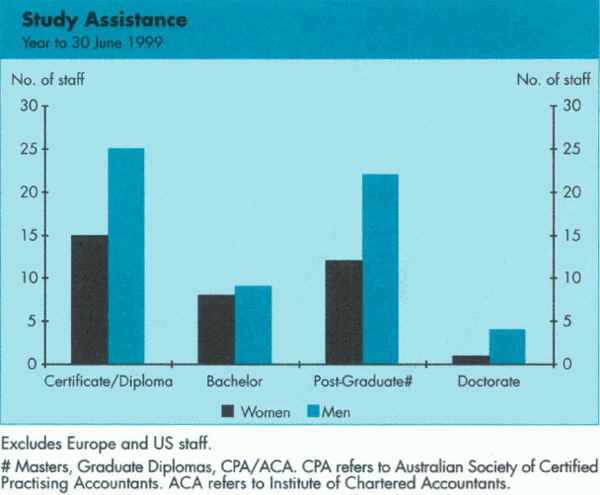
Overall 11% of staff received study assistance over the year. 12% of men undertook assisted study compared to 10% of women. The lower representation of women continues to occur at classification Levels 3 and below, although the percentage gap at these levels has narrowed since last year.
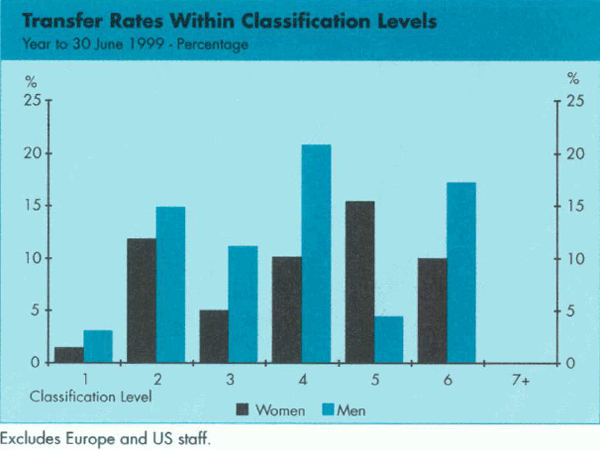
- There were 82 formal internal staff transfers during the year, a fall from last year's 138. The overall transfer rate was 7% for women and 11% for men.
Conditions of Employment
-
8% of women and 3% of men took paid parental leave during the year. 25% of women who returned to work from parental leave did so within 12 months of commencing the leave. Men were away for an average of 5 days (total paid entitlement).
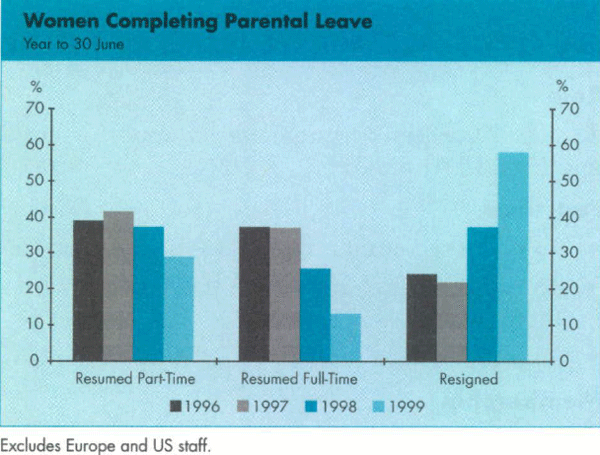
- The number of resignations from parental leave was the highest since 1995, and amounted to the lowest rate of return since 1989/90. Of those women completing parental leave during the year, only 42% returned to work compared to 63% last year. This low return rate is mainly due to redundancies (68% of all resignations from parental leave) in business areas where a higher proportion of women were on parental leave. Of those who returned to work 69% returned part time.
- During the year 41 women worked part time (3 instances of permanent part-time, 8 temporary, 26 contiguous with parental leave, 8 on contract and 1 casual; some individual women took more than one form of part-time work within the year). There were 7 resignations of part-time officers, 5 of which were redundancies. One redundant position was a permanent part-time position.
- As was the case last year, around one third of staff took carer's leave during the year. It was used equally by men and women and the average number of days was 2.4.