Reserve Bank of Australia Annual Report – 1965 Economic and Financial Conditions
The Domestic Economy
We entered 1964/65 with activity running at high levels. As unused reserves of labour and productive capacity were small, it was clear that expenditure could not go on rising at a rate of around 10 per cent a year without exerting serious strains on the domestic economy and on the balance of payments. In the event, there was a slight slowing of the rate of increase in expenditure as the year progressed, but for the year as a whole it was higher than the economy could comfortably accommodate, as evidenced by the sharp rise in imports, the tightening labour market, and some increase in costs and prices.
All categories of domestic expenditure rose strongly over the year, with the largest movements being recorded in public authority expenditure (both capital and current), residential building, and private expenditure on new plant and equipment. Increases in personal consumption expenditure (including outlay on new motor vehicles) and nonresidential building were somewhat smaller but still substantial.
Dwelling Commencements
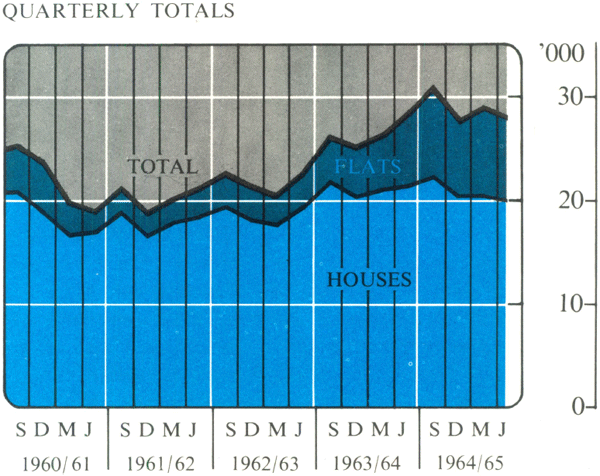
Nearly 117,000 new dwellings were commenced, 9 per cent more than the record number in the previous year. A significant feature in recent years has been the increasing proportion of flats in the total; in 1964/65 the whole increase in dwelling commencements was in flats, which represented nearly 30 per cent of all new starts, compared with less than 10 per cent only six years earlier. Most of these flats are for owner-occupation, and as they are built in advance of sale there is a danger of instability in that unsold stocks can quickly accumulate.
Dwelling construction levelled out towards the end of 1964/65, with rising activity on flats offsetting some decline in housing activity. Figures of building and finance approvals suggested that some decline in residential building could be in prospect.
Non-residential building, particularly of factories, shops and offices, remained buoyant throughout the year and together with the higher level of residential building activity aggravated shortages of some types of building labour.
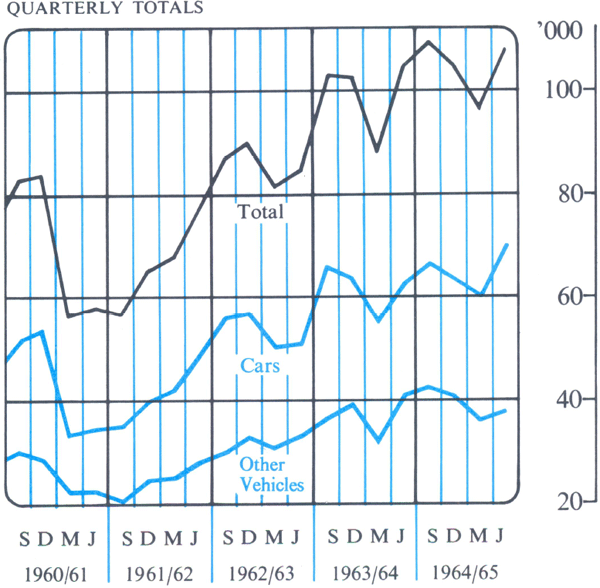
Until 1962/63, registrations of new motor vehicles had never reached 300,000 in any year. In 1963/64 they passed 400,000 and in 1964/65 rose further to 421,000.
After moderate increases in the previous two years, non-farm stocks rose substantially in 1964/65. The increase appears to have occurred in most categories of manufacturing, as well as in trade. There was no indication at the end of the year that stocks generally were uncomfortably high, but it seems unlikely that a similar addition to stocks will occur in 1965/66.
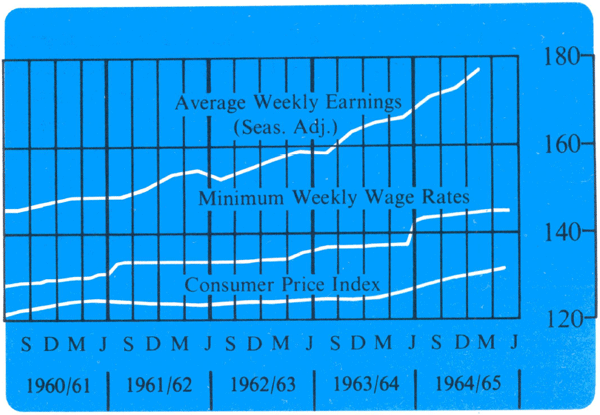
Price and Wage Indexes
BASE 1952/53 = 100
Allowing for the build-up of stocks, the strong rise in imports still suggests that domestic output in 1964/65 increased much less than final expenditure. Despite a serious drought in some parts of Australia, rural output again increased overall; this limited the fall in export income but did not contribute directly to supplies for the Australian market. Production of most types of manufactured goods and basic materials rose significantly, but industrial disputes imposed heavy costs in some industries. With due allowance for difficulties of measurement, it appears that the rate of growth in industrial productivity slackened a little in 1964/65.
Motor Vehicle Registrations
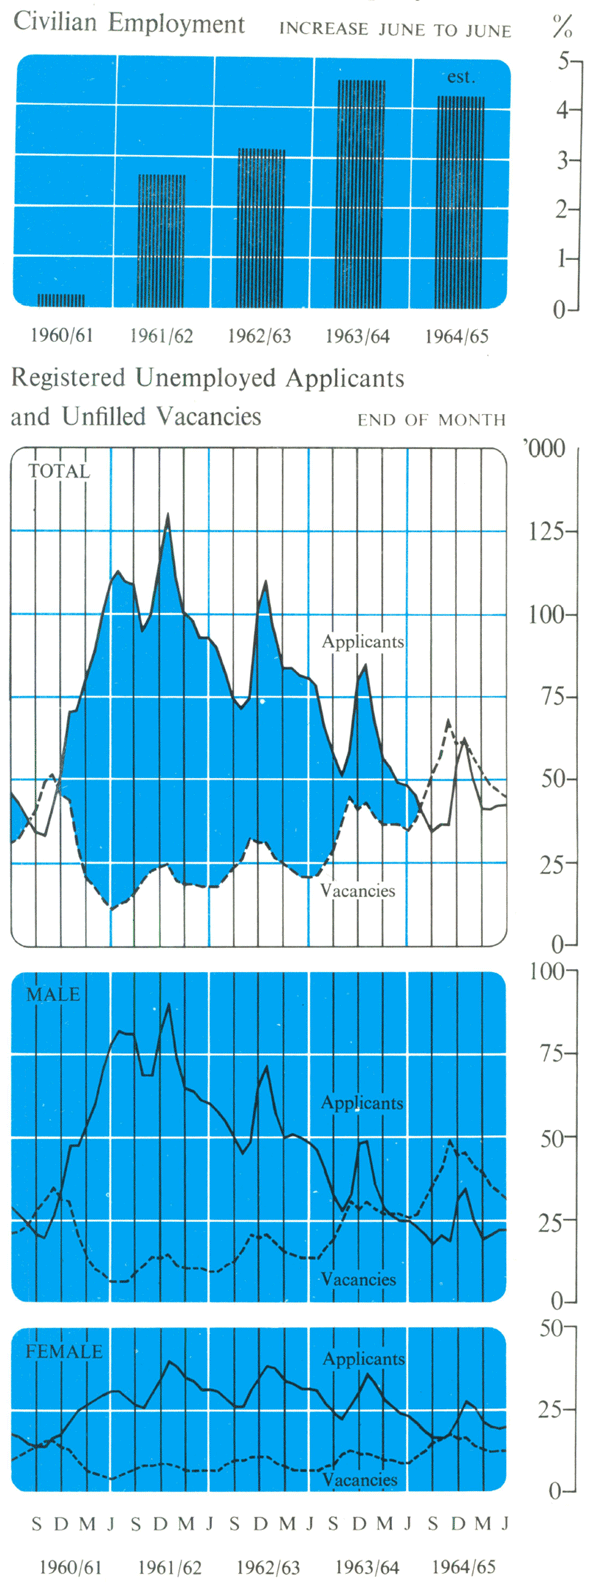
The largest net migrant intake for thirteen years helped offset a reduced number of school leavers and the much smaller scope for reducing unemployment; civilian employment again rose by more than 4 per cent. Persons registered for employment with the Commonwealth Employment Service fell over the year from 48,543 to 42,145, following a fall of 33,000 the previous year, and registered unfilled vacancies rose from 35,940 to 44,689.
Prices rose more than in recent years. The Consumer Price Index in the June quarter was 4 per cent up on a year earlier; this was the largest rise since 1956/57 but much of it was explained by higher food prices resulting from adverse seasonal conditions, and by higher charges for government services.
A £1 a week increase in the Commonwealth basic wage in June, 1964 gave a sharp increase in award wage rates. At the end of June, 1965 the Commonwealth Conciliation and Arbitration Commission increased margins in the metal trades by 1½ per cent of the sum of the six capital cities' basic wage and the margin for the trade concerned. The Commission expected that the increases would be speedily reflected throughout its awards.
Actual earnings in 1964/65 again rose faster than award rates, as overtime and over-award payments increased.
Employment and Unemployment
Although there were times during the year when it seemed that pressures, particularly on the labour market, might ease, they remained quite strong. Firm policies to restrain the growth of expenditure were therefore appropriate.
By the end of the year some indicators suggested a possible slowing in economic tempo but further substantial increases in governmental and some types of private expenditure were in prospect, and overseas funds were still falling. Official policies should remain flexible to enable action to be taken quickly as changed circumstances may require, but at the beginning of 1965/66 it seemed that the need to contain the growth of expenditure overall was continuing.
The Balance of Payments
After an unusually favourable year in 1963/64, the Australian balance of payments moved into heavy deficit. While this was due largely to the sharp rise in imports associated with rapid growth of expenditure in Australia, it also reflected some unfavourable developments abroad.
High rates of growth in the main industrial economies in 1963 and 1964 were accompanied by a rapid expansion of world trade. Towards the end of 1964 growth rates began to slacken, and this tendency became more pronounced in 1965 as the United Kingdom and some other countries took action to ease the pressure on domestic resources and their balance of payments. Over the previous two years the terms of trade had shifted in favour of exporters of primary products, but in the second half of 1964 prices for many basic commodities declined and this trend continued in 1965.
The terms of trade moved against Australia in 1964/65, after several years in which price changes had been to our advantage. The Import Price Index showed an increase of 1½ per cent over the year, while export prices continued the downward trend which began in the June quarter of 1964, to show a drop of 9 per cent from June to June and 8 per cent on average between the two financial years. This fall was mainly a reflection of lower wool prices. After a strong market in most of 1963/64, wool prices weakened towards the end of that year and fell further from the new season's opening sales in August. They levelled out in the last few months, but finished the year about 15 per cent lower than in June, 1964; the average price between the two years showed a slightly larger fall. With a lower volume of wool shipments, this decline in prices was reflected fully in reduced export proceeds.
Wheat exports were down 16 per cent in value, due to smaller quantities being available for shipment in the first half of the year and somewhat lower prices in the second half. The 1964/65 crop was again a record and satisfactory markets were found for it. This will be partly reflected in 1965/66 exports, and could help to offset the effect of the smaller crop in prospect. Sugar proceeds were lower with the fall in world prices following the abnormally high 1963/64 levels, copper exports were reduced by the industrial dispute at Mount Isa, and lower iron and steel exports reflected increased domestic usage.
The lower returns from wool, wheat and other products were partly offset by some substantial gains. Meat exports were again higher, with good markets overseas for beef and all other meats, exports of most metals and minerals rose, and motor vehicles and other manufactured goods showed encouraging increases. Total exports, however, were still nearly 5 per cent lower than in the previous year.
At the same time, imports rose by 23 per cent. A high rate established in the early months was sustained throughout the year, apart from minor variations which could have been due to shipping and wharf congestion. Nearly all categories rose, but the largest percentage increases were in transport equipment, particularly civil aircraft and complete motor vehicles, and machinery, both farm and non-farm. Materials for manufacturing industry, which account for nearly half of total imports, and finished consumer goods both rose by around 18 per cent. Imports of steel for construction and manufacturing uses increased very sharply.
With lower exports and higher imports and net payments for freight and other services, there was a deficit on current overseas transactions of £375 million, compared with only £25 million in 1963/64. Only twice before has there been a deficit of this magnitude and in both years—1951/52 and 1960/61—there was a large involuntary accumulation of imported stocks, leading to a cutting back of orders and a sharp fall in imports the next year (reinforced in 1952/53 by import restrictions). There was some build-up of stocks in 1964/65, and any further increase in 1965/66 will probably be smaller, but there seems little reason to expect imports to fall appreciably from the 1964/65 rates. Although there were special items—e.g. large copper imports—which will not recur, there could well be other special items in the 1965/66 bill.
Net capital inflow was a little lower than in the previous year. On official account, proceeds of a $us25 million loan subscribed in Europe and further drawings on an International Bank loan for the Snowy Mountains Hydro-Electric Scheme were more than offset by the redemption of a £E12 million loan in London, and other items. A net outflow of £30 million on account of marketing authorities reflected increased amounts owing by wheat purchasers following large sales on credit terms.
Balance of Payments
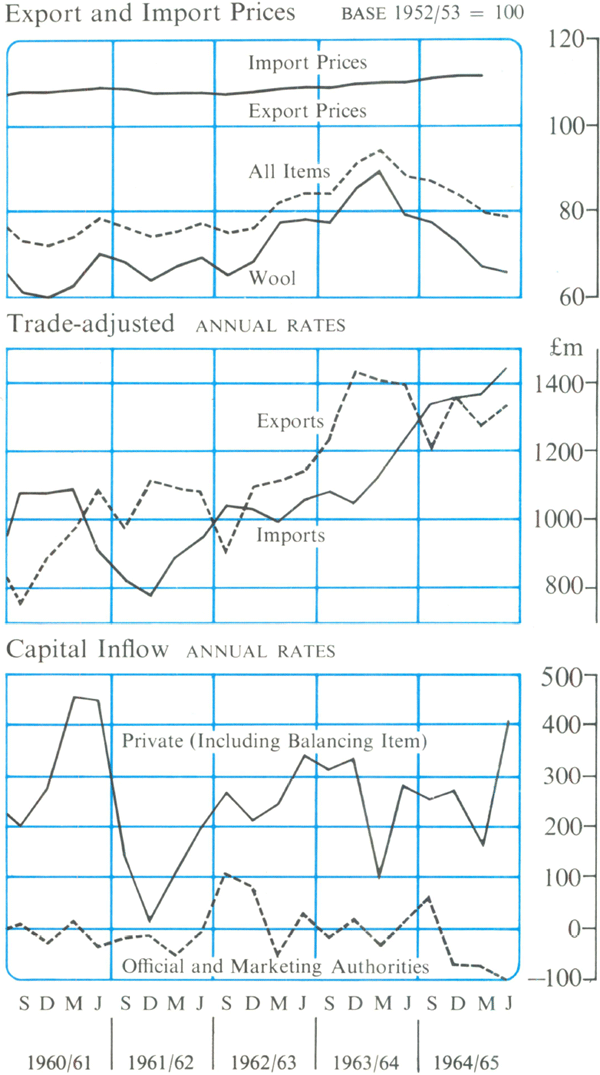
Including retained earnings and the balancing item in the balance of payments estimates, net private capital inflow was about £275 million, slightly more than in the two preceding years. In the first half, apparent capital inflow was a good deal less than a year earlier, and net inflow in the March quarter was again quite small. In the June quarter however, apparent net inflow was of the order of £100 million. Although these figures can always be affected by leads and lags in payments for imports and exports and there was some evidence of increased import finance from overseas suppliers in the latter months, they do not show any clear effects of the measures taken by the United Kingdom and United States to improve their own balance of payments.
Capital inflow in 1964/65 covered more than half the current deficit, but net gold and foreign exchange holdings fell over the year by £158 million, to £696 million. Contributing to the fall was a purchase by India of £11 million in Australian currency from the International Monetary Fund, which was converted into sterling. As a result, the drawing facilities available to Australia with the I.M.F. increased by a like amount, to £234 million at June, 1965.
Although Australia's reserves at 30th June were still substantial, the run-down since June, 1964 has shown again how quickly the balance of payments can change. It is always difficult to look ahead, but as we entered 1965/66 the immediate prospects suggested that the decline in reserves would continue. As a result of severe drought over wide areas, the output of wheat, wool and some other products was expected to be lower than in 1964/65, imports seemed likely to continue at high rates, and the prospects for capital inflow were more uncertain.
| End of June | Gold | Dollars | Sterling securities | Sterling and other foreign exchange | Total |
|---|---|---|---|---|---|
| 1961 | 69.2 | 31.0 | 33.0 | 417.6 | 550.8 |
| 1962 | 79.2 | 34.5 | 32.9 | 414.6 | 561.2 |
| 1963 | 89.3 | 55.6 | 32.7 | 448.5 | 626.1 |
| 1964 | 97.3 | 65.9 | 98.2 | 592.7 | 854.1 |
| 1965 | 102.5 | 78.1 | 201.9 | 313.8 | 696.3 |
Financial Conditions
The year 1963/64 had been one of relative financial ease but in 1964/65, largely as a result of the emergence of a substantial deficit in the balance of payments, financial conditions tightened appreciably.
For any individual or group, an excess of expenditure over income has to be financed either by running down financial assets or by borrowing. For the economy as a whole, such an excess must be financed either by running down overseas assets or by borrowing abroad.
For the Australian economy, the net excess of expenditure over income is reflected in the deficit in the balance of payments on current account. In 1963/64 this deficit was only £25 million, and borrowing abroad (net capital inflow) was matched by an almost equivalent increase in international reserves, which were already relatively high as a result of increases in the previous three years. The counterpart of this accumulation of reserves had boosted domestic liquidity, with the result that the economy ended 1963/64 with liquidity at relatively high levels.
In 1964/65 however, the current account deficit in the balance of payments increased sharply to £375 million. This was substantially more than the net capital inflow for the year and financing in the form of borrowing from abroad had to be supplemented by running down international reserves by £158 million. This reduction in reserves operated to diminish the domestic liquidity of the economy as a whole.
It is useful to distinguish the private and public sectors of the economy, which may be in surplus or deficit with each other as well as with the rest of the world. The surplus or deficit of any one of the three groups is matched by the combined deficit or surplus of the other two. In 1963/64 the current account deficit of £25 million in Australia's balance of payments meant that the rest of the world ran a surplus of this order in its transactions with Australia. In the same period public authorities had an excess of expenditure over receipts (a deficit) of about £200 million. On this evidence, the private sector of the economy was in surplus to the extent of about £175 million. In 1964/65 the surplus of the rest of the world rose by £350 million. Public authorities' revenues rose more than their spending on goods and services and their excess of expenditure over receipts fell very substantially. The private sector of the economy ran a deficit well in excess of £200 million. The financial counterpart of this swing in the position of the private sector was that whereas in 1963/64 the sector's financial assets rose by about £175 million more than its liabilities, in 1964/65 its liabilities increased by well over £200 million more than its financial assets.
A substantial deficit in the private sector of the Australian economy is by no means unusual. Over recent years it has in fact been more the normal pattern, reflecting in large part the relatively high level of private capital inflow from abroad, including a substantial proportion of direct financing by overseas parents of their Australian branches and subsidiaries. However, the deficit in 1964/65 was significantly greater than in any recent year except 1960/61 and in distinct contrast to the surplus of 1963/64.
A change of this magnitude and sharpness would have been expected to make for tightening financial conditions during 1964/65. The precise degree of tightening of course varies with the types of liabilities incurred, the types of financial assets depleted and the attitudes of debtors and creditors to these changes. The private sector had entered 1964/65 with a high level of liquid assets. Some of these had to be surrendered for foreign exchange to make payments abroad but capital inflow from overseas reduced this drain while the operations of banks and other financial intermediaries helped to maintain the stock of liquid assets held by the general public. The net result of all these factors was that although financial conditions became tighter and interest rates rose, severe financial stringency did not develop during the year.
Financial intermediaries borrow (issue liabilities) to about the same extent as they lend (acquire financial assets), and so have little effect on the net indebtedness of the general public. They do, however, affect financial conditions because by coming between the final creditor and final debtor they affect the type of asset held by the former and the type of debt incurred by the latter.
The banking system plays an important part in these processes. Its role during 1964/65 is fully reviewed in later sections of this Report. For our present purposes it is relevant to note that the increase in trading bank advances during 1964/65 was £100 million greater than in 1963/64 while the rise in deposits was £67 million less. The increase in savings bank loans was about the same as in 1963/64, but the rise in their deposits was £62 million smaller.
Amongst other important groups of financial intermediaries, contributions to life assurance and pension funds were well maintained and their lending to the private sector expanded, mainly through acquisitions of company securities and mortgage financing. Capital raisings by finance businesses were higher than in 1963/64 and their instalment credit loans outstanding rose strongly but with a slightly lower rate of increase than in the previous year.
New Money Raisings by Listed Companies
QUARTERLY TOTALS
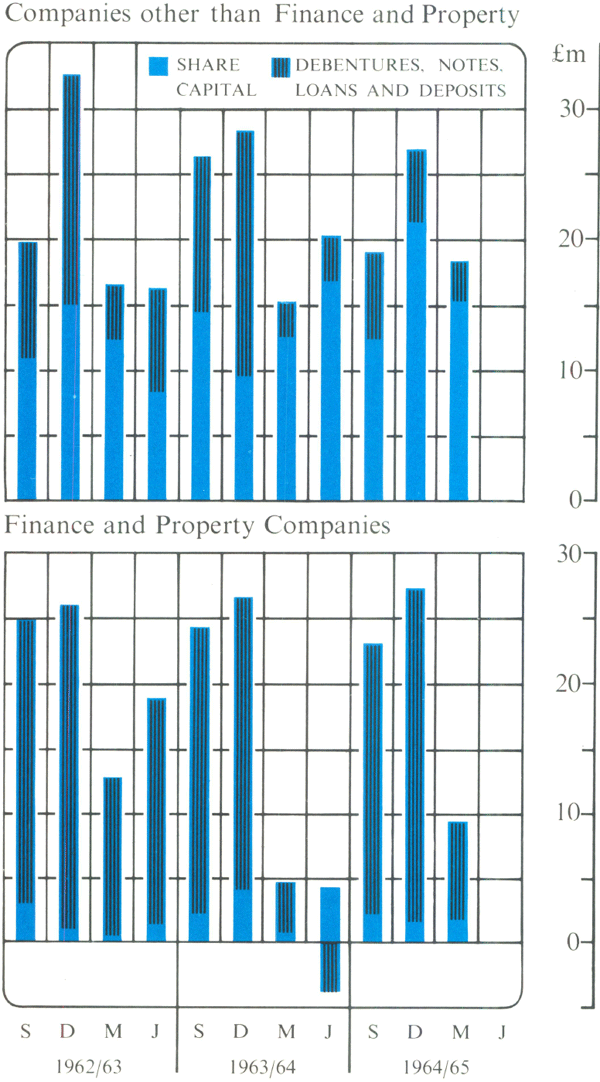
For non-financial groups within the private sector, most forms of borrowing activity expanded, but the pattern was far from uniform. Evidence available to date suggests that the net borrowing (deficit) of non-finance companies will probably prove to have been significantly greater in 1964/65 than in 1963/64, with manufacturing concerns playing a major role. In contrast, net borrowings by commerce groups, which had risen strongly in the previous year, seemed to have fallen off in 1964/65.
Although complete statistics are not available it is clear that compared with 1963/64 there was a big swing in the net indebtedness of the farm sector, with incomes down and investment and other outlays up. During the first half of the year the increase in farmers' net creditor position with the major trading banks (excess of deposits over advances) was some £28 million less than in the corresponding period of 1963/64; the change in the second half of the year was probably in the same direction. The net increase over the year in rural indebtedness to pastoral finance companies was £15 million greater than in 1963/64.
For households and non-farm unincorporated enterprises sufficient information is not yet available to estimate net borrowing/lending positions with any degree of precision. During 1963/64 the net indebtedness of these groups appeared to have declined along with that of other groups generally. (Their income increased more than their expenditure, and so their financial assets rose more than their liabilities.) In 1964/65 the increases in consumer credit and housing debt were much the same as in the previous year, while the increase in savings bank deposits was significantly lower. Overall, however, it seems unlikely that the net indebtedness of these groups increased significantly.
Throughout most of the year company capital raisings on domestic markets continued to be weighted in favour of fixed interest capital but share raisings continued their rise from the relatively low levels of 1962/63.
In the closing months of the year considerable apprehensions developed about the possibility of severe pressures in capital markets as a result of the measures taken by the United Kingdom and United States to deal with their unsatisfactory balance of payments. However, capital inflow was quite well sustained over the year as a whole and although by the end of the year tightness was becoming increasingly evident in capital markets, it was not unduly severe.
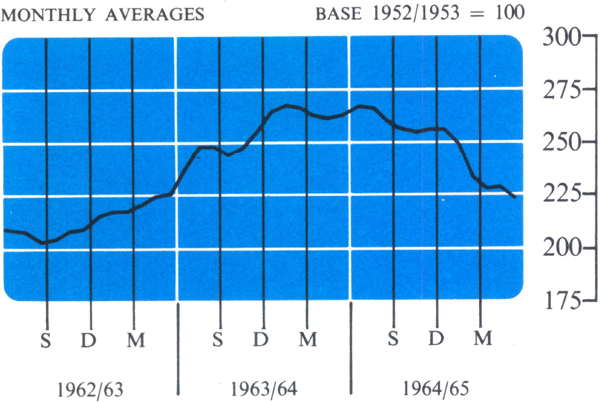
Activity in the share markets, as measured by average turnovers, fell significantly in 1964/65. Share prices showed little net change in the first half but fell sharply in the second; the indexes recorded a net fall of more than 15 per cent over the year.
Sydney Stock Exchange Share Price Index
All Ordinary Shares
Dwelling finance
After increasing strongly the previous year, the flow of housing funds from the main institutions showed a much smaller rise in 1964/65.
Loans approved for new housing by these institutions were approximately the same, both in number and amount, as in 1963/64. Building society lending increased again (including lending by societies not included in the figures shown here), but the rate of loan approvals by savings banks to individuals for new housing declined, particularly towards the end of the year. Loan approvals by the other institutions remained relatively stable in total, although some of the smaller institutions increased their lending significantly. The Commonwealth Government's allocation to the War Service Homes Division was again £35 million; the Division's lending for new housing fell, but its lending for existing housing rose sharply.
The levelling off in lending for new housing by the major institutions might reflect, at least to some extent, a shift in home-seekers' preference from individual houses to flats. In 1964/65 there was a slight fall in the number of private houses commenced, but the number of private dwellings in multi-unit buildings commenced during the year increased by about 50 per cent.
| 1962/63 | 1963/64 | 1964/65 | |
|---|---|---|---|
| Loans approved by major lending institutions* | |||
| Number of loans ('000) | 47.0 | 50.8 | 49.3† |
| Amount of finance (£ million) | 142.6 | 163.7 | 164.0† |
|
* Includes trading banks, savings banks, major life offices, the War Service Homes
Division and certain building/housing societies (including some of those
financed under the Commonwealth and State Housing Agreement). † Preliminary. |
|||
Complete information on the sources of finance for the purchase of flats is not available. Some of the major home financing institutions are now lending directly for this purpose but usually on a fairly small scale. It is clear, however, that just as the proceeds of the sale of existing dwellings are often used to buy or build new houses, they are also often used to buy new flats, so in an indirect way institutional money is finding its way into this type of construction. It is significant in this regard that loan approvals for existing housing by the main institutions, and particularly the savings banks, which had increased strongly in 1963/64, appear to have risen further in 1964/65.
Legislation for the establishment of a Housing Loans Insurance Corporation was enacted during the year. It is expected that the Corporation will commence operations in 1965/66, insuring loans by approved lenders.
Government finance
In view of the expansive factors at work in the economy, financial policies of the Commonwealth Government in 1964/65 were designed to restrain the rise in expenditure and to preserve stability. Accordingly, the Commonwealth's net increase in indebtedness (the excess of total outlay over taxation and other receipts) was significantly smaller than in the previous year.
The Commonwealth budget provided for increases in revenue more than sufficient to cover the large increases in expenditure, leaving a smaller call on borrowings. In the outcome, revenue was more buoyant than expected and the smaller excess of expenditures over receipts more than offset higher redemptions and lower loan raisings. In aggregate there was a net reduction in the use of temporary borrowings and cash balances of £19 million, compared with the corresponding reduction of £28 million in 1963/64. This was represented by a fall of £36 million in Treasury notes outstanding and an increase of £19 million in Treasury bills (excluding a funding of £50 million of Treasury bills held by the Reserve Bank). Cash balances increased slightly.
Expenditures of State governments tended to exceed their budget estimates. Although revenues were also somewhat higher than expected, most States had larger revenue deficits than they had forecast.
In July, 1964 the Loan Council approved a 1964/65 governmental borrowing programme for States' works and housing of £290 million, an increase of £18 million on 1963/64.
As in the previous year, there were four cash loans. In line with the upward trend in market yields which had been evident since the end of March, the yields offered on the August, 1964 issues were up to 6/−d. per cent higher than for the previous May loan. Subscriptions to the August loan amounted to £71 million, of which £3 million was subscribed in 1963/64. Terms were virtually unchanged for the November loan, which raised £50 million. In the February, 1965 loan there was some shortening of the periods to maturity of the short and medium term securities; subscriptions of £39 million were well below the announced target of £60 million. In March, bank interest rates were raised and market yields rose further; the final cash loan for the year in April offered from 5 per cent on three-year securities to 5¼ per cent on 20-year securities. Despite sharply falling liquidity, this loan attracted £46 million. Special Bonds raised a net £27 million over the year, compared with £37 million in 1963/64, higher redemptions accounting for £8 million of the difference.
The Commonwealth obtained £234 million from domestic cash issues and Special Bonds, £47 million less than in 1963/64. Compared with that year, subscriptions to cash loans by brokers and dealers declined markedly, while institutional investors tended to shift their support further towards the longer term series. The $us25 million loan subscribed in Europe and drawings of £11 million on the International Bank loan for the Snowy Mountains Hydro-Electric Scheme added another £22 million; in 1963/64 overseas loans had provided £37 million.
Some £359 million of debt matured in Australia during 1964/65, and with conversions to new issues (including Special Bonds) totalling £253 million, £106 million was redeemed. Additional debt of £52 million was repaid; this excluded temporary borrowings, but included £40 million of overseas debt.
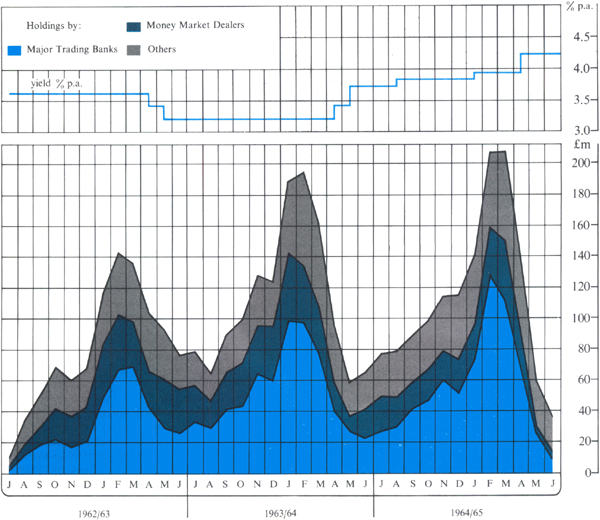
Treasury notes, which are of 91 days' currency, again proved a useful seasonal security. The amount outstanding increased from £76 million at 30th June, 1964, to a peak of £218 million early in March. The increase was gradual in the first half of the year, reflecting the seasonal accumulation of funds for investment. Following a small decline over the Christmas period (to £95 million) the issue of notes increased rapidly during January and February; the seasonal increase in demand (mainly from banks, realising they would need the funds in the June quarter) was augmented by investors seeking to shorten the currency of their security portfolios in the face of developing uncertainties about the future course of interest rates. The strong run-down in liquidity, and the movement to higher rates and yields in the market generally, led to a rapid decline in the amount of Treasury notes on issue, to £40 million at the end of June.
The borrowing programme for the major local and semi-governmental bodies was set by the Loan Council at £127 million for 1964/65, £4 million more than in the previous year. No overall limit was placed on raisings by bodies with programmes of £100,000 or less. In the earlier months of the year progress with the loan raising programme was not as rapid as in the preceding two years but, with steady support from institutional lenders, most borrowers experienced little difficulty in raising their full allocations.
Private loans again accounted for over 90 per cent of funds obtained; new money raised by public issues amounted to £12 million, about £3 million less than in the previous year. Offers made in respect of maturing public loans totalled £45 million and raised £36 million (compared with £34 million and £24 million respectively in 1963/64). New money raisings by the smaller bodies amounted to £27 million, much the same as in the previous year.
Treasury Notes
AVERAGE OF WEEKLY FIGURES
Volume of money
Despite the fall in international reserves the money supply, as defined in Australia, still increased strongly in 1964/65, although less than in the previous year.
The effect of government financial operations was about the same as in 1963/64. A smaller increase in the Commonwealth Government's net indebtedness was matched by a smaller rise in the public's holdings of Commonwealth Government securities including Treasury notes; the net increase in banking system holdings, which adds to the money supply, was little changed from the previous year.
Bank loans and advances increased much more strongly than in 1963/64. The rise in savings bank loans was much the same but the increase in trading bank advances (including term loans) was £100 million greater and loans by the Rural Credits Department of the Reserve Bank rose by £64 million, following a decline of £48 million in the previous year.
With other factors, these changes offset two-thirds of the turn-round of nearly £400 million in international reserves, leaving an increase in the money supply of £390 million, compared with £519 million in 1963/64. Although below the 12 per cent rise in the previous year, the increase in 1964/65 was still 8 per cent.
The extension of fixed deposit facilities in September, 1964 and the increase in interest rates in March, 1965 made fixed deposits more attractive, and they rose over the year by £154 million following an increase of £116 million in 1963/64; in both years the rise was more than 20 per cent. Savings bank deposits showed an increase of £207 million, compared with £269 million in 1963/64, the rate of growth falling away as the year progressed.
The public's note and coin holdings at June, 1965 were the same as a year before. It is interesting to note that over the last three years these holdings have remained virtually unchanged, despite increases in population, incomes and prices.
The smaller increase in the money supply in 1964/65 therefore reflected mainly in the public's current deposits with trading banks, which rose by £30 million; most of this increase was due to a sharp rise in in-transit items, resulting partly from the last Wednesday in June, 1965 falling on the 30th. The previous year current deposits had risen by £135 million.
| 1962 | 1963 | 1964 | 1965 | ||
|---|---|---|---|---|---|
| Notes and coin in hands of public | 405 | 409 | 407 | 407 | |
| Deposits of public with all cheque-paying banks | Current | 1,284 | 1,323 | 1,458 | 1,488 |
| Fixed | 519 | 574 | 690 | 844 | |
| Deposits with all savings banks | 1,714 | 1,953 | 2,222 | 2,429 | |
| Volume of Money | 3,923 | 4,259 | 4,777 | 5,168 |
| 1962/63 | 1963/64 | 1964/65 | ||
|---|---|---|---|---|
| International reserves | +65 | +228 | −158 | |
| Commonwealth Government cash position | −16 | −28 | −19† | |
| Commonwealth Government debt position* | +170 | +230 | +135†§ | |
| Loans and advances | ||||
| All cheque-paying banks | +89 | +73 | +173 | |
| Savings banks | +60 | +108 | +111 | |
| Rural Credits Department | +49 | −48 | +64 | |
| Miscellaneous factors | +29 | +70 | +114‡ | |
| +446 | +633 | +420§ | ||
| Less movement in public's holdings of | ||||
| Treasury notes | +40 | +6 | −18 | |
| Other Commonwealth Government securities | +70 | +108 | +48§ | |
| Volume of Money | +336 | +519 | +390 | |
| of which: | ||||
| Notes and coin in hands of public | +4 | −2 | −1 | |
| Deposits of public with all cheque-paying banks | Current | +39 | +135 | +30 |
| Fixed | +54 | +116 | +154 | |
| Deposits with all savings banks | +239 | +269 | +207 | |
| Commonwealth Government cash position | 1962/63 | 1963/64 | 1964/65 | |
| Treasury bills on issue | −85 | −34 | +19† | |
| Treasury notes on issue | +69 | +7 | −36 | |
| Cash balances (increase—) | −1 | — | −2 | |
| Cash surplus (—) | −16 | −28 | −19† | |
| Holdings of Commonwealth Government securities redeemable in Australia (including Treasury bills and Treasury notes) | ||||
| 1962/63 | 1963/64 | 1964/65§ | ||
| Reserve Bank | −69 | −56 | +65 | |
| All cheque-paying banks | +33 | +64 | −12 | |
| Savings banks | +80 | +83 | +34 | |
| Other non-government holdings | +110 | +114 | +30 | |
| Total | +154 | +204 | +118 | |
|
*Commonwealth Government securities other than Treasury bills and Treasury notes;
excludes holdings by governments. †Excludes effects of funding £50 million Treasury bills held by Reserve Bank. Including this operation, the figures would be −69, +185, −31, −69. ‡The large increase in the movement in this item compared with 1963/64 largely reflects a sharp rise in “in-transits” (cheques and other items credited to bank accounts but not yet debited to other accounts), resulting partly from the last Wednesday in June, 1965 falling on the 30th. In the volume of money components the main effect was to inflate current deposits of cheque-paying banks. §Preliminary. |
||||