Reserve Bank of Australia Annual Report – 1966 Economic and Financial Conditions
The Domestic Economy
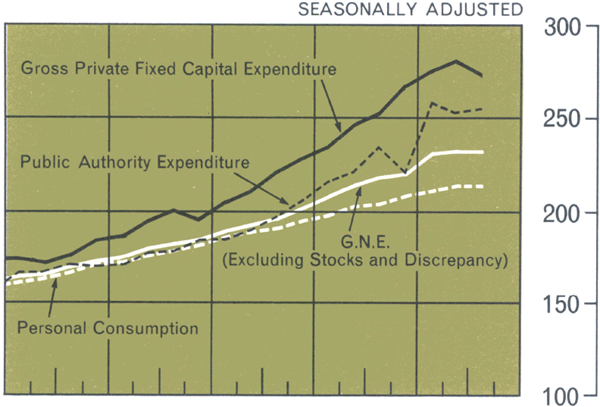
The rate of increase of aggregate expenditure in 1965/66 was lower than in any of the previous three years. Most major components of private expenditure recorded lower rates of increase than in 1964/65. Reflecting mainly reduced personal expenditures on motor vehicles and little change in purchases of household durables, the increase in personal consumption expenditure was the smallest since 1961/62. Private fixed capital expenditure was again buoyant overall, despite a drop in rural investment, but the rate of increase receded from the very high 1964/65 level to about the rate achieved in 1962/63 and 1963/64. Expenditures on plant and equipment and non-dwelling construction rose strongly during the first half of the year but subsequently showed signs of an easing. Expenditure on dwellings was lower than in 1964/65. In the public sector, however, aggregate outlays continued to increase strongly at close to the 1964/65 rate.
In the economic setting of early 1965/66, some moderation of the rate of growth of aggregate expenditure had been desirable to avoid undue strain on resources. A rapid rate of growth of expenditure had been achieved in the recovery phase immediately following the recession of the early 1960's but, by the end of 1964/65, it had become clear that this could not continue without imposing severe strains on the domestic economy and on the balance of payments. Unemployment had reached relatively low levels, limiting the scope for maintaining the rate of expansion of employment. This, in conjunction with a prospective reduction in farm output as a result of drought, made it most unlikely that a rise in national output as large as in 1964/65 would be practicable. Furthermore, although external reserves were still historically high, the need to exercise reasonable prudence in the use of these reserves counselled against continued acceptance of a rising recourse to imports to supplement local supplies on the scale that had occurred in 1964/65.
Registered Unemployed Applicants
and Vacancies

In the event, the volume of rural production fell by about 10 per cent to its lowest level for four years. Wool production was down by about 8 per cent to 1,640 million lb. and the wheat harvest was reduced from 369 million bushels to 258 million bushels. These sharp reverses were brought about by severe drought conditions in pastoral regions of New South Wales and Queensland and in the cereal areas of New South Wales which also affected livestock slaughterings and output of other crops.
Components of Expenditure
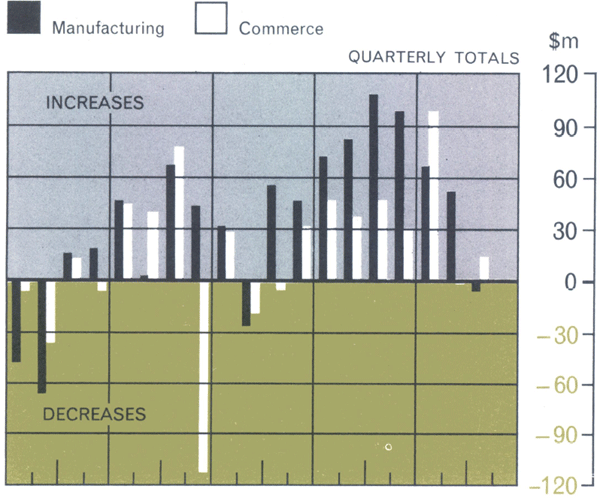
Changes in Non-Farm Stocks
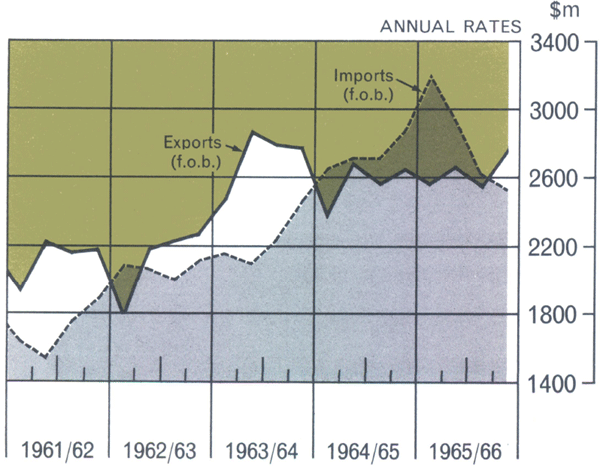
Exports and Imports
Losses of livestock in the drought have not yet been accurately assessed. Information on cattle numbers is particularly imprecise but it is estimated that sheep numbers which, in the preceding two years, had been increasing at a rate of about 6 million per annum, fell by over 13 million during 1965/66 as a result of drought deaths and reduced natural increase. Wool production from surviving sheep was also markedly reduced. Serious enough in themselves, the effects of these losses on wool production will continue for some time. It will be some years before flock compositions and numbers in drought-affected areas recover to pre-drought levels. Meat production will also be affected to the extent that producers reduce their rates of slaughtering in an endeavour to build up livestock numbers. Crop production should however quickly recover, given a return to favourable seasonal conditions.
These reductions in rural output cut heavily into exports in 1965/66. Although wool prices were on average about 5 per cent higher than in 1964/65, the value of wool exports was down by about 2 per cent. Wheat was even harder hit and it was only by drawing heavily on carryover stocks from 1964/65 that the drop in the value of wheat and flour exports was contained at about 13 per cent. Exports of dairy produce, barley, oats and sugar were also lower than in 1964/65. However, exports of metals, particularly copper, and metal manufactures, minerals and ores rose sharply, and total exports for the year exceeded the 1964/65 total by about 2 per cent.
Imports continued to rise strongly during the early months of the year but subsequently levelled out and, at the close of the year, were falling. The total for the year, at $2,831 million, represented an increase of about 3 per cent on 1964/65; this was considerably less than the increase of over 20 per cent that had occurred in that year. The 1965/66 increase was reflected mainly in imports of capital equipment, together with a substantial quantity of defence equipment. Imports of producers' materials and finished consumer goods were both slightly lower than in 1964/65, having followed a downward trend for most of the year.
With the main impact of the reduction in rural output falling on stocks and exports, the increase in domestic supplies over the year as a whole was reasonably closely aligned with the rise in national expenditure. Additions to non-farm stocks were, however, more modest than in 1964/65 and this, in conjunction with some further increases in imports, gave rise to a significant easing of pressures on non-rural productive resources during the course of the year.
This easing was particularly noticeable in labour markets. The rise in civilian employment over the year, at slightly less than 3 per cent, was smaller than in 1964/65. Persons registered for employment with the Commonwealth Employment Service rose by 16,875, taking the total of registrations back to its early 1964 level. At the same time, registered unfilled vacancies fell by about 11,668 and net hours of overtime worked were reduced by about 15 per cent. Slackening in the demand for labour was most pronounced in New South Wales, Victoria and South Australia. In Western Australia and Tasmania, on the other hand, some tightening in labour markets was evident.
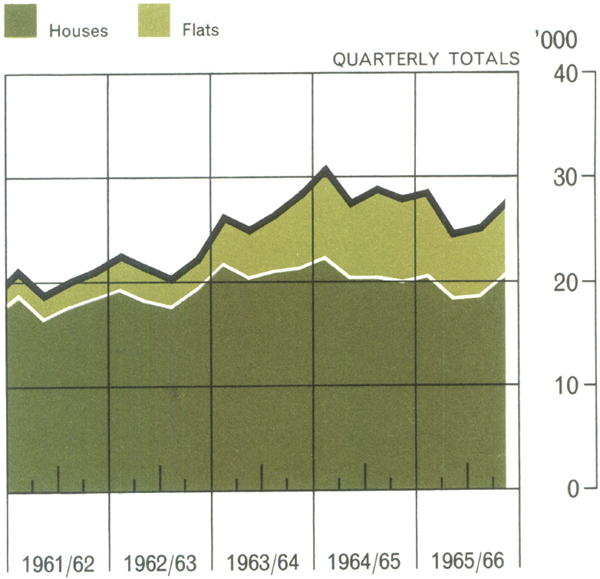
Dwelling Commencements
Non-farm stocks continued to increase strongly during the first half of the year at about the same rate as in 1964/65 but the upward trend was subsequently checked and the increase for the year as a whole was significantly less than in 1964/65. Most of the increase reflected in the manufacturing sector but commerce stocks also showed a further rise. Production falls were recorded during the first half of the year in a number of categories of industrial goods, including particularly motor vehicles, durable consumer goods and textiles. These falls did not continue during the second half of the year. In this setting, however, slackening rates of increase in domestic expenditures helped to permit an increase in exports of manufactures over a wide range of goods.
Motor Vehicle Registrations
Prices and costs generally rose less than in 1964/65. Despite further increases in indirect taxes and governmental charges, the rise in the consumer price index during the year was only about 3 per cent, compared with the rise of 4 per cent during 1964/65. Increases in average earnings were also smaller. Over the closing months of the year, union claims for substantial increases in awards were being argued before the Commonwealth Conciliation and Arbitration Commission. Early in July, 1966, an increase of $2 in the basic wage was announced, to operate until 31st December, 1966; decisions in respect of associated claims for increased margins for skill were mainly deferred to permit further investigation and consideration.
During the course of the year some apprehensions had arisen concerning the emergence of soft spots in the general pattern of domestic activity and the possibility that more widespread areas of weakness might develop. In this, a good deal of attention was focussed on trends in dwelling construction and motor vehicle registrations.
In 1964/65, rising activity in construction of flats had offset some decline in housing commencements but flat commencements subsequently fell off sharply and this, coupled with a continuing fall in house commencements, produced quite a substantial decline in total dwelling commencements during the first half of 1965/66. Following policy action to increase the availability of funds for housing, this downward trend was checked. Commencements for the year as a whole reached 107,000, slightly less than in 1963/64 and some 10,000 less than in 1964/65.
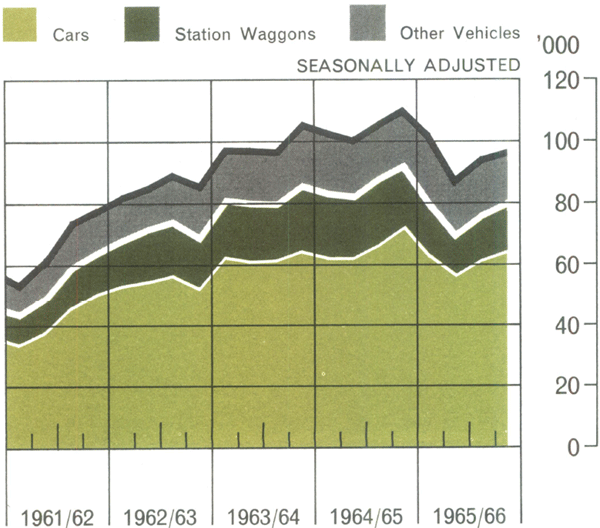
Motor vehicle registrations also fell off quite sharply during the first half of the year but, with the advent of new models, later showed some recovery to finish the year some 9 per cent down on 1964/65.
As we entered 1966/67, the domestic economy was still poised in a position of approximate balance. The 1965/66 pattern of rapidly-rising public expenditures and modest growth in aggregate private expenditure seemed likely to continue, possibly with some further significant changes in the composition of private expenditure. Consumption expenditures could well show a somewhat faster rise. However, there were some indications that the boom in private capital expenditure on non-dwelling construction and plant and equipment, which had contributed so substantially to the increase in aggregate expenditure over the past two years, might at last be tapering off. On the other hand, with non-farm stocks appearing to be moving closer to normal levels during the second half of 1965/66, stock accumulation could, during 1966/67, again emerge as a factor making a positive call on resources.
FINANCIAL CONDITIONS
At the beginning of 1965/66 indications were that financial conditions were likely to continue to tighten as the year developed. Externally, a further substantial fall in international reserves seemed in prospect. Interest rates were at quite high levels, the banks were exercising restraint in their lending and the Commonwealth Government had budgeted for an excess of expenditures over receipts to be met from borrowings smaller than in 1964/65.
In the event, increased financial stringency did not develop and, seasonal fluctuations apart, financial conditions did not show any marked change over the year. Although the current account deficit in the balance of payments increased by about $50 million, capital inflow rose by about $400 million, with the result that there was no net drain on domestic liquidity from the balance of payments. Conditions were further relieved by an excess of public authority expenditures over receipts to be met from borrowings more than $200 million greater than in 1964/65.
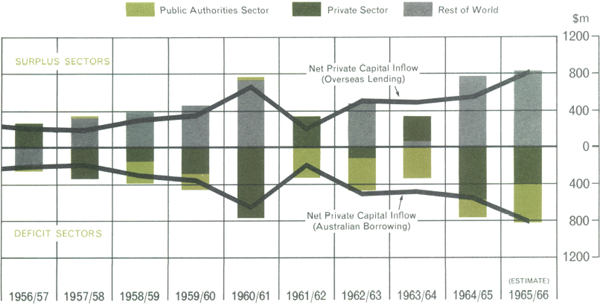
Viewed on a sector basis the situation was that, although the private sector spent in excess of its income to the extent of around $400 million, the financing of this deficit did not occasion any real discomfort in domestic financial markets because of the very high level of finance provided from abroad. In this setting, the public authority sector's financing problems also proved less burdensome than had been expected. Loan raisings by the Commonwealth Government exceeded by a comfortable margin the tentative estimates put forward in conjunction with the Budget presentation. However, local and semi-governmental authorities found loan funds less-readily available than in recent years and, in some cases, experienced difficulty in completing their borrowing programmes.
Inter-Sector Financing
At times during the year there were indications that market participants were anticipating reductions in interest rates. However, these expectations receded following the announcement of United Kingdom moves to restrict the flow of capital to the developed countries of the sterling area and to encourage British firms operating in these countries to greater recourse to local markets to provide the funds for their expansion programmes. At the close of the year, uncertainties in regard to the likely impact of these developments, along with evidence of increasing tightness in international financial markets generally, continued to cloud assessments of prospects for private capital inflow and domestic capital market conditions in the year ahead.
International Payments
Despite a moderation of the sharply-rising trend in imports, the Australian balance of payments showed a larger current account deficit in 1965/66. However, with unprecedented buoyancy in private capital inflow and relatively sharp turn rounds in capital transactions on account of governments and marketing authorities, international reserves recorded a small rise over the year as a whole, compared with a loss of over $300 million in 1964/65.
Wool prices rose but so did import prices and the terms of trade showed little net change following the deterioration that had occurred in 1964/65. The volume of rural exports was cut by drought but exports of minerals, ores and metal manufactures increased sharply and total exports were well sustained in value, actually exceeding the 1964/65 total by some $62 million.
Imports for the year totalled $2,831 million, about $77 million greater than in 1964/65. Also contributing to the rise in the current account deficit were increases in transportation charges and international aid payments.
The current account deficit showed a rise from $769 million in 1964/65 to $818 million in 1965/66. However, this deterioration was accompanied by a rise of about $400 million in net capital inflow, which reached the record total of $879 million. On official capital account there was a swing from an outflow of $39 million to an inflow of $14 million, reflecting in large part leads and lags between arrivals of defence equipment and the payments relating thereto. Official loan transactions overseas resulted in a net outflow of $25 million.
Capital Inflow
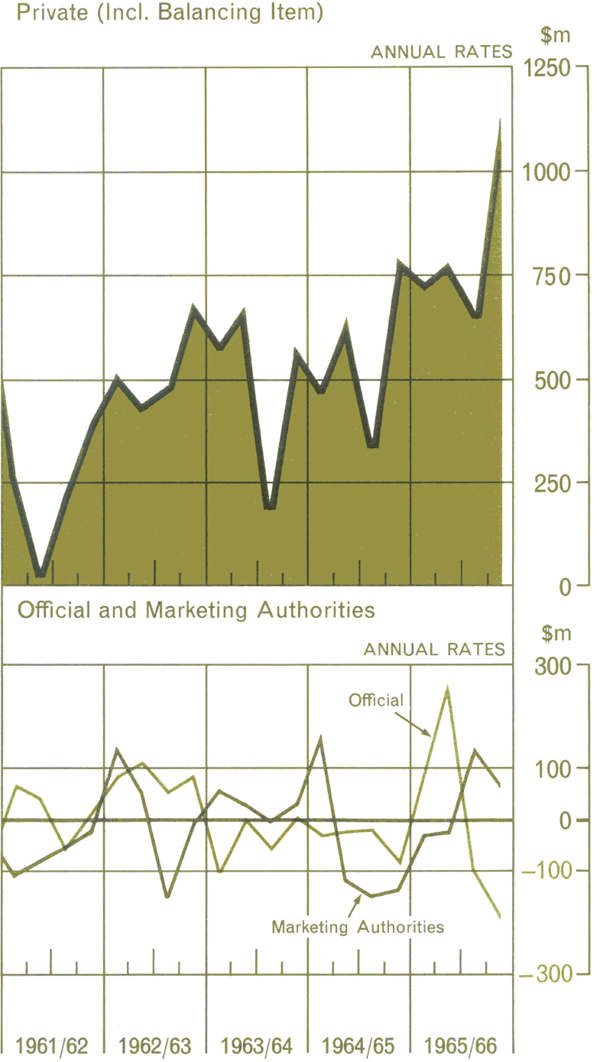
A turnround of about $98 million occurred in capital transactions on account of marketing authorities, mainly reflecting increased receipts in respect of wheat exported to China.
Perhaps the most spectacular development of 1965/66, however, was the performance of private capital inflow. In each of the preceding three years net private capital inflow, including retained earnings and the balancing item, had been around $500 million. Some apprehensions about the maintenance of this rate of inflow had developed early in 1965 as a result of measures taken by the United States and the United Kingdom to improve their international payments. However, following a relatively sharp lift late in 1964/65, the inflow continued at a higher level during the first three quarters of 1965/66. It rose even higher during the June quarter of 1966 but, as the year closed, was showing some signs of slackening. Over the year as a whole the inflow totalled $827 million, over $250 million greater than in 1964/65. In part this increase reflected the overseas financing component of major developmental projects in mining and mineral fields, including a substantial proportion of fixed interest finance, as well as equity investment. An accelerated inflow from the United Kingdom, embracing direct and portfolio investment, contributed substantially to the marked rise in the rate of inflow over the closing months of the year.
In aggregate, capital inflow more than covered the current account deficit and net gold and foreign exchange holdings increased by $21 million over the year. Contributing to this result were drawings against International Monetary Fund sales of Australian currency aggregating $18 million, and a $22 million gold payment to the International Monetary Fund in respect of an increase in the Australian quota. As a consequence of these transactions, and of a further Australian currency lodgement of $67 million with the International Monetary Fund associated with the quota increase, the drawing facilities available to Australia at the International Monetary Fund rose by $129 million to $598 million at June, 1966.
Net Gold and Foreign Exchange Holdings
|
QUOTA AT I.M.F. |
I.M.F. HOLDINGS OF AUST. CURRENCY |
RESERVE POSITION AT I.M.F. |
GROSS POSITION AT I.M.F. |
|
|---|---|---|---|---|
| (1) | (2) | (3)=(1)−(2) | (4)=(1)+(3) | |
| June, 1965 | 357 | 245 | 112 | 469 |
| June, 1966 | 446 | 294 | 152 | 598 |
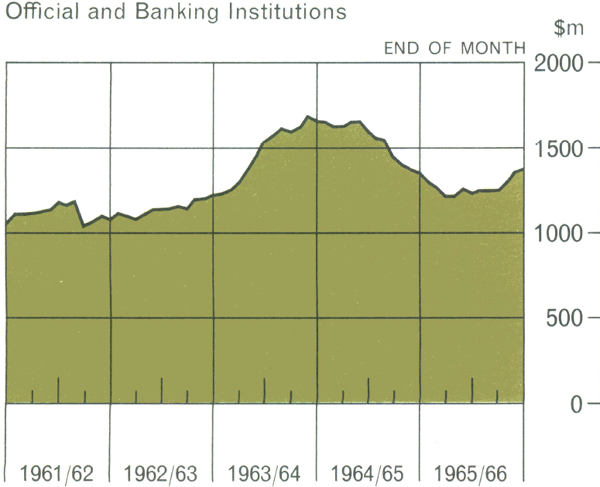
At the close of the year Australia's international reserves were still at a relatively high level and backed by increased second-line reserves in the form of drawing rights at the International Monetary Fund. Although reserves had fallen by $115 million during the first half of the year, in the second half, with the rapid rise in imports checked and private capital inflow running at record rates, a rise of $136 million was recorded, lifting total reserves to $1,375 million, $21 million above their June, 1965, level.
| END OF JUNE | GOLD | DOLLARS | STERLING SECURITIES |
STERLING AND OTHER FOREIGN EXCHANGE |
TOTAL |
|---|---|---|---|---|---|
| 1962 | 158 | 69 | 66 | 804 r | 1,097 r |
| 1963 | 179 | 111 | 65 | 870 r | 1,225 r |
| 1964 | 195 | 132 | 196 | 1,149 r | 1,672 r |
| 1965 | 205 | 156 | 404 | 589 r | 1,354 r |
| 1966 | 198 | 197 | 294 | 686 | 1,375 |
| r: revised | |||||
Although recent developments in the main industrial economies of the world evidence a trend towards higher interest rates and increasing tightness in national and international capital markets, Australia offers attractive opportunities for international investment. The extraordinarily high rates of inflow experienced over the latter months of 1965/66 seem unlikely to endure but we should be able to count with some confidence on continuing to attract a reasonably high volume of funds from abroad.
Over the next few years minerals and ores seem certain to give a strong stimulus to Australian exports so that, despite some uncertainties in regard to the impact of drought on rural production, our overall export prospects must also be counted as quite bright. Nevertheless, the Australian balance of payments seems likely to continue in substantial current account deficit for some time to come and reliance on a high rate of inflow of capital to help finance this deficit leaves us vulnerable to changes in the international financial climate.
Public Finance
The 1965/66 Commonwealth Budget made provision for greatly enlarged expenditure on defence, a substantial increase in payments to State Governments and continued growth in other major items such as social welfare payments and international aid. In total, these commitments constituted a formidable prospective addition to overall demand at a time when domestic resources were already coming under pressure and some moderation of the rising trend in imports was desirable. It was recognised that factors such as the fall in farm incomes as a result of drought would have a steadying effect on demand. Nevertheless, it was judged that there was sufficient impetus in the economy to keep resources fully employed without any strong stimulus from increased governmental expenditure. The Budget was accordingly framed to include an increase of 2½ per cent in personal income tax and increases in customs and excise duties and certain other charges.
Reflecting reduced rates of increase of private sector incomes and expenditures, Commonwealth taxation receipts fell short of Budget estimates. This, allied with some further increase in expenditure over and above the original Budget estimates, contributed to an excess of expenditures over receipts to be met from borrowings of the Commonwealth in 1965/66 of $251 million, compared with the Budget estimate of $111 million and the 1964/65 result of $157 million.
In domestic loan raisings the Commonwealth obtained $547 million from four cash issues and subscriptions to Special Bonds, in total $45 million more than in 1964/65. These domestic raisings were supplemented by a $US25 million ($A22 million) loan subscribed from European sources, and a further $15 million was drawn on the International Bank for Reconstruction and Development loan for the Snowy Mountains Hydro-Electric Scheme. Redemptions and other retirements of debt amounted to $332 million, including $77 million in respect of overseas debt, leaving net loan raisings of $252 million, which was slightly more than the excess of expenditures over receipts of $251 million. In temporary borrowings, an increase of nearly $36 million in Treasury notes on issue was almost exactly offset by a decrease in Treasury bill oustandings; cash balances showed a small rise.
Despite the better-than-expected loan raising experience, total borrowings available for the financing of States' works and housing programmes were still well short of the amount required. The original programme approved by the Loan Council in June, 1965, provided for a total of $590 million, an increase of $10 million on the previous year. This was lifted a further $15 million in March, 1966, when a supplementary allocation was made to the States for housing. States' domestic loan raisings provided $6 million towards the total programme. After charging to Loan Fund $90 million for defence and $132 million for debt redemption, the amount available in the Loan Fund was $169 million short of the $599 million required to meet the States' programmes and a special loan was subscribed by the Commonwealth to bridge this gap. In 1964/65 a similar special loan of $134 million had been required.
Most of the States had budgeted for revenue deficits in 1965/66. However, with their finances subject to influences similar to those which affected Commonwealth tax revenues, most States finished the year with much larger revenue deficits than they had expected. New South Wales and Queensland were particularly heavily hit by the impact of drought and the Commonwealth agreed, in effect, to underwrite these States' expenditures on drought relief, including loans for restocking purposes. Nevertheless, the Consolidated Revenue Funds for all States together reflected an aggregate deficit significantly greater than in 1964/65.
In local and semi-governmental financing, new money loan raisings were, in aggregate, about the same as in 1964/65. The Loan Council had authorised a borrowing programme of $250 million for the major local and semi-governmental bodies in 1965/66; their actual raisings were $247 million, some $8 million less than in the previous year. No overall limit was placed on raisings of bodies with programmes of $200,000 or less and these bodies raised about $10 million more than in 1964/65.
For all public authorities, the excess of expenditures over receipts proved to be substantially greater than seemed likely at the beginning of the year and appears to have been over $200 million greater than in 1964/65. Largely as a result of a procedural change in the timing of Commonwealth payments to the States and lags in taxation revenue, the seasonal swing in public authority financing was somewhat more pronounced than in other recent years.
New Capital Raisings in Australia
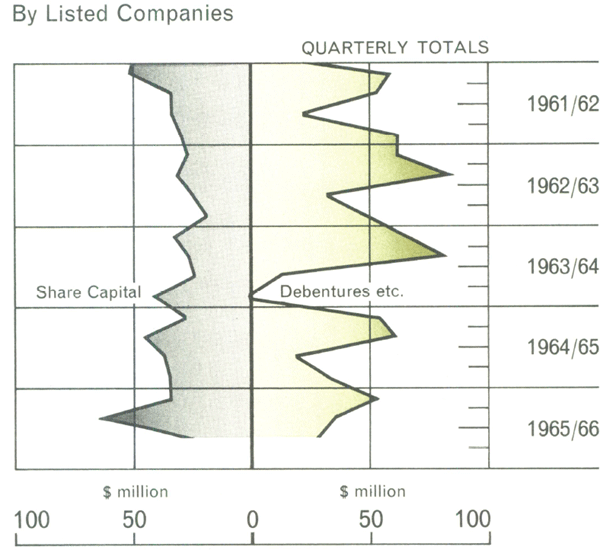
Private Finance
The private sector was again in substantial deficit in 1965/66. In 1964/65, the current account deficit in the balance of payments (rest of world surplus) of $769 million had its counterpart in a public authority deficit of $203 million and a private sector deficit of $566 million. In 1965/66, the increase in the rest of world surplus of about $50 million was accompanied by a rise of over $200 million in the public authority deficit and the private sector deficit was reduced by over $150 million to about $400 million.
A substantial financial deficit in the private sector of the Australian economy is by no means unusual, reflecting as it does a substantial amount of direct financing by overseas parents of their Australian branches and subsidiaries. 1965/66 was certainly no exception in this regard. Although the private sector deficit was some $150 million less than in 1964/65, net private finance provided from abroad (excluding the inflow on account of marketing authorities) rose by some $250 million, moderating to a very substantial degree the impact of the sector deficit in domestic financial markets. With the more pronounced seasonal swing in public authority transactions contributing to financial ease over the first three-quarters of the year, domestic financial conditions were distinctly easy during the seasonal flush. The seasonal rundown in liquidity over the closing months of the year was cushioned by rising international reserves. Many groups had substantial liquid asset holdings on which to draw and, with bank liquidity being supported, the rundown did not occasion any great discomfort.
Within the private sector, experience over the year as a whole varied a good deal between various groups. With severe drought in New South Wales and Queensland, farm incomes fell by about $300 million and, although investment outlays were reduced, the available evidence suggests that rural sector indebtedness increased significantly over the year.
In the corporate field, although profits of non-finance companies generally were less buoyant than in 1964/65, expenditure on plant and equipment showed some very substantial increases, particularly in mining, extracting, refining and founding and chemical industry groups. To a considerable extent, expenditures in these fields appear to have been financed from capital from abroad. Domestic capital issues by non-finance companies in the nine months to March, 1966, were about $45 million greater than in the corresponding period of 1964/65, but their net drawings on the banking system over the year as a whole did not appear to have been significantly greater than in 1964/65.
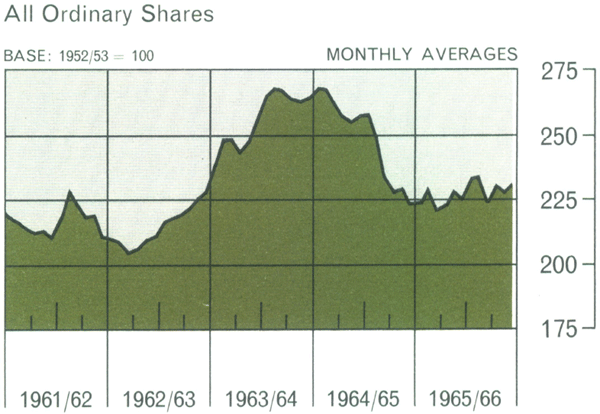
Sydney Stock Exchange/Share Price Index
There was little change in interest rates in the main domestic private capital markets over 1965/66. Upward pressure on rates offered by finance companies continued into the first month or two of the financial year but thereafter, apart from adjustments by individual companies to bring their rates into line, the general pattern did not change significantly. New money fixed interest raisings by finance companies were lower than in 1964/65 and issues by industrial companies were accorded greater prominence. These industrial issues generally offered rates within a range of 7/7¾ per cent per annum for maturities of 5 to 20 years.
In domestic share markets during the first half of 1965/66 prices generally fluctuated around the average level over the closing months of 1964/65. A strengthening of prices around the end of 1965 soon lost impetus but, from March, 1966, further price rises were stimulated by new oil and natural gas discoveries, widening interest in mining stocks and increased overseas portfolio investment, particularly by United Kingdom investors. Over the year as a whole share prices showed a net rise of about 8 per cent.
With presently available statistics it is not possible to make any firm judgements about changes in the overall financial positions of households and non-farm unincorporated enterprises. It is clear that the rise in personal deposits with savings banks over the year was less than in 1964/65 but net contributions to life insurance and superannuation funds appear to have continued to increase strongly. Indebtedness of persons in respect of instalment credit and housing borrowings almost certainly increased less than in 1964/65.
Throughout most of 1965/66 instalment credit finance extended for the purchase of motor vehicles and personal and household goods was lower than in 1964/65 and, with repayments continuing to rise, total instalment credit outstandings of non-retail financiers increased by only 2 per cent over the year, well below the increase of 12 per cent recorded in 1964/65.
Housing loan approvals by savings banks, which normally account for something approaching half of total institutional housing lending, rose by $26 million. Most of this increase occurred in the second half of the year in response to the Reserve Bank's request for a higher level of housing lending. However, with repayments of existing loans continuing to rise strongly, and with, as usual, a lag in drawings against loan approvals, the increase in savings bank housing loans outstanding was actually $14 million less than in 1964/65. The outstandings of other groups of housing lenders seem unlikely to have risen sufficiently to compensate for this.
Aggregate finance approvals for new housing by the major institutional lenders rose by about 1 per cent and the number of loans approved showed little change. Savings bank lending for new housing showed a significant rise but some other groups showed decreases.
| 1963/64 | 1964/65 | 1965/66 | |
|---|---|---|---|
| LOANS APPROVED BY MAJOR LENDING INSTITUTIONS* | |||
| Number of loans (′000) | 50.8 | 49.3 | 49 † |
| Amount of finance ($m) | 327.3 | 327.6 | 330 † |
| * Includes trading banks, savings banks, major life offices, the War Service
Homes Division and certain building/housing societies (including some of
those receiving finance under the Commonwealth and State Housing Agreement). †Preliminary. |
|||
| 1963/64 | 1964/65 | 1965/66 | ||
|---|---|---|---|---|
| International reserves | +447 | − 318 | +21 | |
| Commonwealth Government cash position | − 55 | − 38† | 1 | |
| Commonwealth Government debt position* | +461 | +274† | +300§ | |
| Loans and advances | ||||
| All cheque-paying banks | +145 | +345 | +228 | |
| Savings banks — local and semi-governmental securities | +119 | +137 | +106 | |
| — other | +216 | +221 | +213 | |
| Rural Credits Department | −96 | +128 | 69 | |
| Miscellaneous factors | +28 | +93 | −12 | |
| +1,265 | +842 | +786§ | ||
| Less movements in public's holdings of | ||||
| Treasury notes | +12 | −40 | 6 | |
| Other Commonwealth Government securities | +215 | +101 | +190§ | |
| Net change in holdings | +1,038 | +781 | +602 | |
| of which: | ||||
| Notes and coin in hands of public | −3 | −1 | −30 | |
| Deposits of public with all cheque-paying banks | Current | +271 | +60 | +56 |
| Fixed | +233 | +308 | +211 | |
| Deposits with all savings banks | +538 | +414 | +365 | |
|
*Commonwealth Government securities other than Treasury bills and Treasury notes;
excludes holdings by Governments. †Excludes effects of funding $100 million Treasury bills held by Reserve Bank. Including this operation, the figures would be −138 and +374. §Preliminary. |
||||
Financial Intermediaries
In the financing of transactions of the private sector, financial intermediaries play an important role. Although some borrowing and lending transactions take place directly between the groups ultimately involved, the great bulk are effected through financial intermediaries. In the process, the forms of assets held by final creditors and the forms of liabilities owed by final debtors undergo changes which can, in turn, have important influences on expenditure patterns.
In part these influences derive from changes in the volume and pattern of existing liabilities and in the ability and willingness of borrowers to increase debt commitments of particular types. Recent years have seen strong increases in private sector indebtedness to various groups such as banks, life offices, instalment credit companies, pastoral finance companies and building societies. With a continuing high level of private capital inflow from abroad, private sector indebtedness overseas has also risen strongly.
In 1965/66 the rate of increase of the private non-finance sector's indebtedness to domestic financial institutions appears to have been slower than in 1964/65. Private sector lending by insurance and pension funds and by building societies appeared to be comparatively well sustained and the increase in savings bank advances was only slightly less than in 1964/65. However advances of trading banks and of finance companies recorded distinctly smaller increases. On the other hand, the increase in private sector indebtedness overseas was clearly greater than in 1964/65.
Private expenditure patterns can also be influenced by fluctuations in the volume and composition of financial asset holdings. The liabilities of financial intermediaries make up an important component of the aggregate financial asset holdings of the community. However, these assets encompass a wide range of liquidity attributes and particular significance within the range attaches to notes and coin and bank deposits. Over 1965/66, the net outcome of the various factors affecting the community's holdings of these assets (see Table on page 14) was to produce a rise of about 6 per cent, the smallest percentage increase since 1960/61.
In marked contrast to the experience of 1964/65, the impact of the balance of payments on the level of the community's holdings of cash and bank deposits was minor. The effect of this change was, however, more than offset by substantially smaller increases in cheque-paying bank loans and advances and sharp turn rounds in Rural Credits Department advances and miscellaneous factors. The net contribution from Government cash and debt operations was also smaller. As a result, the overall increase in holdings in 1965/66 was $179 million less than in 1964/65.
Notes and coin in the hands of the public actually fell by $30 million in 1965/66, after having remained virtually unchanged for about five years. The fall occurred during the period of preparation for the changeover to decimal currency.
Trading bank and savings bank deposits both increased less than in 1964/65, movements in trading bank current deposits being affected by fluctuations in intransit items. Although the increase in trading bank fixed deposits was, in absolute terms, only about two-thirds of the 1964/65 increase, this represented a percentage increase of 12 per cent, following on rises of more than 20 per cent in each of the previous two years.
For some years now, a notable feature of the growth of trading bank deposits has been the rise in the proportion of fixed to total deposits. From a low point of about 16 per cent in the early 1950's, the proportion of fixed to total deposits rose steadily to a little over 20 per cent at the end of the 1950's. Following the sharp increase in fixed deposit rates in November, 1960, the upward movement gained impetus and, by June, 1966, the ratio had reached 40 per cent. This was, of course, still well below the pre-World War II level, when the normal pattern was for fixed deposits to account for more than 50 per cent of total deposits. Nevertheless, it represented a very significant change from the pattern of the early post-war years.
Amongst major groups of non-bank financial intermediaries, increases in their liabilities to the public followed a course somewhat similar to that of banks and were generally less than in 1964/65. However, life and pension funds and deposits with building societies continued to increase at a rate in excess of 10 per cent per annum and, in 1965/66, this was considerably higher than that achieved by other groups as a whole.