Reserve Bank of Australia Annual Report – 1978 Financial Markets and Intermediation
Financial Markets
Financial flows in Australia in 1977/78 were again heavily affected by the public sector's need for funds. In the decade to 1973/74 the consolidated public sector deficit — Commonwealth and state governments and instrumentalities and local and semi-government authorities — averaged around $0.7 billion per annum. After four years of large increases, the public sector deficit was about $5.5 billion in 1977/78.
Broadly, the counterpart to the increased deficit of the public sector has been a rise in the proportion of income saved by persons and unincorporated enterprises. In 1977/78, the household saving ratio dropped back somewhat towards the levels of earlier years, but the level of net lending by the household sector was probably little changed. The increased public sector deficit seems to have been offset by a reduced deficit for the corporate sector, and a greater contribution from abroad.
In 1977/78, domestic borrowing by the Commonwealth was $1.5 billion, compared with $2.3 billion in 1976/77. About $0.8 billion was raised in 1977/78 through the placement of conventional government securities, and $0.4 billion through issues of Australian Savings Bonds. The private non-bank sector's net take-up of government securities of almost $1.3 billion was a little larger than in 1976/77. The banking sector's holdings of government debt were little changed, after declining in 1976/77. Residual financing from the Reserve Bank approached $0.3 billion, about one-sixth as much as in 1976/77.
The outflow of funds from the government to the private sector during the first nine months of 1977/78 was larger than in the same period of 1976/77, despite quarterly instalments of company tax in both November and February which had not been in place in the previous financial year. However, a major drain on primary liquidity was the private sector's balance of payments deficit which, in the nine months to March, totalled around $1.2 billion, against a roughly balanced position over the same months of 1976/77.
5 Government Finance
(not seasonally adjusted)
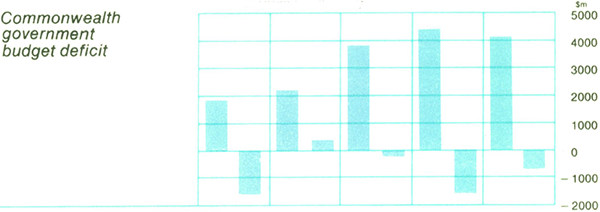


The Reserve Bank was a net contributor to private sector liquidity through the seasonal upswing in 1977/78, with SRD releases an important element; this contrasted with 1976/77 when, during the corresponding period, by running down its holdings of commercial bills and making calls to SRD accounts, the Bank withdrew a substantial amount of funds from the private sector.
Despite the different outcome of the operations of the Reserve Bank the seasonal run-up, on a monthly average basis, of $2.8 billion in private sector LGS was nearly 30 per cent less in 1977/78 than in the previous financial year. With private non-bank holdings of government securities rising more than in the corresponding period of 1976/77, the run-up in the liquidity of the banking system was quite circumscribed. A strong rise in aggregate advances in the first nine months of 1977/78 also contributed to pressure on bank liquidity ratios.
The seasonal run-down in private sector LGS in the June quarter of 1978 was a good deal less than in the same three months of 1977. The June quarter this year saw private sector foreign exchange transactions, as in the June quarter last year, close to balance. But net budget transactions withdrew a smaller volume of funds from the private sector in the June quarter this year, and there was also a more substantial programme of SRD releases. Stresses on the banking system were lessened to the extent that, in the final three months of 1977/78, the net rise in the holdings of government securities of the rest of the private sector was much smaller than in the closing months of 1976/77. Nevertheless, there was the potential for some sharp cash shortages at times. Private sector holdings of Treasury notes peaked at about $1 billion, compared with almost $3 billion in 1976/77. Holdings of very short bonds at the seasonal peak in 1977/78 were also less than at the corresponding time in 1976/77. The more modest final quarter run-down left the increase in private sector LGS in 1977/78 as a whole at nearly $1.8 billion, somewhat larger than in 1976/77.
6 Interest Rates
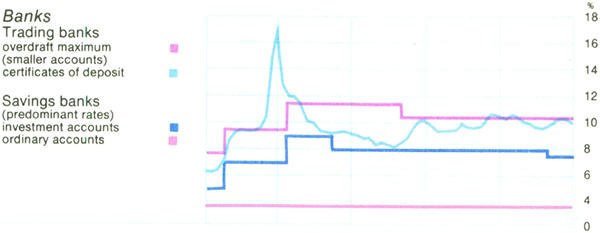
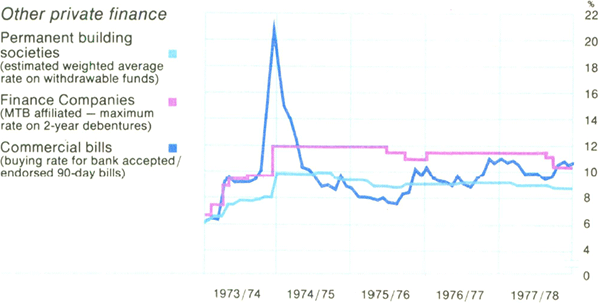
There was something of a twist in interest rates in financial markets during 1977/78. Against a background of lower inflation, and with some encouragement from the Government, long-term interest rates came down during the year. Yields on the longest-dated government securities fell from 10.5 per cent in June 1977 to 9.1 per cent in June 1978. Yields on medium-dated securities fell by almost as much, while yields on twelve month government paper fell from 9.6 per cent to 8.6 per cent. These falls in yields on Commonwealth paper were paralleled in yields offered in local and semi-government raisings. Yields on private fixed interest five year issues fell by over 1 percentage point. Yields on shares fell by about a percentage point during the year.
In contrast, short-term interest rates for much of the year reflected the prevailing relatively tight financial conditions. Despite small reductions in the issue yield on Treasury notes in July, October and November, private short-term rates generally tended to be slow to fall from the seasonal peak of mid-1977 and, until late in 1977/78, were mostly higher than at comparable periods of 1976/77. With the more modest June quarter run-down in liquidity in 1977/78, seasonal increases in short-term interest rates were not as marked as at the end of 1976/77.
Financial Intermediation
Total assets of financial intermediaries are estimated to have expanded by about 10 per cent in 1977/78, some two-thirds the rate in 1976/77. As in most recent years, except those from 1972/73 through 1974/75, non-bank intermediaries' balance sheets grew faster than those of banks.
The pace of expansion of financial intermediaries in 1977/78 seems to have been fairly close to the growth in nominal GDP. However, since the mid 1960s, growth of financial intermediaries in aggregate in Australia has tended to outstrip, somewhat, nominal growth in the economy as a whole, though to a lesser extent than in a number of countries with which we commonly make comparisons.
The authorised dealers in the short term money market were one of the few groups of financial intermediaries whose balance sheets expanded much more quickly in 1977/78 than in 1976/77. Despite the prolonged seasonal run-down in mid-1977, dealers at that time began to substitute longer-term securities for Treasury notes, and to seek to take on additional securities. In the June and September quarters, dealers had substantial recourse to finance from the Reserve Bank to maintain their portfolios. Those portfolios expanded rapidly through the restrained seasonal run-up of 1977/78. Their loans from clients peaked in February at an all time high of about $1.5 billion; the average term to maturity of portfolios was longer than usual. Dealers ended the year with loans from clients a little below the February peak, but still considerably larger than twelve months earlier.
The intake of funds by financial intermediaries in the main was limited during the early part of 1977/78. Savings banks and money market corporations did better towards the end of 1977, but other groups still lagged. The second half of the financial year saw a stronger intake by banks and building societies; intake by finance companies and money market corporations overall was fairly moderate.
Major trading bank deposits rose by about 2 per cent in 1977/78, much more slowly than in 1976/77 and the slowest growth for any year since 1960/61. Deposit growth was a good deal less than seasonal in the early part of the financial year, but improved considerably through the second half. Growth in fixed deposits was only about one-eighth that of 1976/77. Certificates of deposit fell. Current deposits continued the moderate growth of 1976/77.
Savings bank deposits grew by slightly over 10 per cent in 1977/78, about the same rate as in 1976/77. Investment accounts and deposit stock accounted for about half the growth in savings bank deposits; these higher yielding accounts grew a little less quickly in 1977/78 than in 1976/77, while ordinary accounts grew at a rather faster pace in the latest financial year.
7 Private Finance — Selected Liabilities
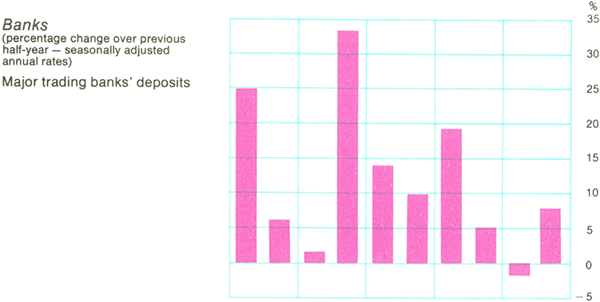

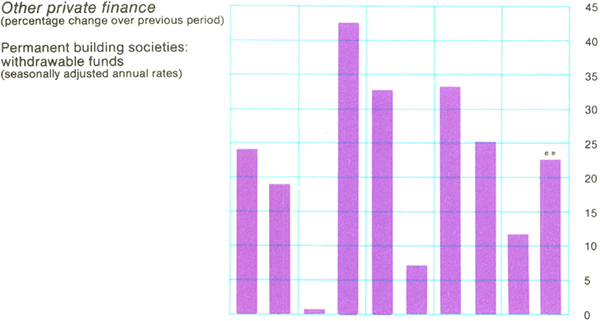


The intake of funds by permanent building societies was moderate in the first half of 1977/78, reflecting the prevailing tight financial conditions, and the difficulties encountered by some Queensland societies. Performance in the second half of the year was closer to that in the second half of 1976/77. Over 1977/78 as a whole, the net increase in withdrawable funds, although less than in the previous twelve months, was still substantial at about 17 per cent.
Borrowing from the public by finance companies slowed in the half year to June 1977; this slow-down followed news of substantial write-offs by some companies stemming from the ending of the property boom of some years ago. Finance company borrowing picked up in the first half of 1977/78 but, with demand for finance mostly limited, was lower in subsequent quarters. For the full year, borrowings outstanding rose by about 15 per cent, compared with about 20 per cent in 1976/77.
After a slow start to the financial year, borrowings outstanding of money market corporations rose more strongly in the December quarter, and by a further small amount in the second half of the year. Over 1977/78, total borrowings by these institutions are estimated to have risen a little faster than the 13 per cent increase recorded in 1976/77.
Generally, 1977/78 was a year of restrained demand for finance, other than for housing, small business and personal loans. Capital expenditure tended to be financed largely from internal sources or, sometimes, through direct approaches to the market, and demand on financial institutions for loans for this purpose was limited. Towards the end of the financial year, with an impending reduction in tax concessions for capital spending, there was an upsurge in demand for finance, including leasing finance which had been growing generally during the year.
8 Private Finance — Selected Assets
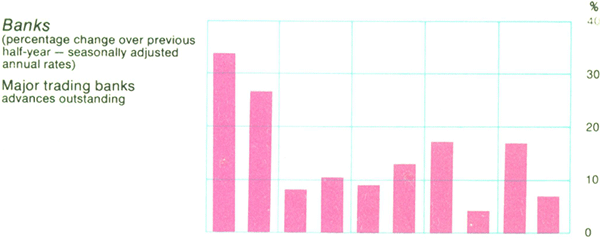
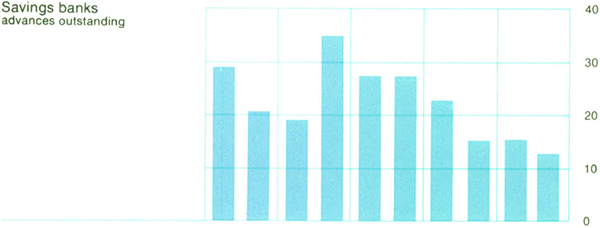
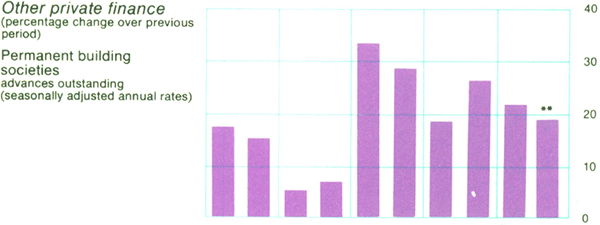

New lending by the major trading banks, boosted by some special factors, picked up fairly strongly in the early months of 1977/78, despite banks' limited deposit growth and tight liquidity. Through the middle of the financial year rates of gross overdraft approvals fell to a little over $100 million per week, but moved considerably higher during the seasonal run-down. All categories of lending were higher in 1977/78, with personal instalment loans, and loans to the finance and manufacturing sectors, the leaders. With the higher new overdraft approvals in 1977/78 there was a higher average rate of cancellations and reductions of existing limits, but net new lending was still greater than in 1976/77. The proportion of limits drawn was quite high at about 69 per cent at the beginning of 1977/78, but declined to a little over 65 per cent at the end.
Growth of major trading bank loans outstanding slowed progressively through 1977/78. Over the full year growth in advances outstanding was about 12 per cent, compared with 11 per cent in 1976/77. Charge card loans, and personal instalment loans, outstanding again grew strongly. There was also a rise in banks' holdings of commercial bills, compared with net declines in the two previous years.
The weakening in new dwelling construction in 1977/78 directed attention to finance for housing. The housing industry faces problems which include an overhang of stocks; the greater preference for used, as against new, dwellings; and substantial changes in demographic patterns, including the rate of formation of households. The complexities of this situation are such that availability of finance cannot provide a simple, single answer to the decline in activity in that industry.
The Bank conveyed to intermediaries the Government's wish to encourage lending for private home building. With no restraints, from a policy viewpoint, on institutional lending for housing, the provision of housing finance depended very much on the level of demand, and on decisions of individual lending institutions, in the light of their funds positions. Total finance provided by banks and permanent building societies in 1977/78 totalled $4.8 billion, about 7 per cent more than in 1976/77. The proportion of this money lent for new dwellings remained low by historical standards. Savings banks, with firm deposit growth and no pressing curbs from statutory asset ratios, approved loans of about $2.2 billion for housing in 1977/78, 6 per cent more than in 1976/77. Trading banks, despite tighter liquidity, made loans for housing approaching $0.9 billion, also about 6 per cent higher than in the previous twelve months. Permanent building societies, despite some falling away after the September quarter, increased their new housing loan approvals by almost 9 per cent to $1.7 billion. Additionally, finance companies lent slightly over $300 million to individuals for housing, some 15 per cent less than in 1976/77.
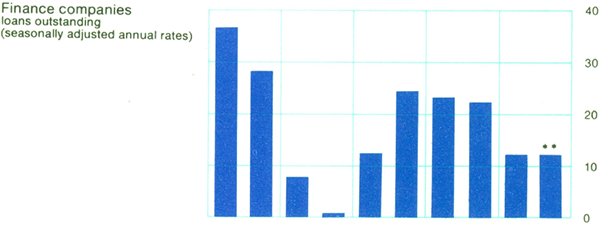
Finance companies' aggregate loans outstanding grew by around 13 per cent in 1977/78, a little more than half the pace of the previous twelve months. With strong competition from banks in the area of personal finance, new lending by these companies generally was not much above the levels of the previous year, while collections and liquidations grew more strongly. There seems to have been some refinancing of existing loans on the more favourable terms available in a less buoyant market, and perhaps some shortening in the term of loans.
9 Private Finance — Liquidity

Corporate liquidity was relatively high in 1977/78, and direct approaches by non-finance companies to the capital market in aggregate were not much greater than in 1976/77. Against this background, advances of money market corporations grew moderately over most of 1977/78. However, advances by these institutions gathered momentum with the end-year rise in demand for finance, and for the year as a whole rose by about 20 per cent, compared with 15 per cent in the previous twelve months.
The lower intake of funds by financial institutions in 1977/78 often was not fully matched by a slower pace of lending, and institutional liquidity positions in many cases were tighter than in the previous twelve months.
The LGS ratio of the major trading banks rose less than seasonally during the liquidity up-swing of 1977/78. The monthly average LGS ratio peaked at 24.6 per cent. With different seasonal patterns, the peak LGS ratio was 30.3 per cent in 1976/77, and averaged 29.7 per cent in the previous five years. The margin of free liquidity was not so greatly different between 1976/77 and 1977/78; for the first nine months of 1976/77 the minimum LGS ratio, normally 18 per cent, had been temporarily at the higher level of 23 per cent. In the June quarter of 1978, the drop in major trading bank liquidity was less than seasonal, and the LGS ratio ended the year at 21.4 per cent, close to the ratio in June 1977. Despite the pattern of SRD releases during 1977/78, and inter-bank lending which redistributed available liquidity between banks, there was some recourse by the banking system to Reserve Bank finance both at the beginning and end of the year.
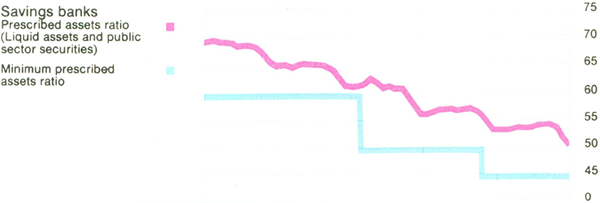
With similar deposit growth and, despite higher new lending, some slow-down in growth in advances, the ratio of savings banks' prescribed liquid assets and government securities to deposits declined less in 1977/78 than in the previous twelve months. This ratio stood at slightly over 51 per cent at end-June 1978, compared with 54 per cent a year earlier, and the prescribed ratio of 45 per cent for banks subject to the Banking Act. Savings banks' holdings of government bonds fell slightly in 1977/78, following the fall in the previous financial year; their holdings of local and semi-government securities rose by about $420 million, some 26 per cent less than in 1976/77.
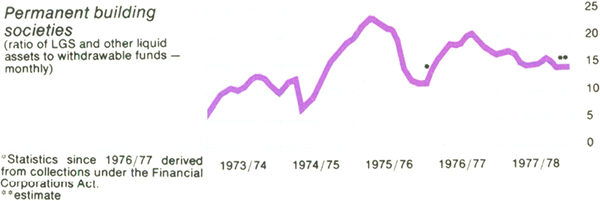
In the prevailing tight financial conditions, and with personal tax refunds lower than in 1976/77, the seasonal boost to the liquidity positions of permanent building societies in the early part of 1977/78 was lower than in previous years. Societies' liquidity built up a little in early 1978, but dropped back seasonally later. At end-June 1978, their ratio of liquid assets to withdrawable funds was close to 15 per cent, compared with 17 per cent a year earlier.