Reserve Bank of Australia Annual Report – 1979 Notes on International and Australian Economic Developments
Overseas economic conditions
The rate of economic growth in OECD countries steadied in 1978 after its fall in the previous year. It seems to have moderated a little in the first half of 1979 when growth in activity in the United States fell.
Employment has grown at a modest pace in many countries and, until recently, quite quickly in the United States; increases in productivity have generally been weak. Despite some declines, unemployment rates have, on the whole, stayed high.
The inflation rate for OECD countries has been sticky at 8 to 9 per cent per annum. Some acceleration occurred in the first half of 1979 when price rises picked up in the United States and downward pressure on Japanese prices, which had flowed from the appreciation of the yen, was reversed. Big increases in oil prices have played a part.
Monetary aggregates continued to grow at a fast pace in 1978; two influences were continuing large government deficits in most countries and some reluctance to adjust exchange rates.
Interest rates were lifted in several countries during 1978/79. As well as in the United States and Japan, rates rose in West Germany, the United Kingdom and on the Eurodollar market.
World trade and payments
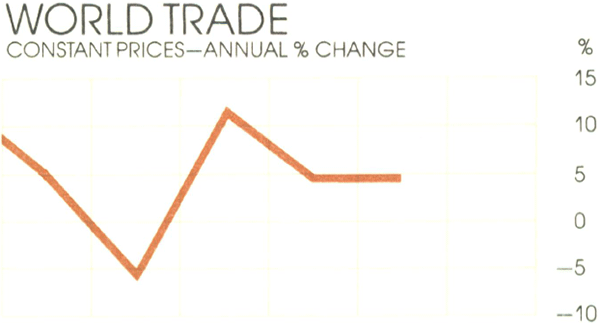
The volume of international trade expanded in 1978 at the same rate as in the previous year. Growth was maintained into 1979.
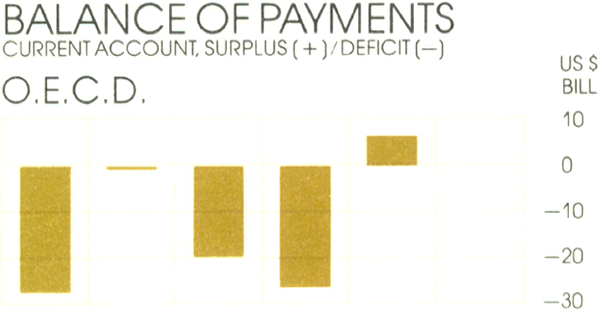
The current account of the OECD area shifted to a small surplus in 1978. Japan's surplus increased substantially, while some major European countries moved into, or further into, surplus. The deficit of the United States remained large.
For 1979, the current account for OECD countries is likely to return to deficit, largely as a result of higher oil prices. However, within the overall result, the surpluses of Japan and Germany and the deficit of the United States may be much smaller than in the previous year.
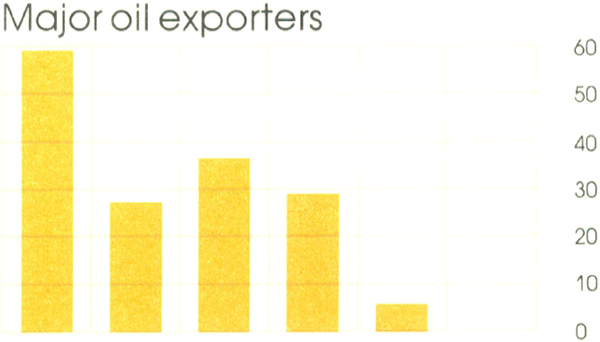
The surplus of the major oil exporters was considerably reduced in 1978 but, with higher export prices, is likely to rise in 1979.
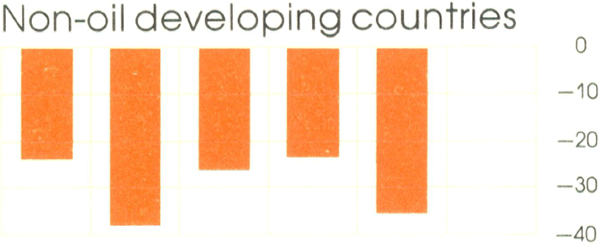
Other developing countries have been in substantial deficit for some years; the increase in 1978 was due in part to a deterioration in their terms of trade.
Exchange rates
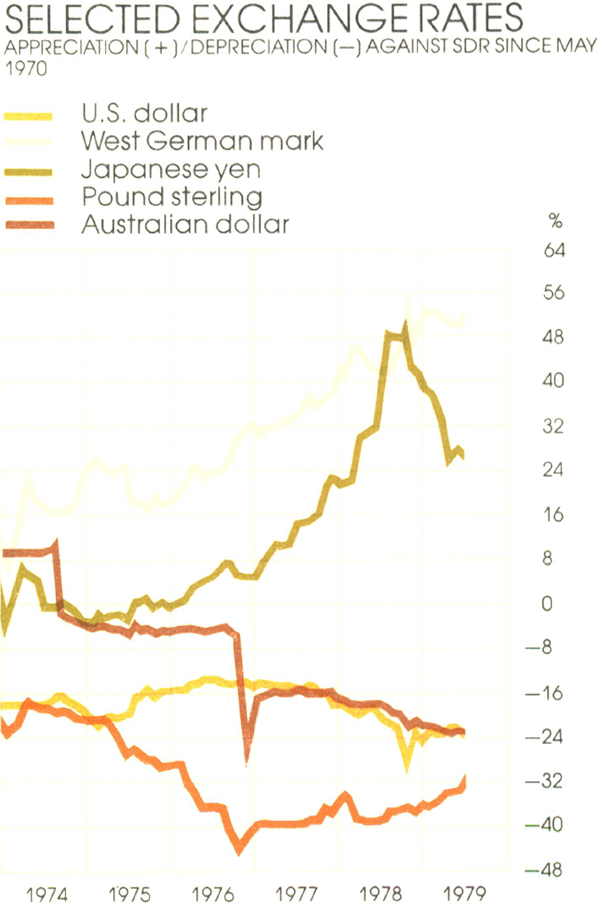
Foreign exchange markets were very disturbed for much of 1978. In November, the sharp decline in the U.S. dollar was arrested and reversed by the announcement of measures to tighten financial conditions in the United States and to protect the dollar. In the first half of 1979, when imbalances in external payments among the major countries were reduced, markets were more settled.
12. OVERSEAS ECONOMIC INDICATORS II
13. AUSTRALIA'S BALANCE OF PAYMENTS
SURPLUS (+)/DEFICIT (−)
Australia's balance of payments
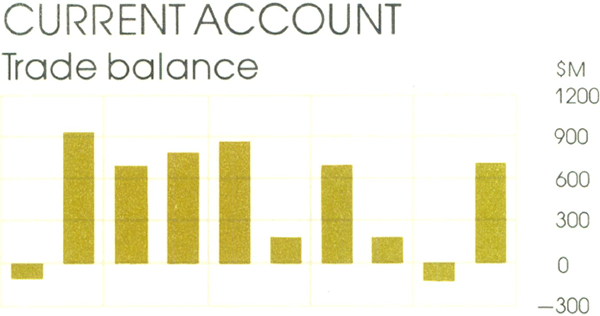
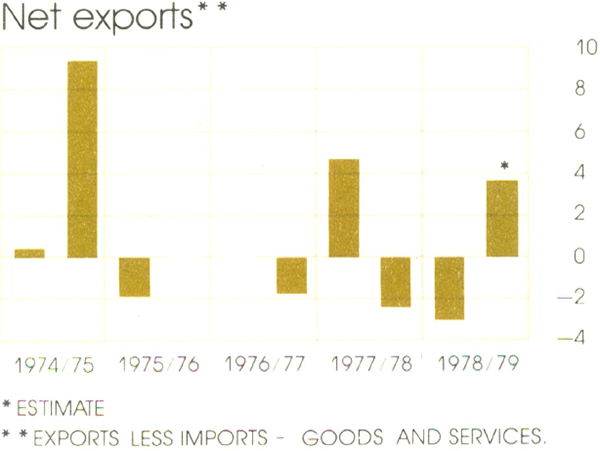
The surplus on Australia's balance of trade in goods (exports less imports) was somewhat lower in 1978/79 than in 1977/78. There was, however, a considerable strengthening in the second half of the year.
Export volumes were depressed in the early months of 1978/79 by specific factors such as a small carryover of wheat and some industrial problems. Subsequently, however, they increased strongly. Meat, wool and manufactured goods were major contributors to the growth in receipts for the year.
Imports, particularly of machinery and transport equipment, increased rapidly in the first half of 1978/79; residual effects of the 40 per cent investment allowance may have had much to do with this. A buoyant rate of importing was maintained in the six months to June.
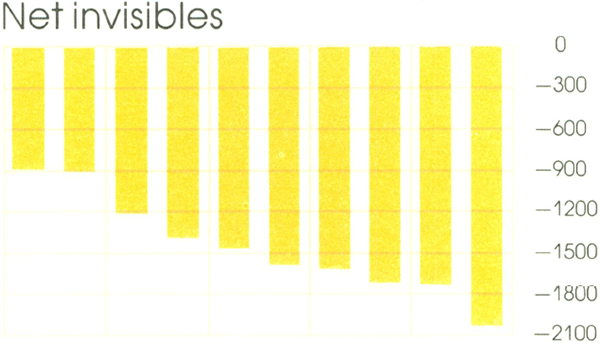
The deficit on transactions in invisibles increased further in 1978/79. Interest on government debt and higher transportation payments, owing to the growth in trade volumes and increased charges, were prominent in the rise in debits.
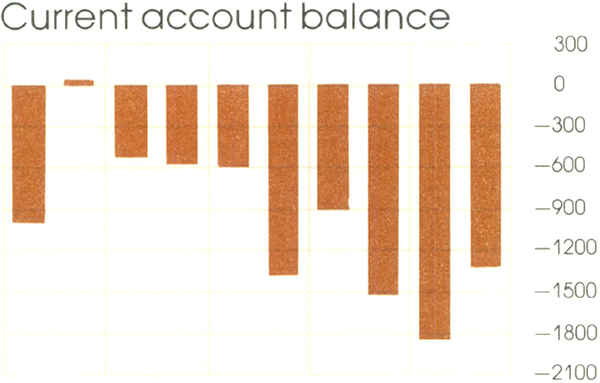
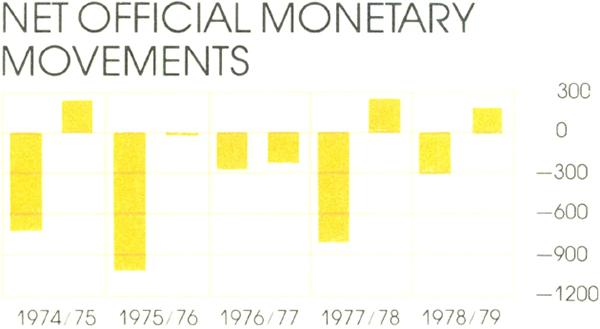
The overall deficit on current account came to $3,170 million in 1978/79.
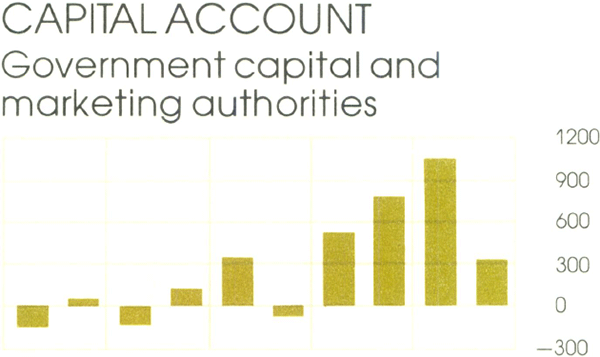
Net borrowing overseas by the Commonwealth in 1978/79 was $1,350 million, compared with about $1,610 million in 1977/78.
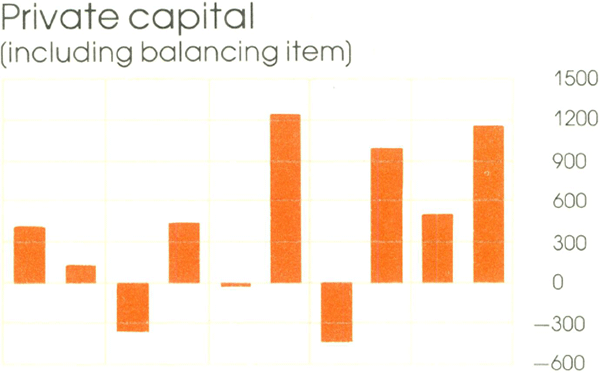
Including undistributed income of $680 million and borrowing of around $150 million by State authorities, net apparent private capital inflow to Australia was about $1,650 million; this was almost three times the figure for 1977/78.
Bringing the various components together, Australia's loss of international reserves due to net official monetary movements was $130 million in the year past.
Production and spending
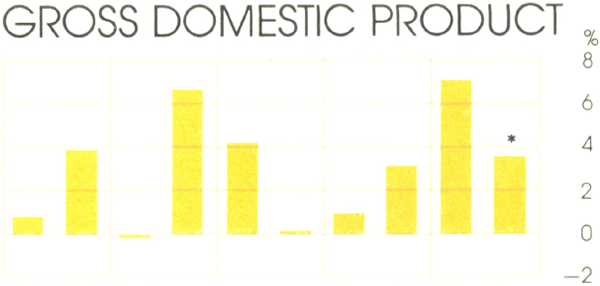
Gross domestic product, at constant prices, rose strongly in 1978/79.
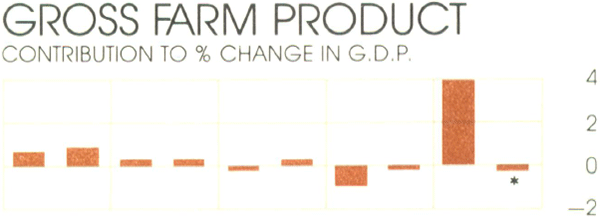
Farm production made a major contribution to the rise in total product. Output of wheat and other grain crops rose strongly; beef production was buoyant, although below the record level of the previous year.
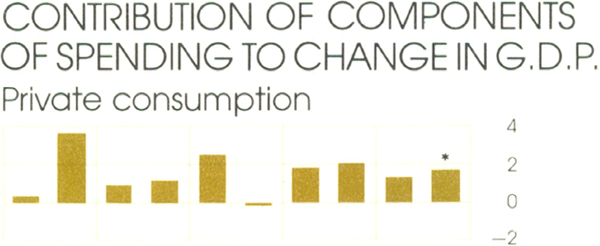
Despite the imposition of the income tax surcharge, the real disposable income of households increased and private consumption rose at a moderate pace in 1978/79.
Private investment in dwellings picked up during the year; finance approvals for housing rose markedly.
The rate of increase in business fixed investment was not as strong in the second half of 1978/79 as in the first half.
Public spending increased modestly in 1978/79; current spending increased while capital expenditure fell.
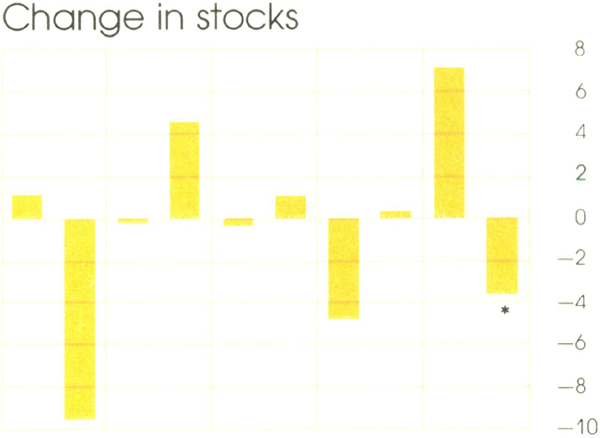
Reflecting the figures for production, farm stocks rose strongly in 1978/79 after declining in the previous year. Accumulation of non-farm stocks, though not heavy, was greater in 1978/79 than in 1977/78.
The movement in the balance of trade in goods and services made a sizeable negative contribution to growth in product in the first half of 1978/79. This was reversed in the six months to June when export volumes expanded strongly.
14. PRODUCTION AND SPENDING
1974/75 PRICES, HALF YEARLY % CHANGE AT ANNUAL RATES, SEASONALLY ADJUSTED


15. LABOUR MARKET
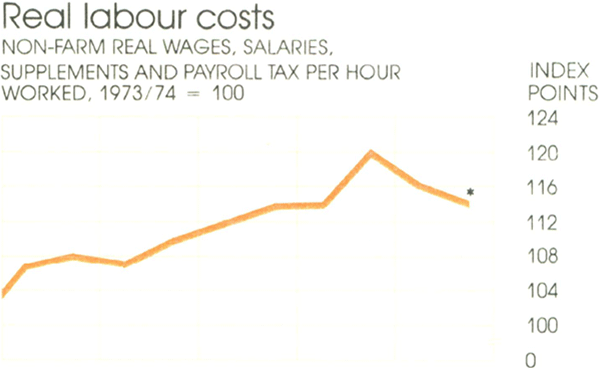
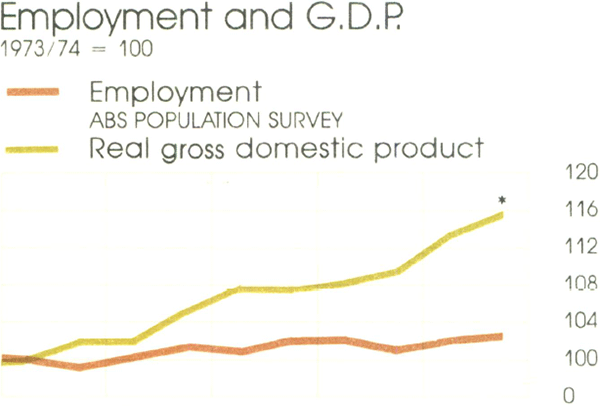
SEASONALLY ADJUSTED HALF-YEARLY AVERAGES
Labour market
The real cost of an hour's labour by a wage and salary earner rose substantially around the mid 1970s and, on average, has not changed much since. Over this time, capital expenditure has been subsidised by some government schemes.
Total employment has been sluggish over a period when production has grown at a reasonable pace, a pattern of events which contrasts with the recent experience in many overseas countries. The aggregate figures for employment in Australia may understate moves to economise on labour: there have been trends toward more use of self-employed and part-time workers.
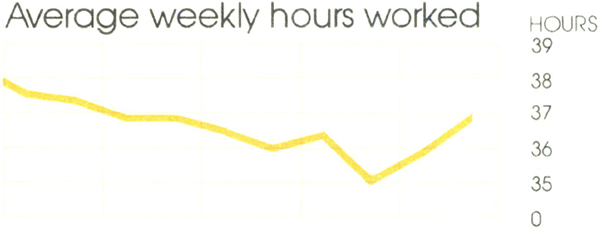
The average number of hours worked had generally declined in recent years; there was some growth in overtime worked during 1978/79.
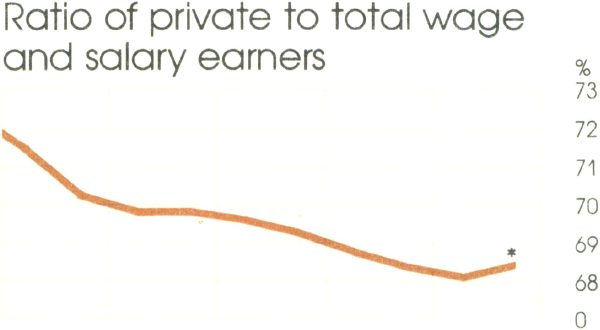
The proportion of wage and salary earners in private employment declined after 1973/74; it had been fairly steady for several years. In 1978/79 the first rise for some years in private employment was recorded.
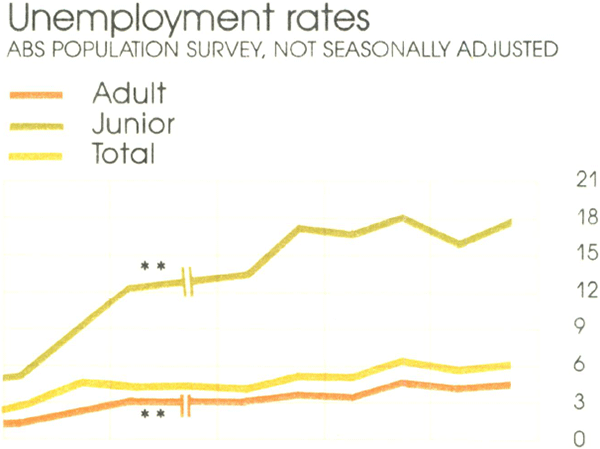
According to the population survey conducted by the Australian Bureau of Statistics, unemployment stayed high, but steadied, in 1978/79. Unemployment rates for juniors are particularly high, although possibly reduced somewhat by government-sponsored training programmes and subsidies. Wage rates for juniors relative to those of adults have risen in recent years.
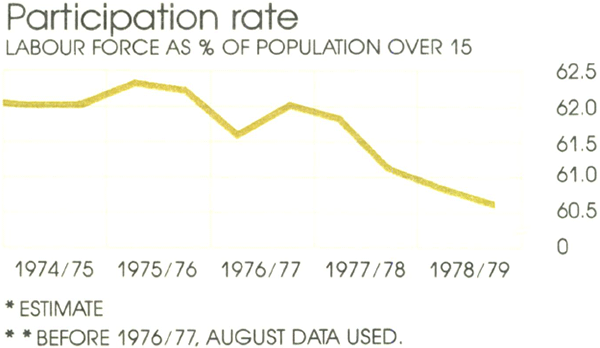
With the shortage of jobs, the participation rate has tended to decline. This has reduced numbers of people counted as unemployed.
Prices, incomes and costs
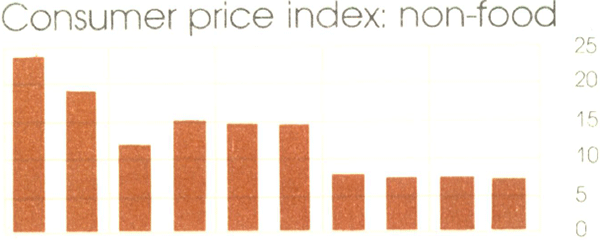
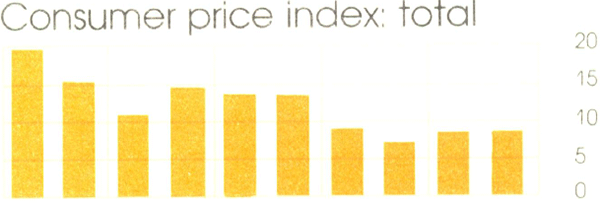
Food prices increased rapidly in 1978/79; about half of the overall increase was due to rising meat prices.
For 1978/79 as a whole, other consumer prices rose a little less rapidly than in 1977/78. Specific factors raising this component of the consumer price index included higher government charges and oil prices; changed arrangements for health payments provided some offset.
On an annual average basis, the consumer price index in 1978/79 increased by 8.2 per cent, compared with a rise of 9.5 per cent in 1977/78. The rises in the index within the two years were 8.8 per cent and 7.9 per cent respectively.
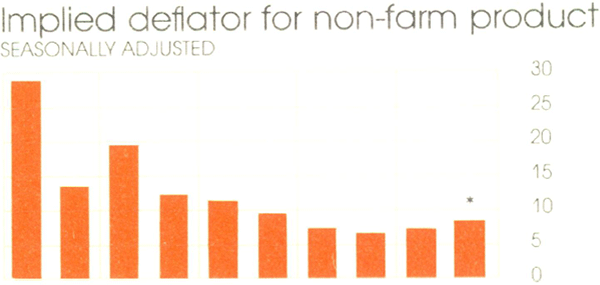
The implied price deflator for non-farm product increased at about the same rate in 1978/79 as in the previous year.
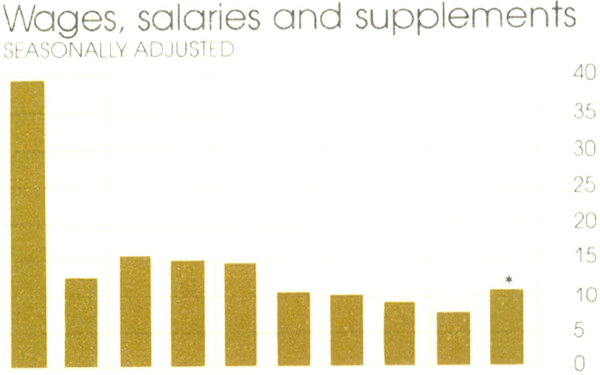
With employment expanding only slightly and average earnings increasing by less than in the previous year, growth in wages, salaries and supplements was slower in 1978/79. The rise in average earnings during the year was reduced by the move to six-monthly indexation hearings, but there appeared to be more increases outside national wage cases.
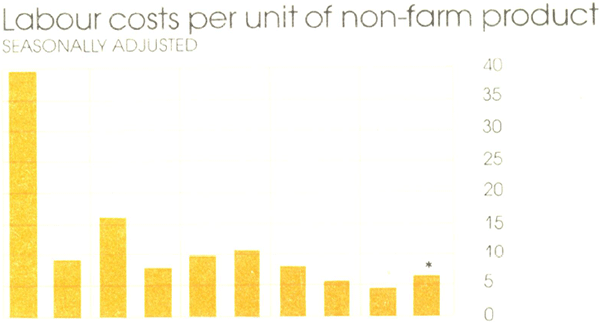
Lower growth in wages and salaries, combined with the firm rise in production, meant that unit labour costs increased less in 1978/79 than for several years.
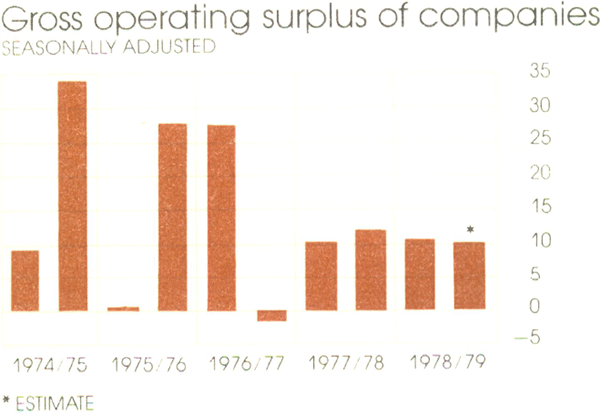
With the reduced pace of growth in unit labour costs, compared with the more steady increase in average product prices, there was some further growth in company profits.
16. PRICES, INCOMES AND COSTS
HALF-YEARLY % CHANGE AT ANNUAL RATES

