Reserve Bank of Australia Annual Report – 1982 Economic and Financial Developments in 1981/82
1. Overseas Conditions
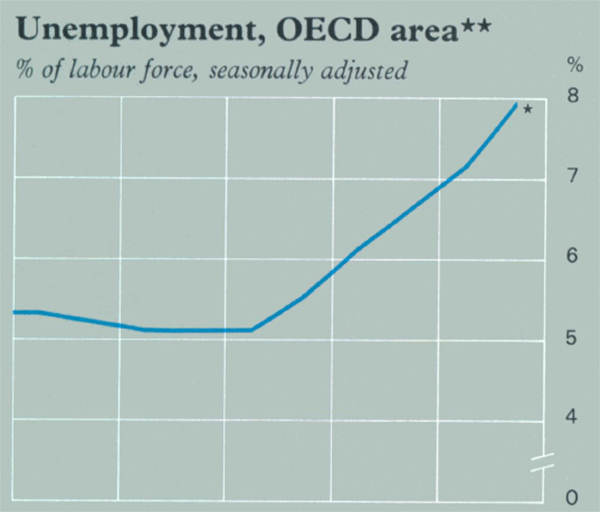
The major industrialised countries experienced another year of recession in 1981/82. In the period since the second half of 1979, real GDP in the OECD area is estimated to have risen by 1.3 per cent and real domestic demand to have fallen by about 0.2 per cent. Although there was a temporary lift in activity in the first half of 1981 in some countries, the two and a half years since the end of 1979 has been a period of recession in the world economy as a whole, the longest in the post-war period.
Experience among countries has differed. The United States economy picked up for a while at the end of 1980 and beginning of 1981 but activity has declined since; in the first half of 1982, real GNP was 2.4 per cent lower than a year earlier, and 0.9 per cent lower than in the second half of 1979. In 1981 real GNP fell in Germany by 0.3 per cent and the United Kingdom by 2.0 per cent; it was flat in both countries in the first half of 1982. In Japan, however, real GNP rose by 3.0 per cent in 1981, but growth slowed in the first half of 1982.
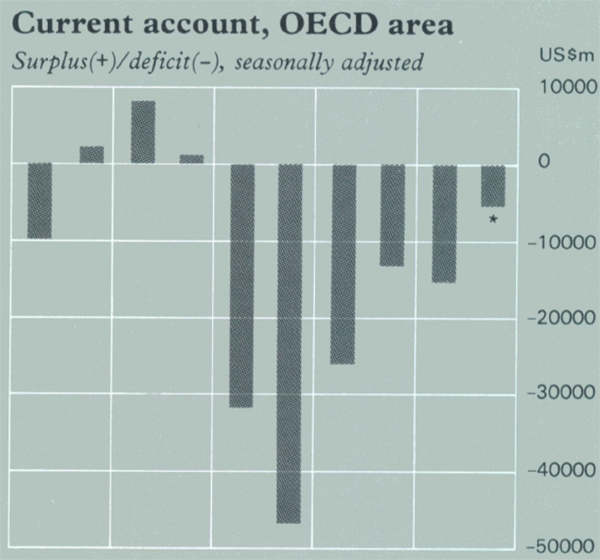
The growth of world trade was again subdued. OECD area imports fell by 2 per cent in real terms in 1981 after a fall of 1 per cent in 1980. OECD area export growth has generally been stronger than that of imports, in large part because of the strength of OPEC demand. As a result, the current account deficit of the OECD area fell from US$70 billion in 1980 to US$30 billion in 1981, and is estimated to have run at an annual rate of US$10 billion in the first half of 1982. The counterpart to the decline in the OECD area deficit was a fall in the OPEC surplus from US$110 billion in 1980 to an estimated annual rate of US$15 billion in the first half of 1982; at this time the deficit of the non-oil developing countries was estimated at an annual rate of US$80 billion.
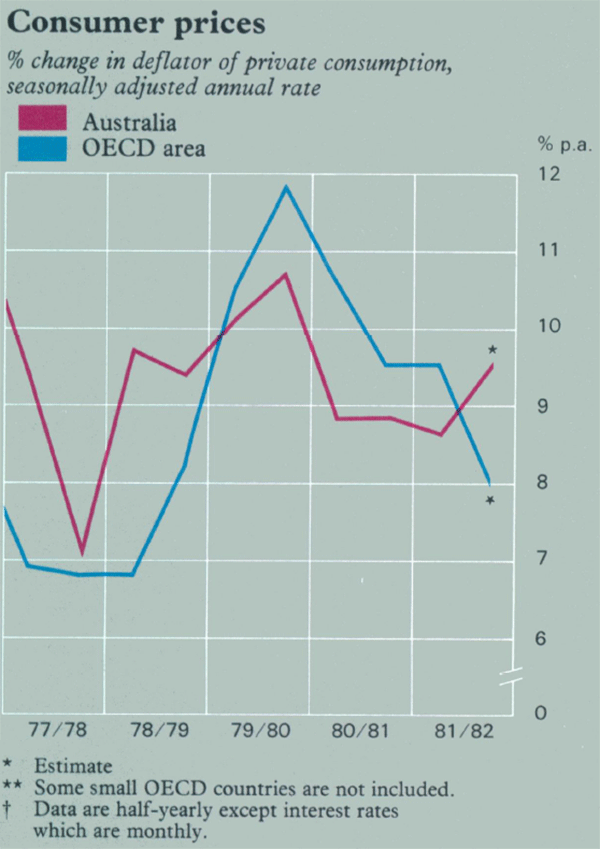
Rates of inflation in other countries have fallen appreciably over the last twelve months. The increase in consumer prices in the OECD area in the twelve months to May 1982 was 8.4 per cent, compared with 10.4 per cent in the twelve months to May 1981. Over the six months to May 1982, this measure of consumer prices increased at an annual rate of 7.7 per cent. Important factors working towards reduced inflation were lower levels of demand and falling commodity prices, especially oil prices. There was a general weakening in spot prices for crude oil during 1981, and by the beginning of 1982 a number of producers had reduced their official prices or were offering discounts. A further influence on inflation was the slower growth in unit labour costs in major OECD countries; these grew by 8.5 per cent in 1981 compared with 10.5 per cent in 1980.
Demand management policies in industrialised countries have continued to aim at restraint. Although budget deficits are high in many countries, partly for cyclical reasons, monetary policy has remained tight. Growth rates of monetary aggregates in industrialised countries over the past two years have been low relative to the rates experienced in the seventies and relative to recent rates of inflation. In the United States the combination of monetary restraint plus an increasing budget deficit has kept upward pressure on interest rates despite the fall in the rate of inflation. Other countries have been forced to react in varying measure to the high interest rates in the United States or to see large falls in their exchange rates.
Overseas Economic Indicators†
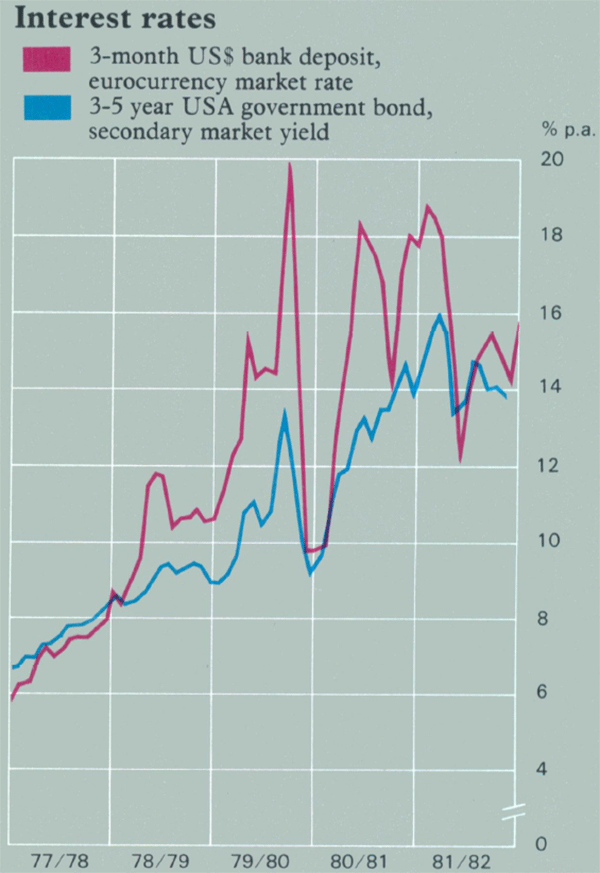
Short-term interest rates remained high in 1981/82, although in most cases they were lower than the extremes reached in the previous year. There were quite large movements in rates within the year; for example, the yield on three-month United States Treasury bills fell from about 16.7 per cent in August to 10.3 per cent in December before rising again to 15.2 per cent in February. Long-term rates stayed high in most countries. Exchange rates were again volatile in 1981/82, but the major currencies did not move by quite as much overall as in 1980/81. Over the course of 1981/82 the United States dollar rose by 10 per cent on a trade-weighted basis, compared with a rise of 14 per cent in the previous twelve months. Within the year there were some large fluctuations in the trade-weighted value of the United States dollar – a fall of about 8 per cent between early August and end November and a rise of 15 per cent between end November and late June 1982.
2. Economic Activity In Australia
The Balance of Payments
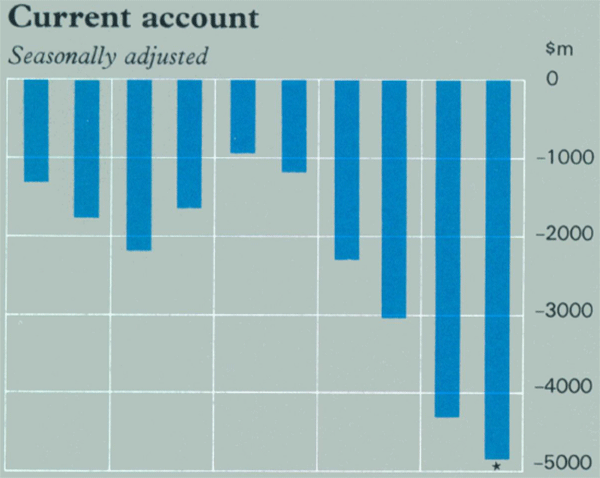
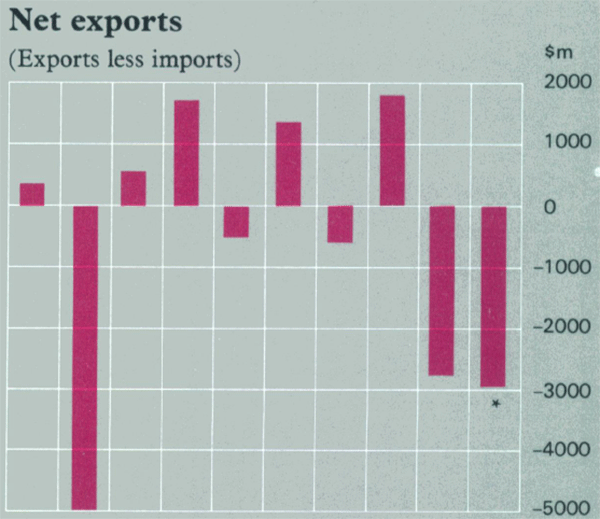
The deficit on current account of the Australian balance of payments rose from $2,071 million in 1979/80 and $5,225 million in 1980/81 to $9,097 million in 1981/82.
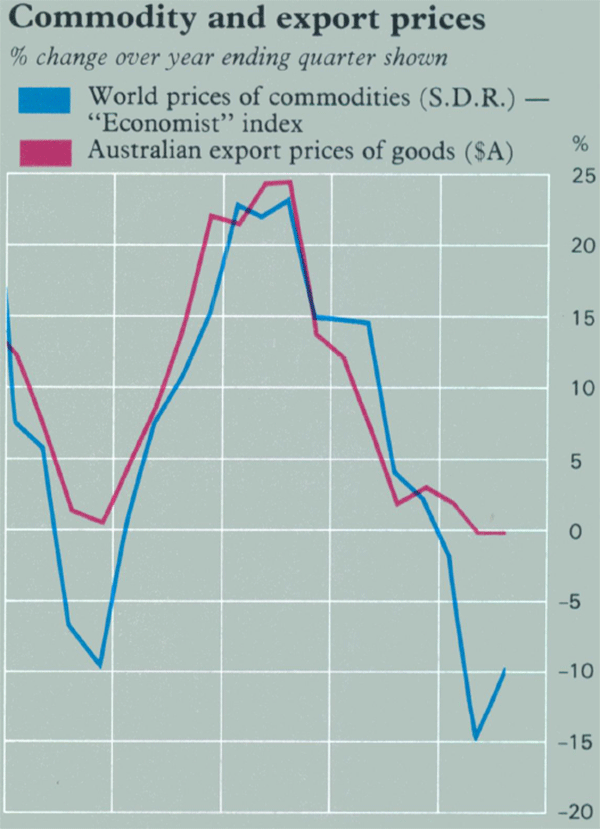
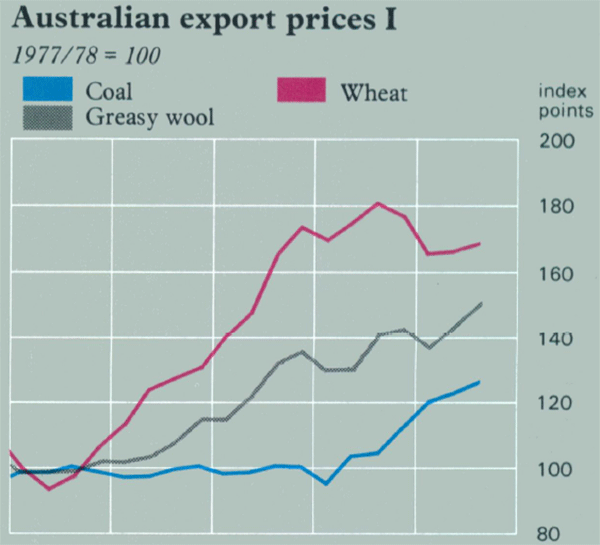
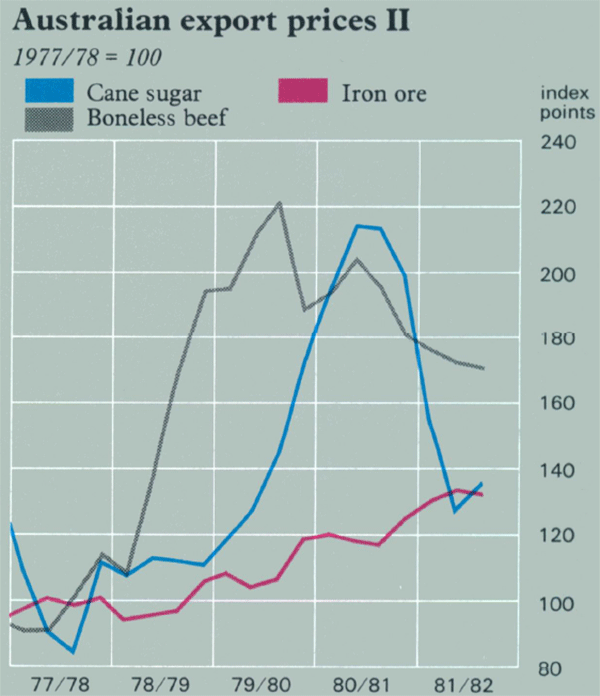
Exports of goods were again affected by weak external demand and rose by 1.5 per cent in value terms after a rise of 1.3 per cent in 1980/81. Following a fall in export volumes in 1980/81 of around 6 per cent, there appears to have been a further small fall in 1981/82. Seasonal conditions in the rural sector improved (the tonnage of wheat exported rose by 11 per cent). Lower shipments of coal, however, reflected continuing industrial problems. Export prices rose by about 2 per cent in 1981/82 after an increase of 7.5 per cent a year earlier. The only major exports for which prices rose appreciably were iron ore and coal; the prices of beef, wheat and sugar fell.
Imports of goods grew by 17.2 per cent in value in 1981/82 after a rise of 21.2 per cent the previous year. Much of the increase seems to have been due to volume increases, prices again being restrained by the sluggishness of world trade prices. The relatively strong growth of domestic demand, and the fact that its fastest growing component was business fixed investment, explained much of the buoyancy of imports. A decline in competitiveness probably also contributed; although the trade-weighted exchange rate fell through the year, it was, on average, about 3 per cent higher in 1981/82 than in the previous year and rates of increase in prices and wages were higher in Australia than in major trading partners. Another factor behind the higher current account deficit was the growth in the deficit on invisible transactions from $4,855 million in 1980/81 to $5,697 million in 1981/82. A higher volume of borrowing at higher average interest rates accounted for the larger than usual increase in this item.
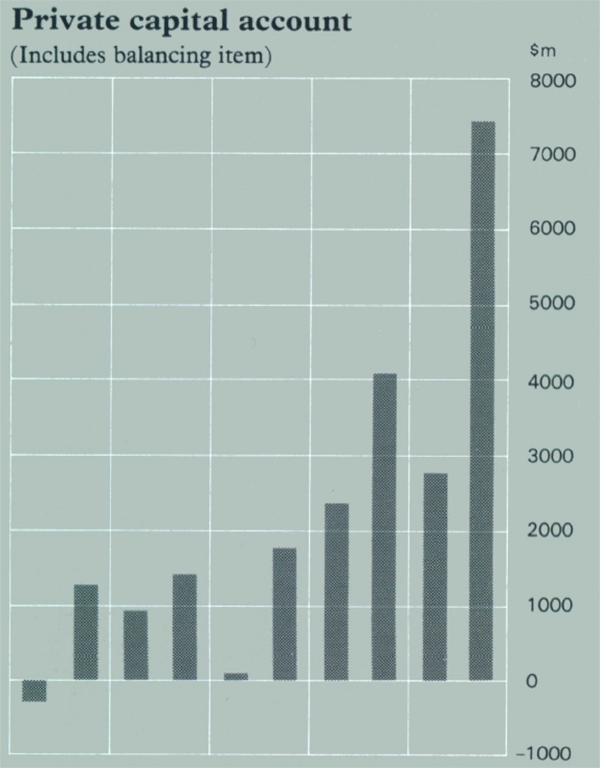
Private capital inflow was $10,203 million in 1981/82 compared with $6,443 million in 1980/81. For the first eight months of the year private capital inflow was running at about the same rate as in 1980/81, but in the last four months inflow amounted to $6,441 million, twice as much as in the comparable period of 1980/81. A high proportion of capital inflow was accounted for by borrowings.
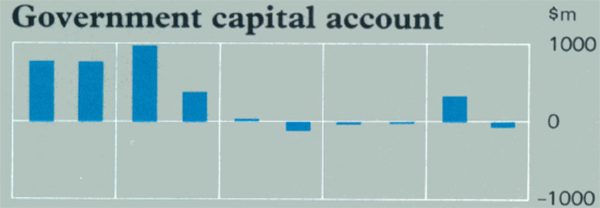
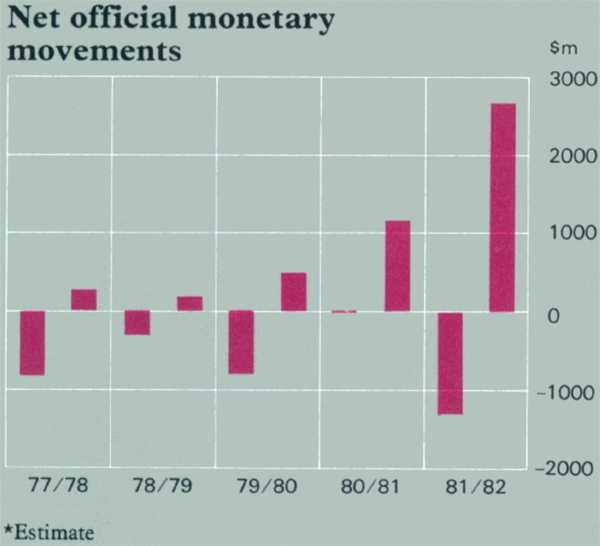
Government capital movements accounted for an inflow of $254 million. Overall there was a balance of payments surplus of $1,361 million in 1981/82 following a surplus of $1,149 million in 1980/81. The change in the valuation of reserves was – $556 million, so that international reserves rose by $808 million.
Australia's Balance of Payments
Half-yearly surplus(+)/deficit(−)
Export Prices
Quarterly data
Production and Spending
After rapid growth during the previous year, economic activity contracted from the latter part of 1981. At the beginning of 1981/82 the only clear signs of weakness were some recent falls in dwelling construction and a persistent decline in exports. By the December quarter it was apparent that industrial production was falling, employment weakening and consumption slowing. Early in 1982, various indicators of expectations showed that businesses and households believed that business conditions would worsen. Later in the year more conventional measures of economic activity confirmed the existence of the downturn and that business fixed investment, a mainstay of growth in 1980/81, had flattened out.
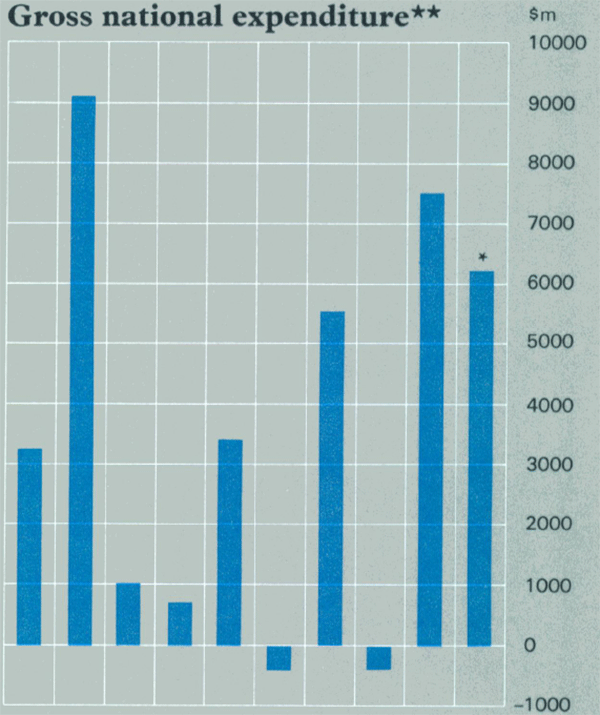
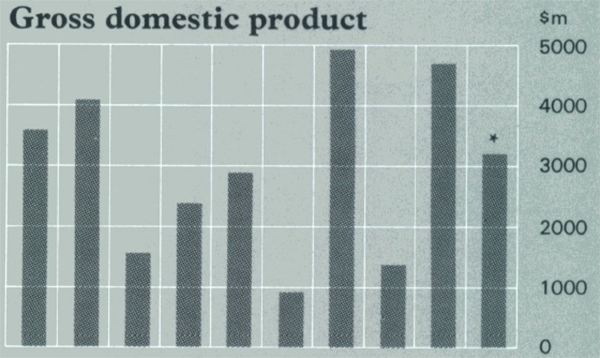
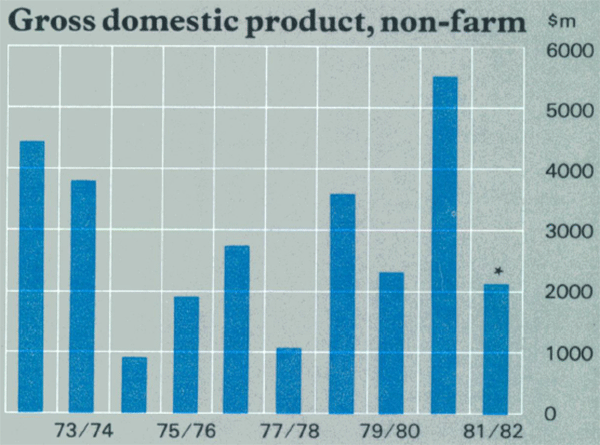
Real non-farm product rose strongly in the September quarter, but fell thereafter. Nevertheless, real non-farm product in 1981/82 is estimated to have been about 2 per cent higher than in 1980/81. With a large expansion in farm production (around 17 per cent), gross national product is estimated to have grown by about 2.7 per cent in real terms in 1981/82.
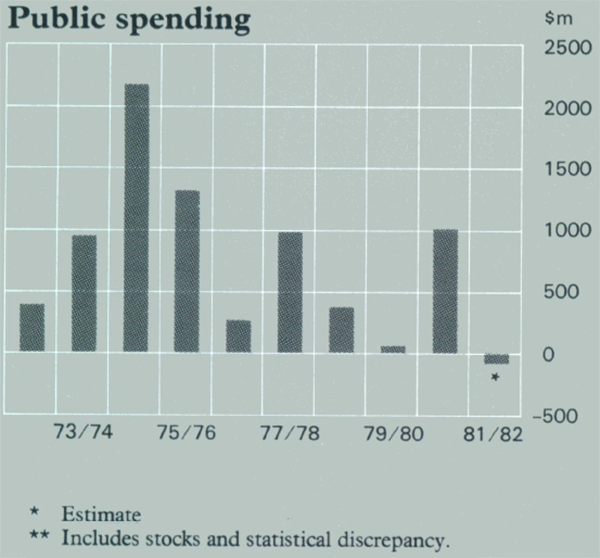
For the year as a whole spending is estimated to have risen by 5 per cent in real terms, compared with 6.6 per cent in 1980/81. This spending, combined with a decline in competitiveness, led to a strong increase in imports (around 12 per cent in real terms). Resource-related projects, in particular, required substantial imports of capital equipment. With exports flat, growth of production was again substantially lower than growth of spending.
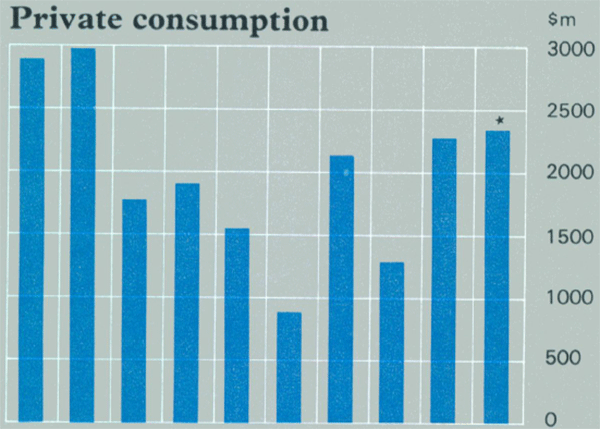
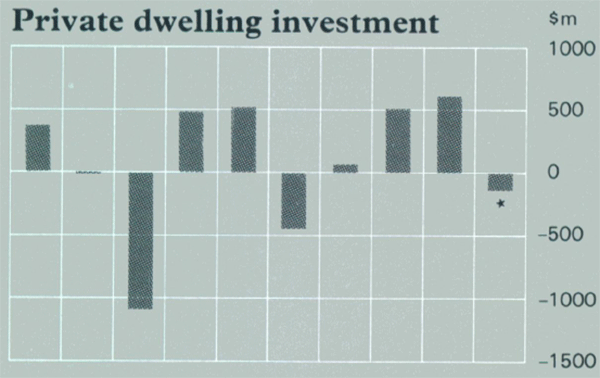
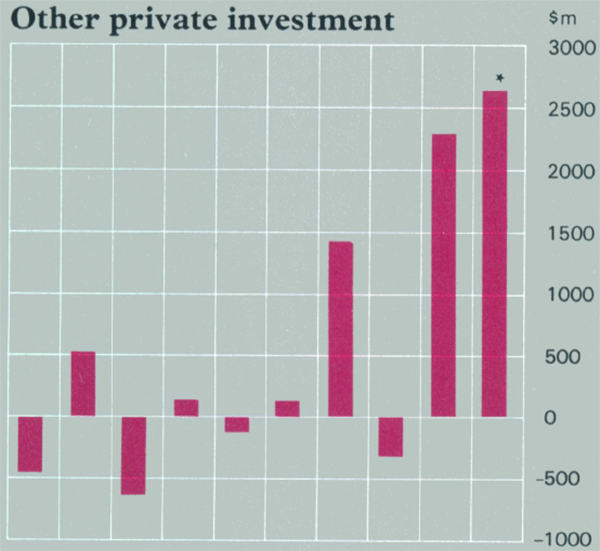
The strongest component of demand continued to be business fixed investment which is estimated to have grown by 19 per cent in real terms in 1981/82, much the same as in 1980/81. However, the figure for 1981/82 seems to have been boosted by some large sales of public sector capital assets to the private sector. Business fixed investment levelled off in the second half of the year; this probably reflected a number of cancellations and deferrals of projects following reassessment of future demand, prospects for exports, and costs of finance. Consumption grew by a little over 3 per cent in real terms, nearly 1 percentage point higher than its average growth over the previous five years; from late in 1981 its growth rate slowed. Investment in dwellings continued to decline during 1981/82 and is estimated to have fallen by about 3 per cent compared with 1980/81.
Labour Market
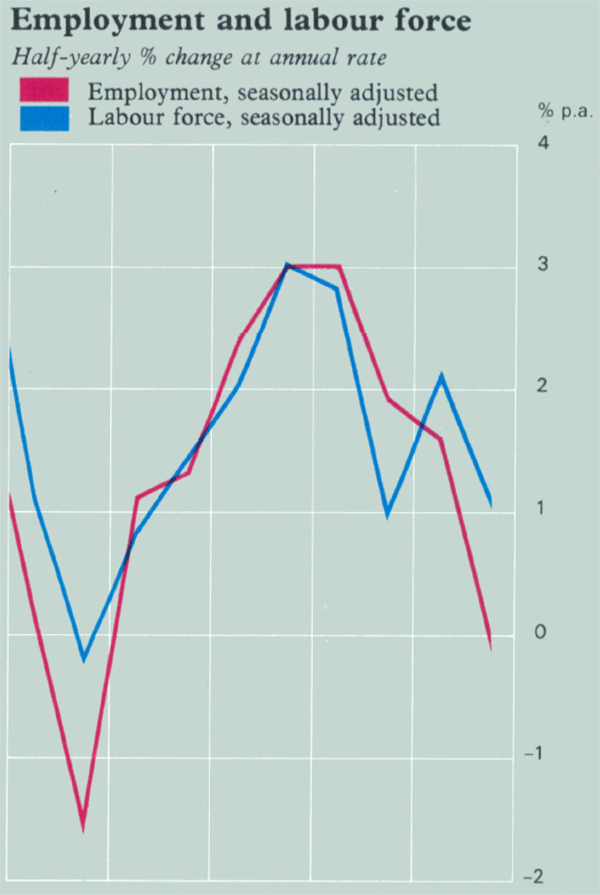
The labour market weakened considerably over the course of 1981/82. Growth of employment followed broadly the pattern of non-farm production, with the solid gains of the two previous years continuing in the September quarter but petering out during the remainder of the year. Taking 1981/82 as a whole, employment grew by 1.2 per cent. This compares with average growth of 2.5 per cent in the previous two years. The number of hours worked in the economy showed a more pronounced weakening; after rising by a little over 2 per cent in 1979/80 and 1980/81 the number of hours worked was steady in 1981/82. The slowing in growth of employment was more marked for part-time employment and the self-employed.
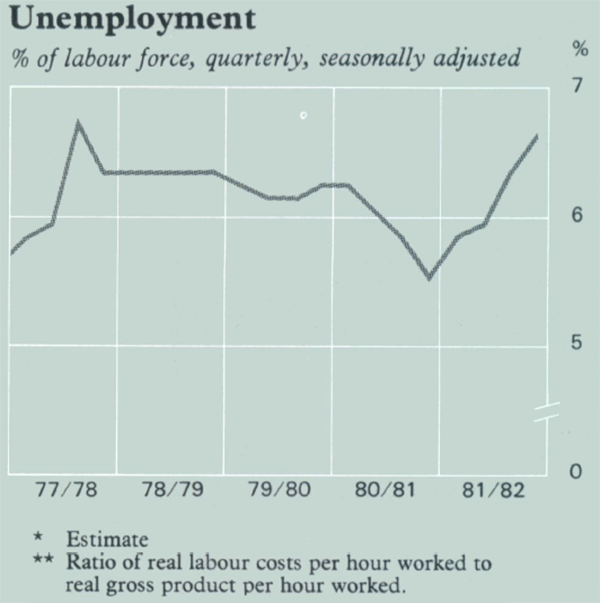
The rate of unemployment, after falling during 1980/81, increased throughout 1981/82. By June quarter 1982 it stood, on a seasonally adjusted basis, at 6.6 per cent, the highest rate for several years and 1.1 percentage points above the rate a year earlier. While the rise in the rate of unemployment for the year as a whole reflected the slowing of employment growth, its pattern through the year, particularly its rise in the September quarter, was due as much to changes in the participation rate.
Components of Spending
Annual change in $m, 1979/80 prices
Spending and Production
Annual change in $m, 1979/80 prices
Prices, Wages and Incomes
Rates of increase in a number of price indices in Australia slowed because of the weakness in commodity prices in 1981/82. The price indices of materials used in, and produced by, the manufacturing sector rose by around 2 per cent and 8 per cent, respectively, and as explained earlier, export prices and import prices also rose by only small amounts.
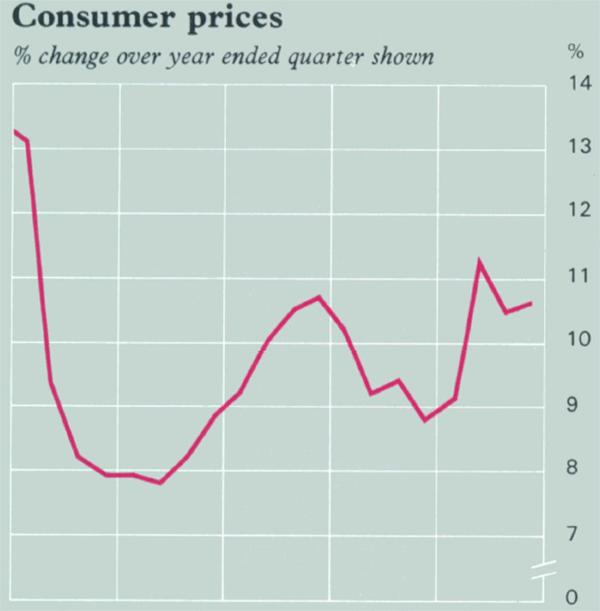
Although consumer prices benefited from these effects, the consumer price index nevertheless rose by 10.4 per cent in 1981/82, 1 percentage point more than in 1980/81. Part of the rise can be accounted for by changed hospital and medical arrangements and increases in government charges and indirect taxes in the December quarter. The implicit deflator of private consumption, a broader measure of consumer prices not much affected by these factors, rose by around 9 per cent, compared with 9.3 per cent in 1980/81. During the year ended the June quarter 1982 the consumer price index increased by 10.7 per cent; the comparable figure for the OECD area was a rise of 8.4 per cent.
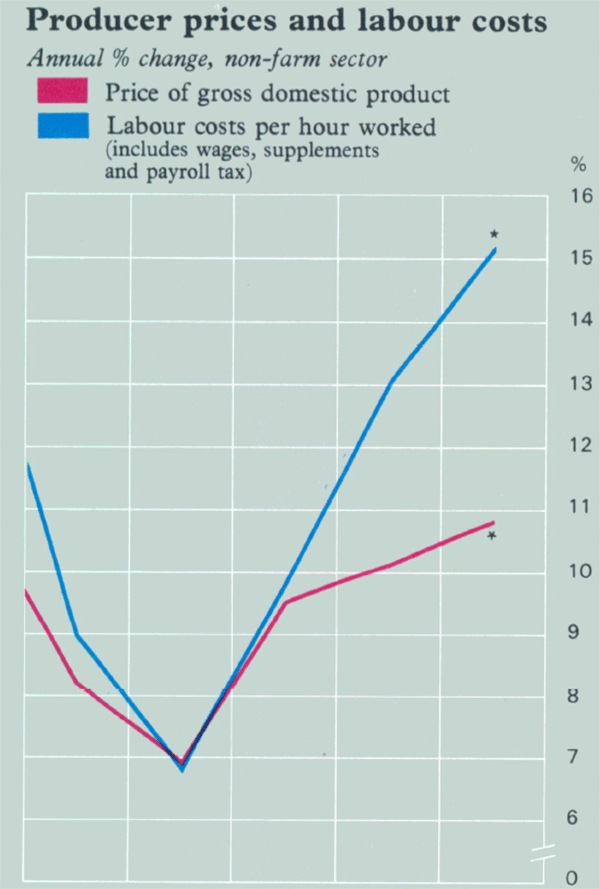
Average weekly earnings rose by around 13.5 per cent in 1981/82, much the same as in the previous year. However, late in 1981, after a lull following the abandonment of wage indexation, earnings began to grow at a substantially greater rate. A number of large wage settlements were reached, some involving reductions in standard hours of work. By the end of 1981 it appeared that these would spread quickly across the workforce and that leap-frogging of settlements might occur. However the pressure abated somewhat. The generally tight financial conditions and the weakening in the labour market no doubt played their part. The imminence of the National Wage Case may also have slowed the process down in the early months of 1982. In May, the Arbitration Commission declined to recognise that a community standard existed for award wage increases and continued a case-by-case approach pending further consideration.
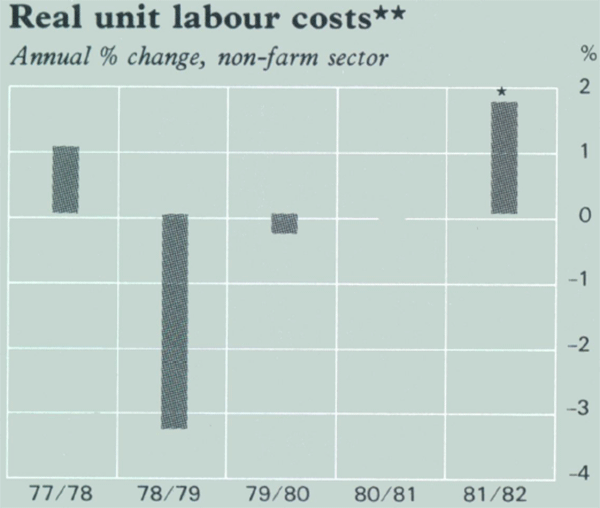
Following a material reduction in the average number of hours worked and, to a smaller extent, increases in rates of payroll tax in some states, labour costs grew more quickly than earnings. The increase in hourly labour costs in 1981/82 is estimated at 15 per cent, compared with 13 per cent in 1980/81. This surge in labour costs combined with the depressing effect on profits of lower activity, at first in the export sector, and then as the year progressed, in other sectors of the economy, reduced profit margins. The proportion of national income accounted for by the gross operating surplus of companies is estimated to have fallen by nearly 1.5 percentage points to a level lower than any in the last five years.
3. Domestic Finance
After a large expansion in 1980/81, the growth of primary liquidity slowed appreciably in 1981/82. Interest rates reached much higher levels than a year earlier and the free liquidity of the major trading banks was lower throughout the year than in the previous June quarter. The growth of conventional monetary aggregates slowed but there was less evidence that the pace of financial intermediation in general slowed.
Prices, Wages and The Labour Market
Liquidity
The growth of primary liquidity in 1981/82 was $686 million compared with $2,391 million in 1980/81. The principal reason for the slowing was the smaller budget deficit of $611 million compared with $1,127 million in 1980/81. The resulting reduction in liquidity was larger than the above comparison suggests because about $400 million of the 1981/82 budget deficit was accounted for by payments on 30 June 1982, which did not add to liquidity until 1982/83. There was also a smaller contribution to primary liquidity from Reserve Bank loans (mainly to dealers in the short-term money market); this amounted to –$222 million in 1981/82 compared with $264 million in 1980/81.
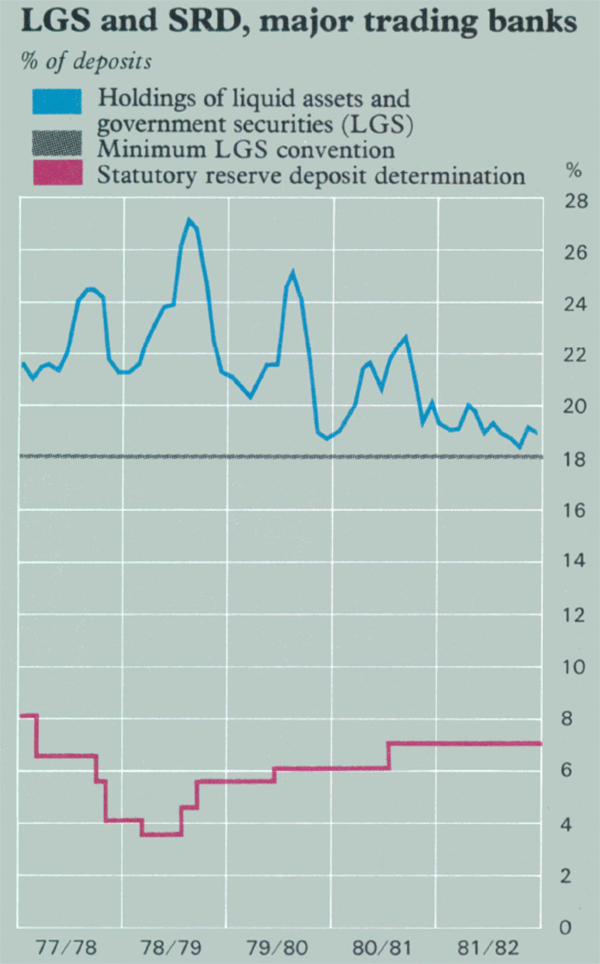
The pattern of liquidity growth through 1981/82 differed from that in previous years in that the build-up prior to the seasonal rundown was much smaller than usual. During this period, a large deficit on foreign exchange transactions held back liquidity growth and interest rates rose. On entering the June quarter with both the government and external current account subtracting from liquidity, very large inflows from abroad of private capital were needed to keep up the liquidity of the financial system. This was more so because banks entered the seasonal rundown with very small margins of free LGS assets, which caused them to compete quite strongly for deposit funds. In the event, there were very high inflows of capital from March onwards, and the financial system negotiated the seasonal rundown with minimal accommodation from the Bank. The fall in LGS holdings during the June quarter was also smaller than usual at $657 million, compared with an average fall of $1,437 million in the previous five years.
The average LGS ratio for the major trading banks during 1981/82 was 19.3 per cent compared with 21.0 per cent in 1980/81 and 21.8 per cent in 1979/80. Only in October did it exceed 20 per cent. De-regulation of bank deposit interest rates has enabled banks to operate with lower average margins of free LGS assets, relying on bidding in deposit funds to meet drains of liquidity. Improved access to funds from abroad contributed to the effectiveness of this approach to funds management by banks and others.
Private Interest Rates
Interest rates rose further in 1981/82. Despite the slowing in economic activity, the demand for short-term funds and for credit remained high. For much of the year interest rates in Australia exceeded those in most major financial centres abroad, which were themselves relatively high.
In the first half of the year, the combination of a strong demand for credit and a slowdown in the growth of primary liquidity put short-term interest rates under pressure. Although there was a seasonal reduction in the yield on 90-day bank bills from 16.0 per cent in June 1981 to 14.7 per cent in November, this reduction was smaller than usual. It was also short-lived; by January yields exceeded the levels reached in the previous June. Competition for funds intensified as the seasonal rundown approached and bill rates reached a peak of over 22 per cent in early April, about 5 percentage points higher than the 1980/81 peak.
Financial Indicators
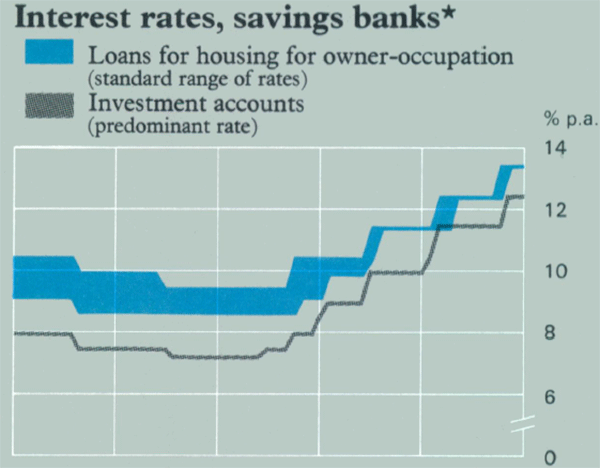
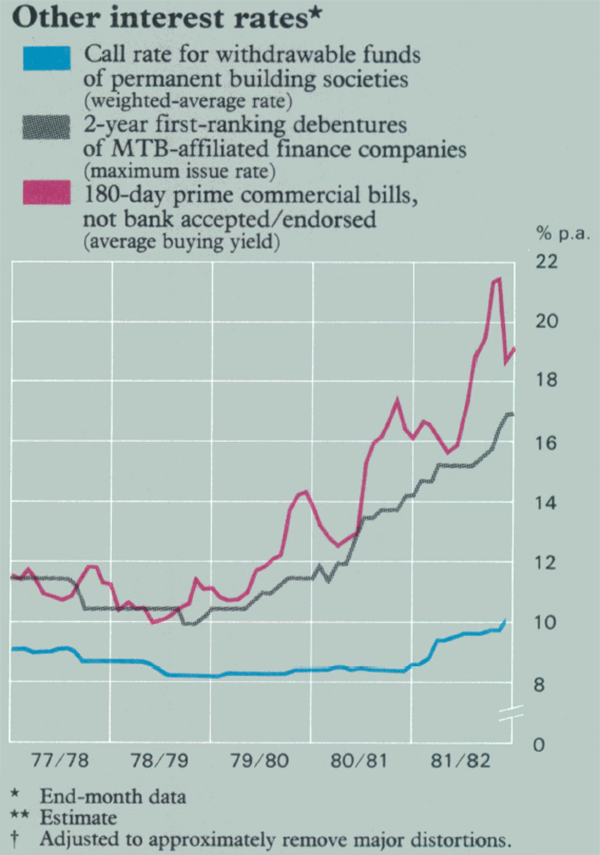
Longer-term private rates also moved upwards but not by as much as short rates. In the twelve months to June 1982, maximum rates offered by finance companies associated with major trading banks rose by 2.75 percentage points in the case of 2 year debentures and 2.25 percentage points in the case of 5 year debentures.
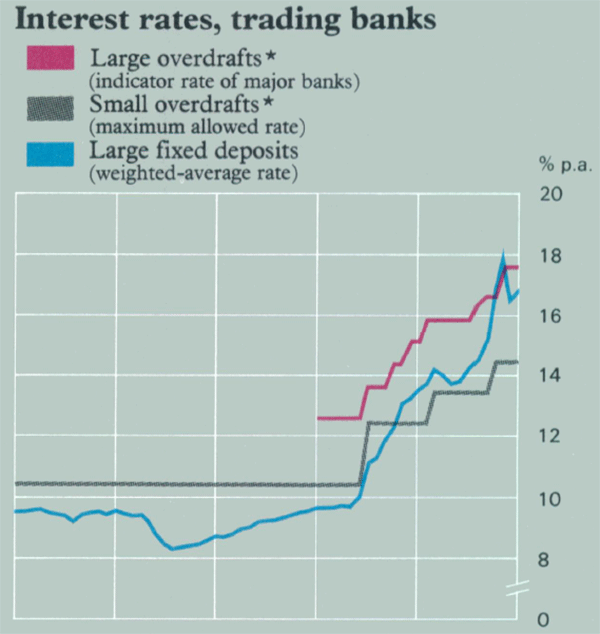
Banks and other financial intermediaries competed vigorously for deposits and interest rates rose sharply in the process. In June 1982, they were well above levels at the beginning of the year; for example rates on trading bank fixed deposits for terms of between 3 and 6 months rose by up to 3 percentage points and rates on certificates of deposit rose by 3.5 percentage points. Rates on savings bank investment accounts rose by up to 2.5 percentage points, and the introduction of statement accounts meant that the higher rates spread to savings banks' demand deposits. Permanent building societies increased rates on ordinary and term deposits, the latter rising by 3 percentage points. Existing financial institutions encountered strong competition from newly-emerging cash management trusts through which personal investors have been able to share more directly in the relatively high returns available on bills and other short-term assets.
Rates charged on loans by financial institutions also rose sharply during the year. An indicator of the rate on loans of over $100,000 by trading banks rose from 15.0 per cent in June 1981 to 17.5 per cent in June 1982. The rises in maximum rates on loans subject to interest rate ceilings are detailed in the Calendar of Official Actions.
Financial Intermediation
Trading bank deposits grew by 14.3 per cent in 1981/82, the same rate as in 1980/81. There was a slackening in deposit growth in the first half of the year when they grew by 8.7 per cent compared with 10.7 per cent a year earlier. The growth of deposits by major trading banks in 1981/82 was 13.5 per cent, while for other trading banks it was 20.1 per cent.
Advances outstanding by all trading banks (loans, advances and bills discounted) grew by $3,143 million, or 13.6 per cent in 1981/82, about the same growth rate as in 1980/81. Advances by the major trading banks grew by 12.1 per cent, compared with 12.4 per cent in 1980/81. Lending by other trading banks (mainly banks owned by State governments) increased by 22.8 per cent, compared with 15.4 per cent in 1980/81. The fastest growing categories of lending were leasing, personal instalment loans and bankcard. Overdraft limits of major trading banks were increased by $1,511 million in 1981/82 compared with $1,719 million in 1980/81; the overdraft usage ratio rose from 71.4 per cent at June 1981 to 74.1 per cent at June 1982. Bills outstanding against acceptance/endorsement limits and discount limits grew by 44 per cent in 1981/82 compared with 36 per cent a year earlier.
Savings bank deposits grew by 7.7 per cent in 1981/82, compared with 9.3 per cent in the previous year. Advances outstanding also grew more slowly at 11.0 per cent in 1981/82 compared with 12.5 per cent in 1980/81. The slowing in advances largely reflected slower lending for housing; advances outstanding for housing grew by 8.9 per cent compared with 10.2 per cent in 1980/81.
Borrowings from the public by building societies grew by 11 per cent in 1981/82 compared with 11.7 per cent in 1980/81. Some of the inflow of funds was used to build up liquidity from the low levels reached at the end of 1980/81; some of it represented short-term assets built up against volatile deposits obtained at relatively high rates of interest in competition with cash management trusts. As a result, although liquidity, as measured, was considerably higher in the second half of 1981/82 than a year earlier, it was not accompanied by a correspondingly enhanced level of mortgage lending. Housing loans outstanding grew by about 6 per cent in 1981/82 compared with 14.6 per cent in 1980/81.
Advances Outstanding
% change over year ending month shown
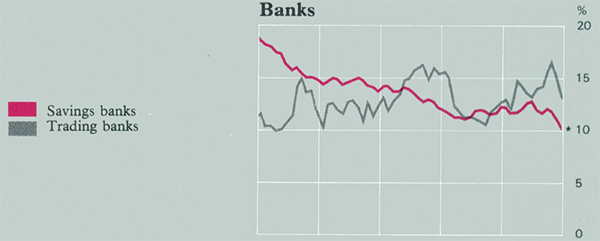
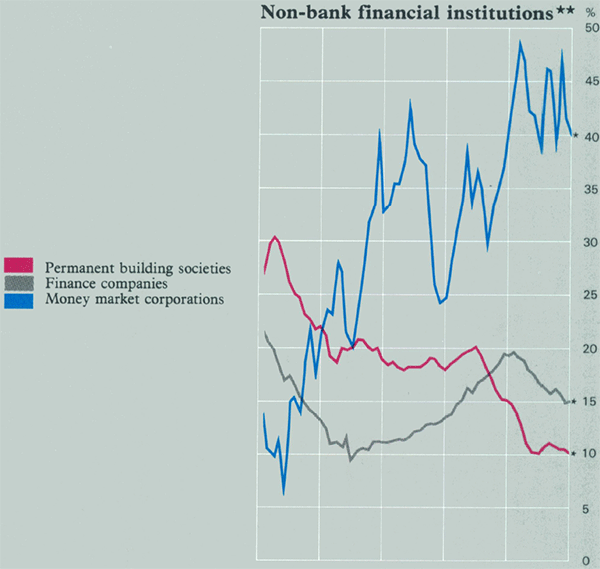
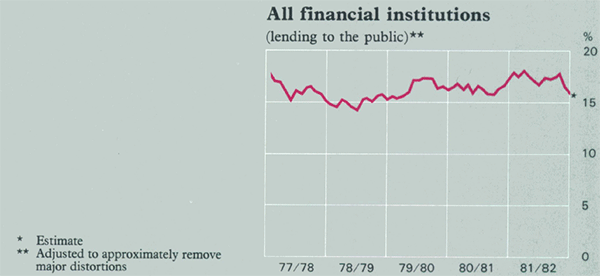
Lending and borrowing by finance companies slowed, particularly in the second half of the year. Borrowings from the public rose by about 13 per cent in 1981/82 compared with 19.1 per cent in 1980/81; the corresponding figures for lending were 15 per cent and 19.5 per cent. Money market corporations continued to grow at a rapid rate; their loans outstanding increased by around 41 per cent after growth of 42 per cent in the previous year. The assets of cash management trusts are estimated to have increased during 1981/82 by about $1.4 billion.
Monetary and Financial Aggregates
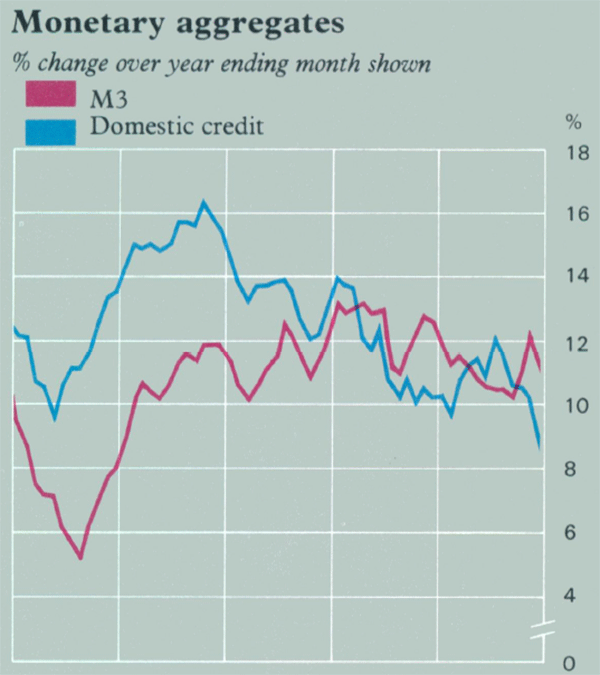
The growth rates of the conventional monetary aggregates – M1, M2 and M3 – declined in the twelve months to June 1982 compared with a year earlier. The decline was most marked for growth in M1, which slowed from 12 per cent to 1.6 per cent. The sharpness of the decline no doubt owed much to the public's desire to economise on current balances in a period of rising interest rates. Although the growth of M2 slowed – from 15.2 per cent to 13.9 per cent – it was the fastest growing of the conventional monetary aggregates. This probably reflected the public's preference for liquid interest-bearing instruments such as fixed deposits and certificates of deposit. The growth of M3, which fell from 12.7 per cent to 11.3 per cent was lower than for M2 because of the influence of slower growing savings bank deposits.
| 1978/79 | 1979/80 | 1980/81 | 1981/82 | |
|---|---|---|---|---|
| Foreign exchange transactions | −1,483 | −480 | 1,092 | 1,262 |
| Budget deficit | 3,478 | 2,034 | 1,127 | 611 |
| Other assets and liabilities of Reserve Bank | −461 | −401 | 101 | −550 |
| Miscellaneous factors | 198 | 16 | 70 | −637 |
| Private LGS | 1,731 | 1,168 | 2,391 | 686 |
| Loans and advances of banks of which: |
3,256 |
4,041 |
4,120 |
4,605 |
| all trading banks | 1,970 | 2,749 | 2,645 | 3,143 |
| all savings banks | 1,286 | 1,292 | 1,474 | 1,462 |
| Other assets and liabilities of banks (including SRD) | 359 | 912 | 251 | 872 |
| Less take-up of Commonwealth | ||||
| Government securities by non-bank private sector | 720 | 740 | 534 | −121 |
| Volume of money (M3) | 4,626 | 5,381 | 6,228 | 6,284 |
| percentage change | 11.8 | 12.3 | 12.7 | 11.3 |
Government Finance
Commonwealth budget deficit – sources of finance
Increase(+)/decrease(−) over year in holdings of Commonwealth Government securities
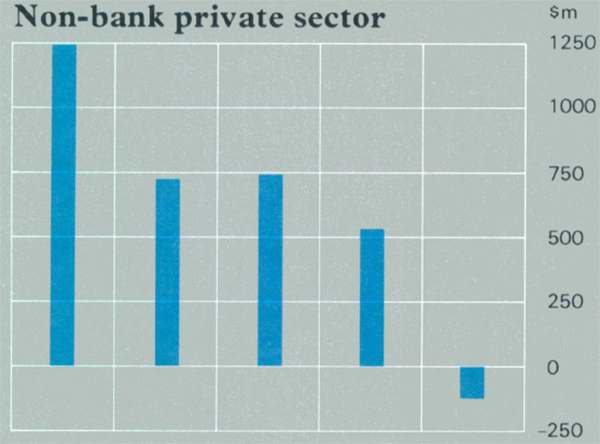
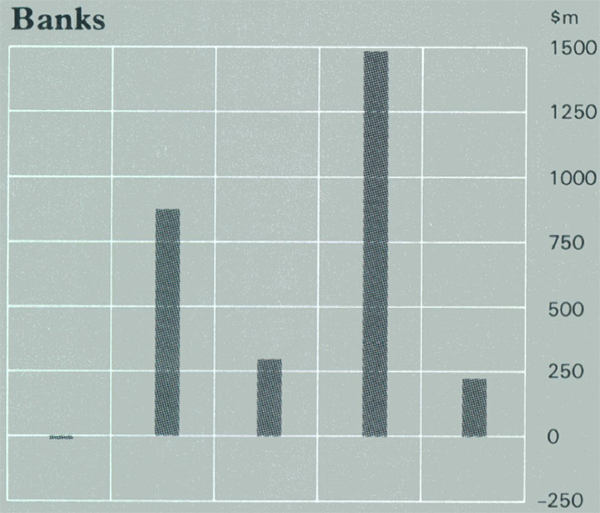
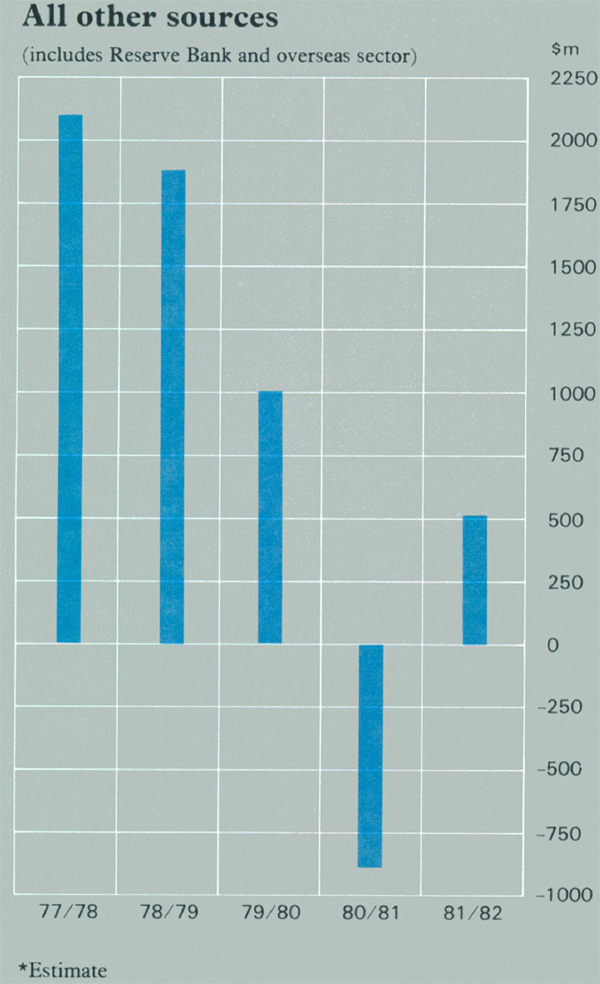
Non-bank private sector holdings of Commonwealth Govt securities
Increase(+)/decrease(−) quarter
Of the three large sets of financial institutions outside the banking sector – finance companies, permanent building societies and money market corporations – the growth of the balance sheets of the first two slowed, while the last was again strong. In the case of permanent building societies the slowing was in part the result of controls at the State level which limited their ability to compete for funds. In the case of finance companies, on the other hand, there was a slowing in the pace of intermediation. Despite the strong growth of money market corporations, growth in the balance sheets of non-bank financial institutions as a whole is estimated to have slowed slightly in 1981/82.
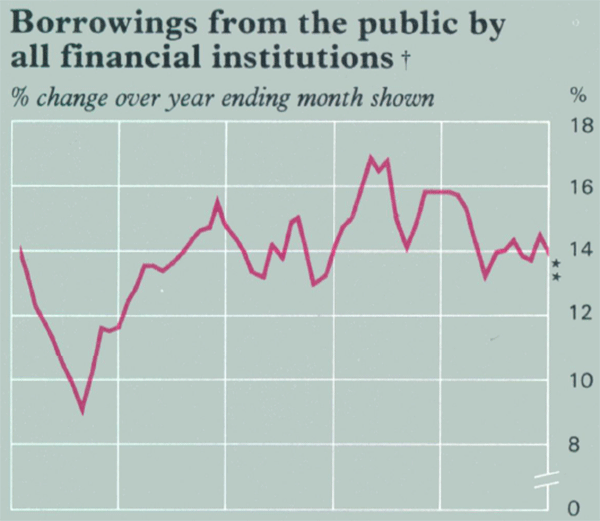
A measure which adds the borrowings from the public by non-bank financial institutions to deposits with banks is estimated to have grown by a little under 14 per cent in the twelve months to June 1982 compared with 15.8 per cent in the twelve months to June 1981.
Government Financing
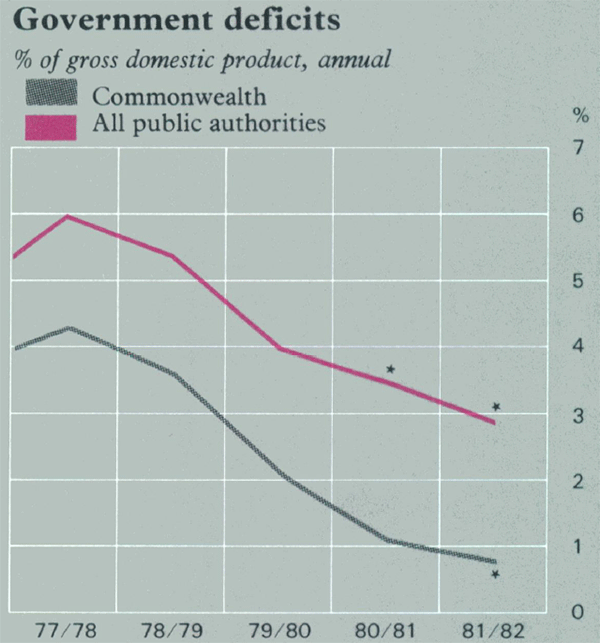
The deficit of the Commonwealth Government was $611 million in 1981/82. This compared with $1,127 million in 1980/81 and an estimate for 1981/82 at Budget time of $146 million. The overrun in the Budget deficit arose from slippages on the outlays side. Outlays were raised by higher than expected wage and salary increases in the public sector and by additional expenditures decided upon after the Budget. Revenue losses due to the failure to enact various sales taxes and lower than expected receipts from the crude oil levy were broadly offset by higher revenues elsewhere, particularly from PAYE tax.
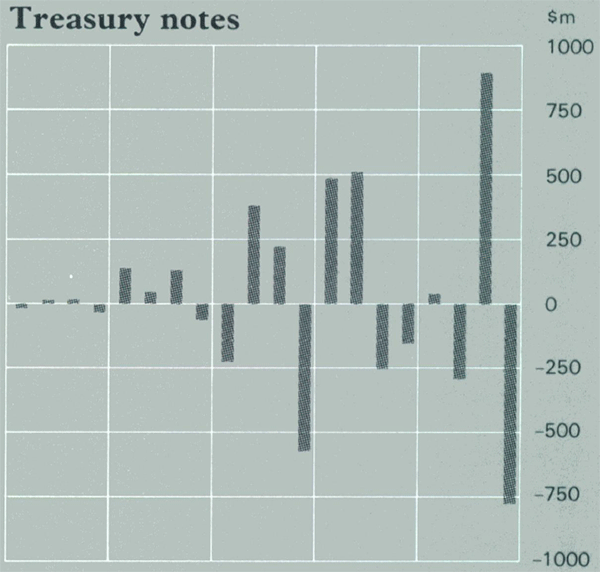
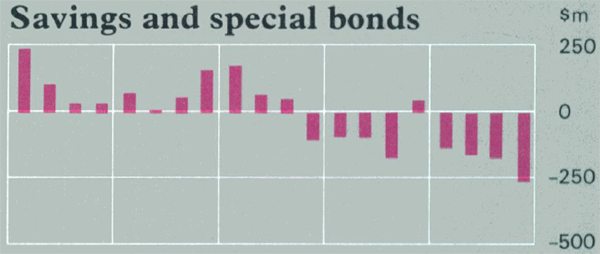
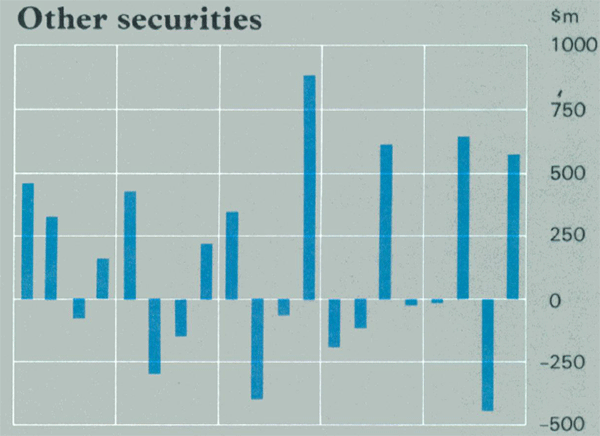
There was an increase in net overseas borrowing in 1981/82 to $368 million. In 1981/82 the Commonwealth Government ran down its outstanding Treasury bills at the Reserve Bank by $500 million and used cash balances to the extent of $151 million. Net sales of government securities in Australia were $216 million; $153 million was accounted for by Treasury notes and $788 million by Treasury bonds, but there were net redemptions of $725 million of Australian Savings Bonds and Special Bonds.
The deficit of the total public sector in 1981/82 was about $4,300 million compared with around $4,600 million in 1980/81. Borrowings under Loan Council programmes, including financing of infrastructure, rose by 6.5 per cent in 1981/82 compared with 12 per cent in 1980/81.
The Share Market
The share market fell sharply in 1981/82. The all-ordinaries index fell from 708 in June 1981 to 479 in June 1982, a decrease of 32 per cent. The earliest and the largest falls were in the resources group. This index peaked at 822 in November 1980, but had halved by February 1982; it fell further to finish the year at 348.
This situation was discouraging to equity issues which, after a year of substantial issues in 1980/81, slowed in 1981/82. Issues of fixed-interest securities were not common; shorter-term forms of finance, particularly promissory notes, were much used.
4. Supervision of Banks
The Banking Act contains provisions which put a duty on the Reserve Bank in relation to the protection of depositors of those banks which are subject to the Act (the provisions do not apply to State banks). The Bank also maintains a concern for the stability of the financial system. The statutory powers available to the Bank do not cover matters such as requirements for the capital positions of banks or the types of investments which banks (other than savings banks) may make. The Banking Act does, however, give the Reserve Bank powers to require statistical information from banks. In addition, there is the power to require trading banks to hold Statutory Reserve Deposits with the Reserve Bank. By agreement, trading banks also observe minimum liquidity ratios.
In recent years there has been a trend in most countries for banks' capital positions to weaken and for their risk exposure to increase. Inflation and the rapid expansion of lending, including international lending, have tended to push down banks' capital ratios. Increased variability in exchange rates and interest rates, imbalances in the matching of foreign currency assets and liabilities and the growing indebtedness of business and government have been among the factors adding to risk exposure. These developments have led supervisory authorities around the world to increase the attention given to prudential supervision of banks.
These influences have been felt, to some extent, in Australia. Group total assets (domestic and foreign) of the major banks increased at an annual rate of about 16 per cent over the ten years to 1981. Overseas assets now account for almost 25 per cent of total assets of the major trading banks compared with less than 15 per cent five years ago. There has also been strong growth in foreign exchange operations of banks' overseas offices.
Bank capital provides a protection for depositors in that it can absorb losses, and so help maintain viability under adverse conditions. It is not possible to summarise capital adequacy by a single measure, as it varies with factors such as earnings performance and risk exposure. Although the Reserve Bank has not indicated specific benchmarks for the capital gearing of banks, it keeps under review trends in a number of capital ratios for both the bank itself and the consolidated group. On most measures, the capital ratios of Australian banks, in common with those for banks in other countries, declined on average over the two decades through the mid 1970s. In more recent years Australian banks have raised substantial amounts of new capital, which, together with a high rate of retention of earnings, appears to have generally arrested the downward trend. Australian banks' capital ratios now generally compare favourably with those of banks in most major overseas countries.
Earnings are a first line of defence against adverse conditions and a source of fresh capital. In recent years earnings of Australian banks have been strong. A growing proportion of earnings is being derived from off-shore operations. Aggregate earnings of the major trading bank groups rose by about 30 per cent in 1980/81 and represented a return on average assets of about 0.9 per cent. As mentioned above, the bulk of earnings in recent years has been retained.
The quality and diversity of its loan portfolio are fundamental to the soundness of a bank. As regards loan loss experience, over the past two years (information has not been disclosed by banks for earlier years), write-offs averaged around 0.2 per cent of the major trading banks' loan portfolios; provisions for bad and doubtful debts were about 1.4 per cent. The major trading banks have domestic loan portfolios that are diversified both geographically and industrially. Australian banks' exposure to country risk arising from international lending by their off-shore offices is, at present, quite widely spread and does not appear to be unduly large relative to banks' resources.
The Reserve Bank's approach to bank supervision reflects both the legislative framework and its view that banks themselves have the prime responsibility for the prudent management of their businesses. The Bank's supervisory role has been directed mainly towards assessing whether individual banks' prudential standards are adequate and whether they are kept under review and adapted to changing circumstances. It looks for timely data regarding each bank's capital position, liquidity and earnings. Regard is paid not only to domestic operations, but also to the activities of a bank's overseas branches and subsidiaries, and of its major domestic associates engaged in financial intermediation, on a consolidated basis. In reviewing the consolidated position of a bank and its subsidiaries, the Reserve Bank is not undertaking a responsibility towards investors in those subsidiaries. Rather it seeks to satisfy itself as far as possible that if a subsidiary were to run into difficulties, the interests of the parent bank's depositors would not be prejudiced. This aspect is kept in view during the periodic discussions held with individual banks' managements.
5. The Report of the Committee of Inquiry into the Australian Financial System
The Final Report of the Committee of Inquiry into the Australian Financial System was released in November 1981. In the months that followed, the Bank – as did other official bodies and private financial institutions – gave considerable attention to the Report. The Bank has assessed the recommendations, both in its role as an advisor to the government (it has been a member of the Commonwealth Government's Task Force), and in its role in supervising and participating in financial markets.
The Bank is in broad agreement with the Committee's basic objectives of a less regulated, more open and competitive financial system, with adequate attention being paid to stability. By its nature the Report is concerned with the characteristics of a more efficient financial system, rather than the means of moving to the desired state; it is essentially a blueprint for a future financial system. The Bank, on the other hand, is concerned both with the merits of the recommendations, and with the feasibility and most efficient methods of introducing them.
The Bank has taken opportunities as they have arisen, both directly and through its advice to government, to move towards a less-closely regulated and more market-dependent system. These opportunities have arisen before and after the publication of the Report. Important modifications of policy introduced during the Committee's deliberations were changes in the methods of issuing Treasury notes in December 1979, and Commonwealth bonds in April 1980, and the abolition of maximum interest rates on term deposits with banks in December 1980. The Bank has also made it clear, in its testimony to the Committee and its advice to government, that in its view, policy should be aimed at putting an end to all regulation of interest rates paid and charged by financial intermediaries.
Since the Report was released there have been further changes. Restrictions on the maturity structure of bank deposits have been reduced. In May and June 1982, greater flexibility was introduced into the arrangements by which the Reserve Bank gives last resort loans to the authorised short term money market dealers and restraints on their portfolios were relaxed. In June the Bank also discontinued quantitative guidance on advances by trading banks. In late June, the Loan Council announced the introduction of a tender system for the issuing of Commonwealth bonds, its delegation to the Treasurer of the setting of the terms and conditions for Australian Savings Bonds, and the freeing of major electricity authorities from Loan Council controls in respect of their domestic borrowings.
Although these developments have gone some way towards a less regulated financial system, there is still in place a substantial body of regulation that has been questioned in the Committee's Report. It is true to say that the past year was not an opportune one for financial reform. A rising general level of interest rates has made the cost of the transition to a less-regulated system seem large, and has obscured the benefits. On the other hand, it has also shown up the distortions that arise from trying to control too tightly aspects of the financial system, particularly interest rates.
Reform is likely to be a more drawn out and uneven process than some might wish. For its part, however, the Bank will continue to work at devising improvements in the system, even though implementation may have to wait upon future suitable opportunities.
6. Other Institutional Developments
The Australian Bank Limited, which in February 1981 was granted unconditional authority to carry on banking business in Australia, commenced general banking operations in Melbourne in August 1981, and subsequently opened offices in Sydney and Perth.
Last year's Report noted planned mergers between the Bank of New South Wales and the Commercial Bank of Australia Ltd, and between the National Bank of Australasia Ltd and the Commercial Banking Company of Sydney Ltd. Following shareholder approval, the banks are in the process of integrating their businesses.
The first cash management trust was established in Australia in December 1980. In the course of 1981/82 a further twelve trusts were established, mostly managed by affiliates of money market corporations. Their combined assets had grown to more than $1.6 billion by June 1982.