Reserve Bank of Australia Annual Report – 1988 Economic Developments[†]
The major medium-term issue for Australia continues to be the need to correct the balance of payments deficit and the high level of international indebtedness.
The strategy for correction has had several elements.
Maintaining the improvement in Australia's international competitiveness has been crucial. Australia's cost structure had moved well out of line with those of our major trading partners. The depreciation of the Australian dollar had allowed correction of this misalignment. Tighter monetary and fiscal policies, together with an incomes policy which allowed falls in real wages, slowed the underlying rate of inflation, despite the boost to prices from the depreciation of the Australian dollar. Thus, the fall in the exchange rate was translated into a real improvement in competitiveness, most of which still remains, despite the recent appreciation of the Australian dollar.
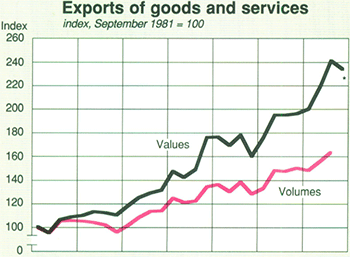
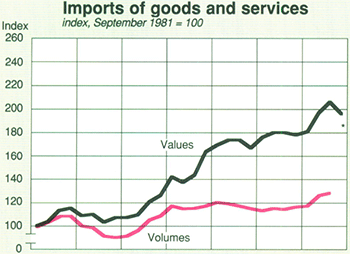
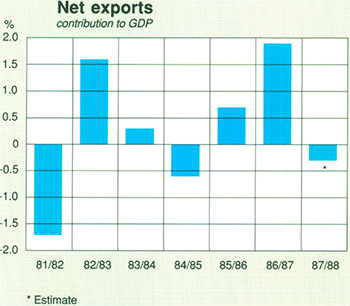
Together with slowing domestic demand, enhanced competitiveness has made an important contribution to improvements in Australia's trade performance over recent years. Between the beginning of 1984/85 and the end of 1986/87 the volume of imports fell by around 7 per cent. Over the same period, export volumes rose by almost 20 per cent. Export volumes have since continued to rise strongly but there has been a resurgence in import volumes, which grew even more strongly in 1987/88.
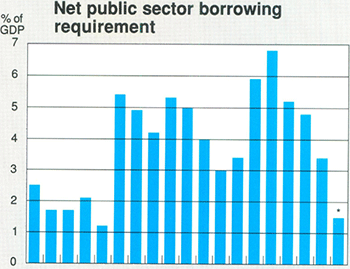
Reducing imbalances between domestic saving and borrowing was also crucial. Fiscal policy has made a major contribution to this aim — by helping to keep demand and inflationary pressures restrained and by reducing the public sector's calls on Australian savings, thereby lessening the need for recourse to overseas borrowings. After peaking at almost 7 per cent of GDP in 1983/84, the net public sector borrowing requirement was reduced to around 1½ per cent of GDP in 1987/88 and is expected to fall further in 1988/89. The current account deficit has fallen too, but not as sharply — from a peak of 6¼ per cent of GDP in 1985/86 to 4 per cent of GDP in 1987/88. Part of the explanation for the slower correction of the current account deficit is a net reduction in private sector savings. Although the household component of private sector savings has risen slightly in recent years, it has been more than offset by higher corporate borrowing. As a result, the fall in the PSBR has not been fully reflected in corresponding falls in overseas borrowing and the current account deficit.
Despite the evidence of a further reduction in the current account deficit in 1987/88, there were some signs that the pace of underlying adjustment was not proceeding as in the previous two years. The reduction in the deficit in 1987/88 was due to a sharp rise in commodity prices and a consequent improvement in the terms of trade; the fall in import volumes was reversed.
The following paragraphs provide further details of developments in 1987/88.
The international economy
The collapse in share prices in October 1987 was widely expected to lead to slower growth in the world economy. In the event, it appears that, after some hesitation, the pace of activity was hardly affected. Rates of inflation remained relatively low in 1987/88 and there were signs of some modest improvement in the major international imbalances. This relatively favourable outcome reflected, in part, complementary adjustments to economic policy in the major countries. Nevertheless, imbalances remain large and are a source of considerable uncertainty for the economic outlook. The debt problems facing the developing countries also remain a major concern.
Economic policy
The slow pace of correction of external imbalances evident during 1987 meant that the Louvre goal of exchange rate stability relied heavily on monetary policy and foreign exchange market intervention by central banks. This, plus some concerns about inflation, led to a gradual tightening in U.S. monetary policy, causing U.S. interest rates to rise. Elsewhere, rapid growth in the monetary aggregates in Japan and West Germany, with the attendant risk of an upsurge in inflation, caused some tightening of policy in those countries.
It was against this uncertain background that the rapid rises in share prices in many countries were sharply reversed.
Following the stock-market crash, the monetary authorities in major countries moved quickly to calm financial markets. The U.S. Federal Reserve, for example, reaffirmed “its readiness to serve as a source of liquidity to support the economic and financial system”. As the effects of the crash dissipated, the authorities were less accommodating in supporting system liquidity, but at the end of 1987/88 interest rates were around levels prevailing shortly before the collapse in share prices.
Fiscal policy developments during 1987/88 were generally consistent with a reduction in external imbalances. In the United States, the Administration and Congress reached agreement in November on a package of measures to reduce the budget deficit by US$34 billion in fiscal 1988. The Administration's Budget for fiscal 1989 proposed a budget deficit of US$130 billion which is a little below the target set by the Gramm-Rudman-Hollings Balanced Budget Act. Policies in Japan and West Germany were relatively expansionary. In Japan, as part of the major fiscal package announced in May 1987, a number of supplementary measures were enacted in the second half of 1987. In West Germany, a number of modest fiscal measures were proposed in December 1987 and income tax cuts came into effect at the start of 1988.
11 International Imbalances
12 Australia and the OECD
Economic activity
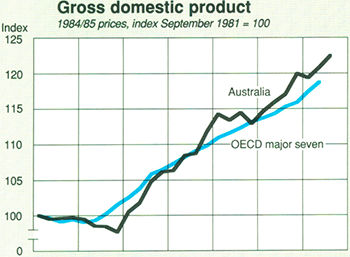
Real GDP in the OECD area is estimated to have grown by 3½ per cent in 1987/88, following an increase of 2½ per cent in 1986/87. Changes in the pattern of growth in domestic demand should encourage the reduction of external imbalances — domestic demand grew strongly in Japan but only moderately in the United States. The buoyant level of activity during the year was partly due to the strong momentum of growth which built up in the period before the fall in share prices in October 1987 and to the fact that business and consumer confidence appears to have emerged relatively unscathed from the events in October. The generally easier stance of monetary policy for much of the year in major economies was also important.
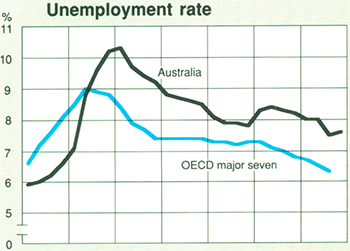
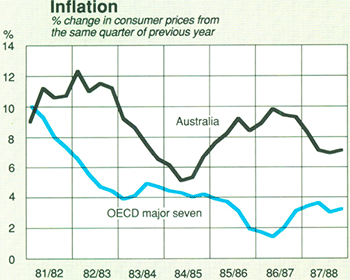
Rates of inflation picked up slightly in the first half of 1987/88 but, in general, remained below those of the early 1980s; rates were particularly low in Japan and West Germany. In the year to June 1988, consumer prices in the major OECD countries rose by about 3 per cent, compared with an increase of 2.8 per cent in the year to June 1987.
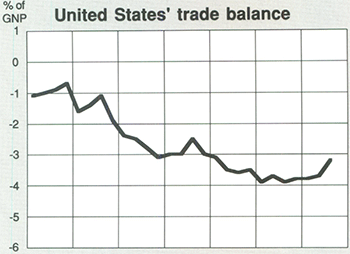
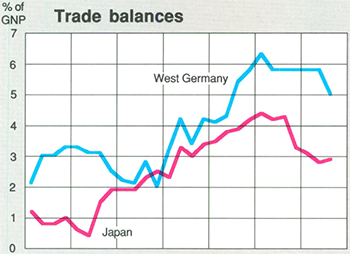
External imbalances remained large in 1987/88. The current account deficit of the United States was estimated at about US$160 billion (3½ per cent of GNP), compared with US$153 billion (also 3½ per cent of GNP) in 1986/87. The 1987/88 result conceals both a further improvement in volume terms and some reduction in nominal terms during the second half of the year. The chief counterpart to the U.S. deficit remained the very large surpluses of Japan and West Germany (some US$132 billion); the combined surplus of the rapidly growing newly industrialised countries in Asia also remained large.
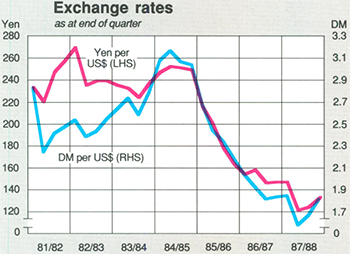
Exchange rate movements among major currencies during the year were largely in response to external developments. Continued large U.S. trade deficits and the slow pace of negotiations on measures to reduce the U.S. budget deficit caused the U.S. dollar to fall sharply in the latter part of 1987. Signs of an improvement in the U.S. external position were associated with greater stability in exchange rates and then a strengthening in the U.S. dollar towards the middle of 1988.
Developing countries
The combined current account position of the developing world moved into surplus in 1987 for the first time since 1980, as commodity prices recovered and policies kept domestic demand restrained. Nevertheless, the developing countries continued to experience difficulties in restoring access to financial markets and in promoting development. Growth in their economies slowed and there were signs that adjustment efforts were flagging as inflation picked up sharply and budget deficits remained large.
Economic conditions in Australia
Indicators of economic activity
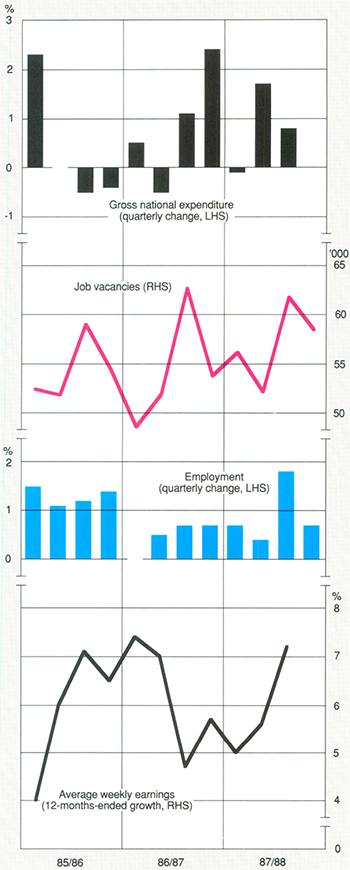
Real GDP rose by an estimated 3¾ per cent in 1987/88. In sharp contrast to the previous year, growth was largely due to domestic demand.
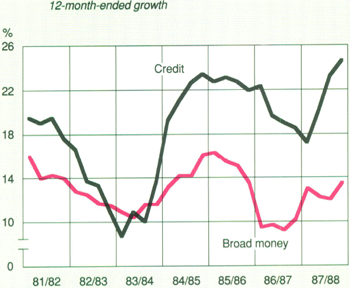
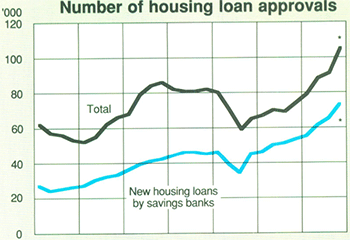
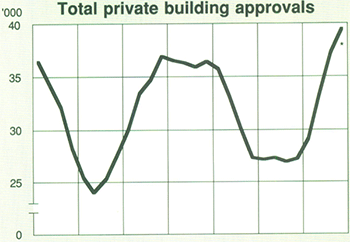
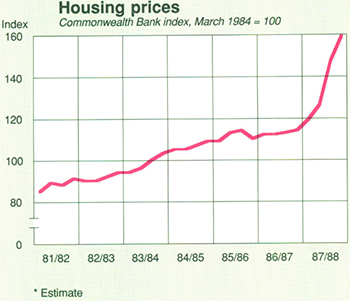
Private consumption rebounded strongly after being particularly weak in 1986/87. Dwelling investment also recovered strongly from the subdued levels of the previous year. Housing activity was boosted by falls in interest rates for housing finance, the effects of strong pent-up demand for new housing and changes to tax treatment of investment in rental housing. Supply bottlenecks, particularly of skilled labour, arose in the construction industry. Shortages in the housing sector were accentuated by the call on resources for non-dwelling construction, which accounted for the bulk of the solid growth in business fixed investment. Spending on plant and equipment also grew throughout most of the year. Consistent with the decline in interest rates and the pick-up in activity, growth of monetary and credit aggregates was higher, on average, in 1987/88 than in the previous year. Over the year to June, broad money grew by 13.4 per cent, while credit (lending by intermediaries plus bank bills held outside intermediaries) increased by 24.6 per cent.
13 Domestic Indicators
14 Financial Aggregates
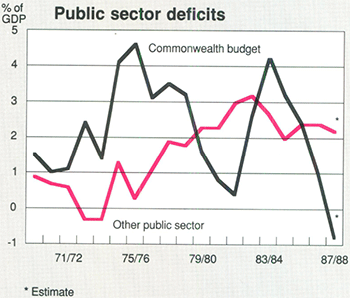
Public sector demand did not boost growth in 1987/88. The net public sector borrowing requirement (PSBR) of all levels of government combined fell further in 1987/88, to below 2 per cent of GDP. The Commonwealth budget moved from a deficit of around 1 per cent of GDP in 1986/87 to a surplus of three quarters of one per cent in 1987/88 but the deficit of the states and local authorities was little changed as a ratio to GDP.
Decisions reached at the Loan Council Meeting in May 1988 are expected to constrain the net borrowing requirement of the State and local sector in 1988/89. The Government also announced in May that Commonwealth outlays were expected to fall further in real terms in 1988/89 and that the Commonwealth Budget surplus was expected to exceed $3 billion in 1988/89.
Labour market
After slowing in the December quarter, employment growth strengthened markedly in the second half of 1987/88, giving a rise over the year to the June quarter of 3.5 per cent. This compared with growth of around 2 per cent over 1986/87 and 5 per cent over 1985/86. Over those three years, growth of employment in Australia was stronger than in any other OECD country.
Although the participation rate rose, growth in employment through the year exceeded that of the labour force, and the unemployment rate fell. The rate of unemployment was 7.6 per cent in the June quarter 1988, compared with 8.2 per cent in the June quarter 1987, and was the lowest since the September quarter 1982.
Prices and wages
Australia's rate of inflation declined more slowly than had been expected in 1987/88, partly because of the strength of demand. It remains above those of our major trading partners, although the gap has narrowed over the past year. The consumer price index rose by 7.1 per cent in the year to the June quarter 1988.
15 Public Sector
Over the twelve months to the March quarter 1988, average weekly earnings rose by 7.2 per cent and ordinary-time earnings by 6.8 per cent. Movements in wages mainly reflected awards under the “two-tier” wage setting arrangements of March 1987. The Arbitration Commission awarded a “first-tier” wage increase of $6 per week to all wage and salary earners (equivalent to 1.3 per cent of ordinary-time earnings) in February 1988. Around 50 per cent of wage and salary earners also received a “second-tier” rise in 1987/88. The majority of these rises were for 4 per cent and involved cost and productivity offsets.
The rural sector
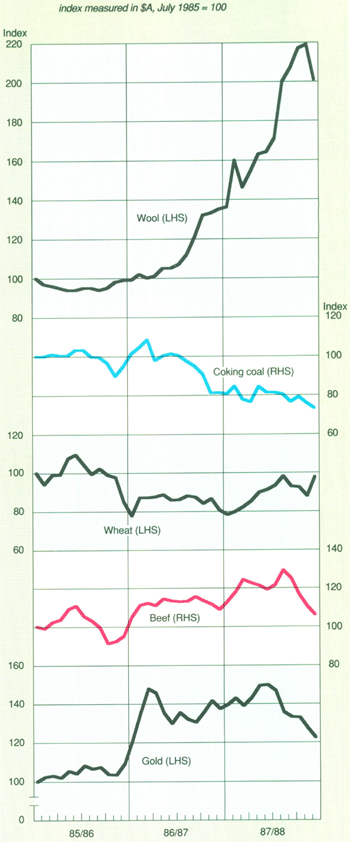
The recovery in the rural sector gathered momentum during 1987/88 adding to incomes throughout the economy. Driven by sizeable increases in some commodity prices, the net value of rural production increased by about 65 per cent. Wool prices showed the biggest increase to reach a record high, while meat and wheat prices also rose. Sugar prices rose sharply during the year. The picture on volumes was mixed, with strong increases in production of wool and meat more than offset by a fall in wheat production. The Bureau of Agricultural and Resource Economics expects a further improvement in 1988/89 with further rises in prices and higher crop and wool production. Despite these expected rises in production, stock levels for wool and wheat are projected to remain at near record lows, constraining the ability of exporters to meet demand for their products.
16 Housing
17 Commodity Prices
18 Commodity Prices and the Terms of Trade
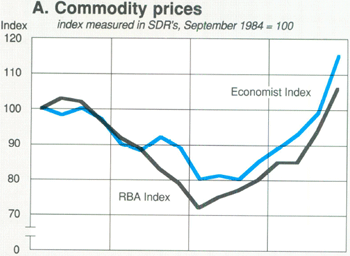
Prices of many commodities fell sharply over 1985 and 1986, though they have since recovered. Graph A shows movements in the commodity price indices published by “The Economist” and the Reserve Bank of Australia. “The Economist” index is widely quoted overseas, but its composition reflects world trade rather than Australia's trade. The index compiled by the Bank reflects movements in prices of commodities important to Australia's export revenue. The indices are measured in terms of IMF Special Drawing Rights (SDR's), a unit of account that abstracts from the effects of movements in exchange rates.
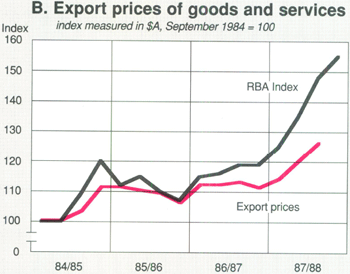
The prices Australian exporters actually receive depend on movements in the Australian dollar exchange rate. Graph B converts the RBA index shown in Graph A into Australian dollars. The depreciation of the Australian dollar over 1985 and 1986 offset some of the effects of the fall in commodity prices while, more recently, appreciation of the $A has limited the rise in prices. Only around two thirds of Australia's exports of goods and services are “commodities”. As well, there are lags between changes in prices quoted in “spot” markets and those actually received by exporters. Nevertheless, Graph B shows that prices received by Australia's exporters of goods and services tend to follow movements in the index of commodity prices.
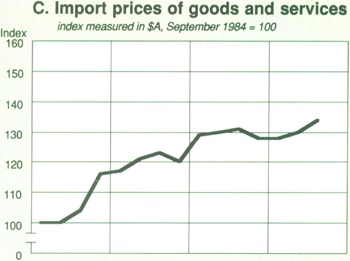
Graph C shows movements in Australia's import prices. Because they are measured in Australian dollars, they were substantially increased by the depreciation of the Australian dollar over 1985 and 1986.
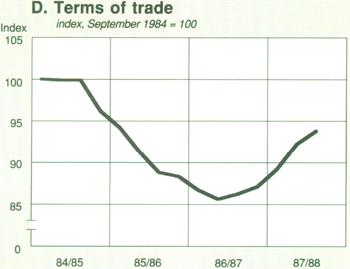
Graph D shows Australia's terms of trade which is the ratio of export prices to import prices (the series shown in Graphs B and C). Between mid 1984/85 and mid 1986/87, Australia's terms of trade fell sharply as import prices rose more rapidly than export prices. As noted above, both import and export prices were boosted by the depreciation of the Australian dollar, but the rise in export prices was dampened by low prices in world markets (see Graph A). More recently, stronger commodity prices on world markets have led to a sharp improvement in Australia's terms of trade.
Balance of payments and external debt
A large rise in Australia's terms of trade led to a strong improvement in the current account in 1987/88. Import volumes, however, grew more quickly than exports. The current account deficit fell to $11½ billion, about 4 per cent of GDP, from $13.2 billion (5 per cent of GDP) in 1986/87.
Despite the rise in Australia's exchange rate, the Reserve Bank's export commodity price index (in Australian currency) rose by almost 30 per cent over the year to June. This largely reflected a sharp rise in wool prices, which doubled in 18 months, as well as some strengthening in base metal prices. As a consequence, average prices of exports of goods and services in 1987/88 were more than 8 per cent higher than in 1986/87 and the terms of trade rose by about 8 per cent.
The volume of exports of goods and services rose by about 7 per cent. Non-rural exports grew strongly — large increases were recorded in shipments of gold, oil, coal, iron ore and aluminium and manufactured goods. Rural exports fell a little. Exports of meat increased but were more than offset by reduced exports of cereals and wool.
The volume of imports of goods and services rose by about 9 per cent in the year. Import prices increased by only about 1 per cent, largely because of the strengthening Australian dollar and low inflation abroad.
Australia's receipts from services continued to respond positively to improved competitiveness and the net services deficit fell. In contrast, the deficit on property income rose, mainly because interest payments rose with external debt. Net interest payments represented about 17 per cent of income from exports of goods and services, compared with 18 per cent in 1986/87.
As in the past few years, the greater part of capital inflow took the form of private sector borrowings. Gross external debt rose by an estimated $10 billion in 1987/88 to total $115 billion (39 per cent of GDP) in June 1988. After deducting Australia's overseas reserves and Australian lending abroad, net external debt was an estimated $89 billion in June 1988. Largely as a result of the appreciation of the Australian dollar, net external debt fell to around 30 per cent of GDP compared with 32 per cent a year earlier.
Australia's international reserves totalled $20.2 billion at end June 1988, compared with $17.6 billion at the close of 1986/87. In SDR terms, reserves rose by SDR 2.3 billion over the year, to SDR 12.2 billion at end June.
19 External Sector
Footnote
Figures in this chapter include estimates based on data available at the time of writing.. [†]