Reserve Bank of Australia Annual Report – 1993 Financial Markets
Developments in Financial Markets
The dominant influence on Australian financial markets during the past year was the changing but generally pessimistic outlook for the world economy and commodity prices. This maintained softness in the exchange rate, except in the March quarter when a period of confidence in the US economy helped temporarily to lift the outlook for the world economy. Against this background, interest rates tended to decline around the world, punctuated by some short-lived rises when a number of countries sought to defend their currencies.
Interest rates in Australia declined modestly – and unevenly – over the year. Concerns about fiscal policy prior to the August 1992 Budget, political uncertainties in the run-up to the March 1993 election, and sporadic weakness in the exchange rate caused periods of nervousness in the bond market and interrupted the downward trend in yields. The short end, too, exhibited considerable volatility at times as market participants tried to anticipate policy responses to economic events.
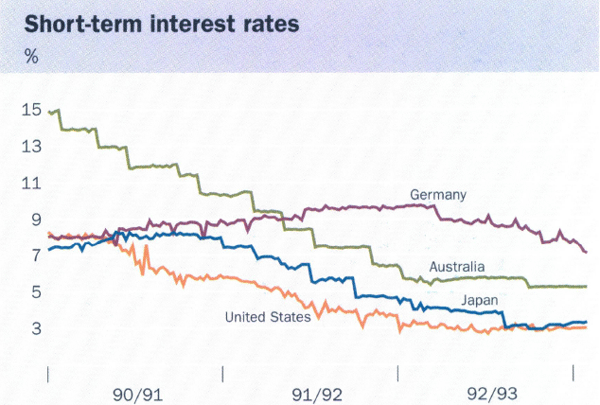
In many ways, however, Australian markets were relatively calm compared with markets elsewhere. While interest rates in all industrial countries fell over the year as a whole, large rises were recorded in many countries in the second half of 1992 when the European Monetary System came under strain. This produced a generally uncertain exchange rate environment which, together with downward revisions to world growth forecasts, spread the pressures to other currencies. Both Canada and New Zealand, whose currencies are often viewed similarly to the Australian dollar, raised official interest rates during this period.
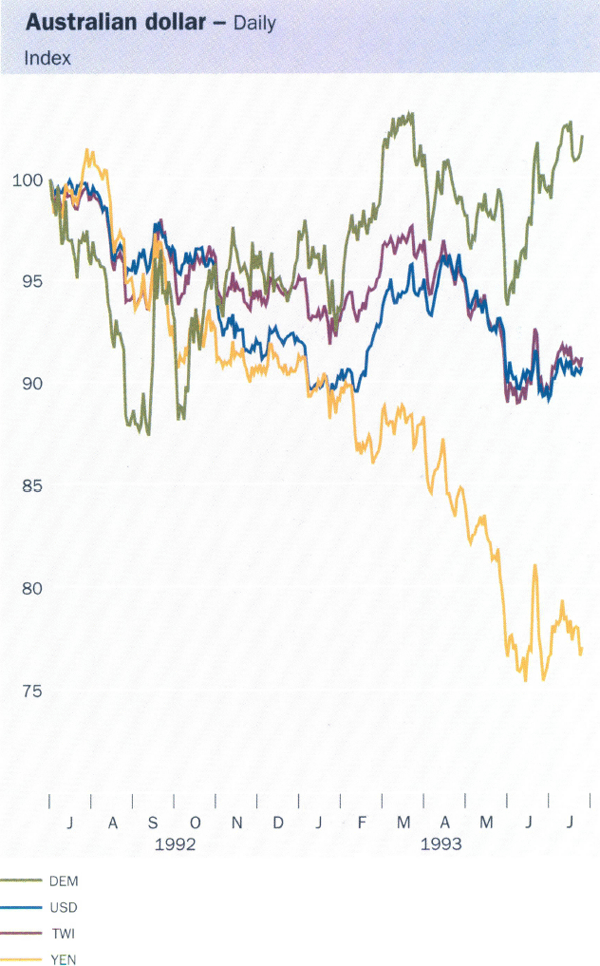
The Australian dollar depreciated by about 10 per cent (in trade-weighted terms) over 1992/93, following a fall of about 8 per cent during the previous year. It also fell by 10 per cent against the US dollar, from US74.9 cents to US67.2 cents. The fall against the yen was much larger (24 per cent), reflecting the general strength of the yen in world markets; it was relatively steady against European currencies.
The fall in the Australian dollar was concentrated in two main episodes. The first was in August when, against a weaker outlook for the world economy, uncertainty about the Government's fiscal policy saw the trade-weighted index fall by nearly 7 per cent compared with its level at end June 1992. The second period of weakness occurred in May when expectations about growth in the global economy and commodity prices were again lowered. Publication of two large monthly current account deficits around this time was also a contributing factor, highlighting the market's perception of the constraints imposed by the weak world economy. The trade-weighted index fell to just above 49 at one stage and remained in the range 49–51 for much of the remainder of the year.
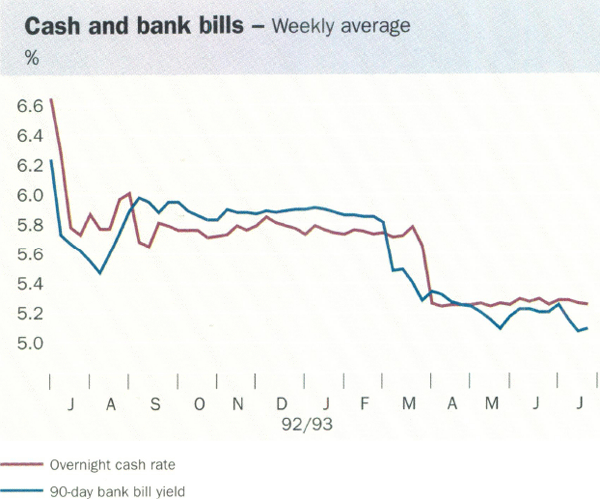
With cash rates falling by 1.25 percentage points over the year, short-term security yields fell by a similar amount. The relationship between cash rates and security yields, however, fluctuated during the year in line with expectations about monetary policy. At the start of the year, short-term security yields fell below the prevailing cash rate, even after the cash rate was reduced early in July. By August, however, the weakness in the exchange rate had dispelled expectations of further easings; security yields moved to a premium over cash rates as markets began to price in the possibility of a tightening. This position persisted until February when the exchange rate recovered somewhat, again raising expectations of an easing. After the easing in March, short-term security yields traded broadly in line with cash rates for the remainder of the year.
In aggregate, the reductions in short-term interest rates in Australia in 1992/93 were larger than in the United States, where rates fell by 0.5 of a percentage point over the year, but about the same as in Japan and Canada (see table). Like Australia, these countries moved into recession relatively early and made most of their reductions in interest rates earlier in the cycle. The European countries were later into the economic and monetary policy cycle, and had been constrained by their links to Germany, which was still confronting a persistent inflation problem. For these countries 1992/93 was the first year of falling interest rates and, as usual, the falls tended to be quite large – generally in the order of 2–4 per cent. The average level of interest rates in Europe, however, is still well above that in other countries.
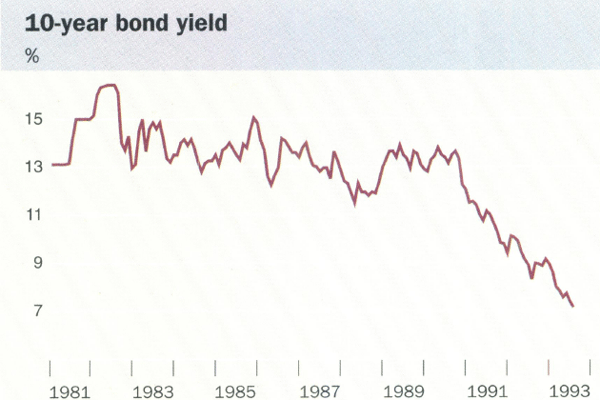
At the long end, yields in Australia fell by 1.5 percentage points over the year, from just under 9 per cent to 7.4 per cent. This was a little more than the fall in cash rates and brought the fall in yields on 10-year bonds to more than 6 percentage points since the downward trend commenced in late 1990.
|
Country |
3-month rates (Percentage points) |
Long bond yields (Percentage points) |
Trade-weighted exchange rate (Per cent) |
|---|---|---|---|
| United States | −0.6 | −1.4 | 7 |
| Japan | −1.3 | −1.2 | 30 |
| Germany | −2.2 | −1.4 | 1 |
| France | −3.2 | −2.1 | 2 |
| United Kingdom | −4.2 | −1.5 | −13 |
| Italy | −3.6 | −1.7 | −17 |
| Canada | −1.0 | −0.9 | −5 |
| Australia | −1.0 | −1.5 | −10 |
| Austria | −2.7 | −1.7 | 2 |
| Belgium | −2.9 | −2.0 | 1 |
| Denmark | −2.8 | −2.4 | 4 |
| Finland | −6.5 | −2.4 | −15 |
| Netherlands | −2.7 | −1.9 | 2 |
| New Zealand | −0.3 | −1.2 | 1 |
| Norway | −4.1 | −2.9 | −3 |
| Spain | −1.8 | −1.7 | −17 |
| Sweden | −3.2 | −1.6 | −19 |
| Switzerland | −4.0 | −2.4 | 3 |
|
Source: Datastream and Reuters |
|||
The Bank's Market Operations
Difficult foreign exchange market conditions meant that the Bank was again active, making net market purchases of Australian dollars (of $10.4 billion) in 1992/93. About three-quarters of this intervention occurred in the first half of the financial year, with the heaviest intervention in August. At that stage, the currency had already fallen by 15 per cent (over the previous 12 months) and a further sharp fall would have threatened both price stability and confidence in policy more generally. The Bank was active through much of the remainder of 1992, seeking to provide a steadying influence at a time of considerable turbulence in world foreign exchange markets. In contrast to most other countries, the Bank chose to rely on intervention, rather than on a combination of intervention and interest rate increases.
In the second half of the financial year, the Bank's operations were lighter. Apart from a brief period of instability in January, market conditions were fairly stable through to about April. In February and March in particular, the improvement in market sentiment was sufficient to allow the Bank to withdraw from the market. Pressures re-emerged during May and June but these were met with intervention on a smaller scale than that undertaken earlier in the financial year, partly because a portion of the fall in the trade-weighted index at this time reflected an appreciation of the yen against all currencies, rather than problems specific to the Australian dollar.
Central banks in many countries intervened heavily in their foreign exchange markets during the year. In particular, the exchange rate pressures in Europe in September, and the sharp upward realignment of the yen from February 1993, elicited strong responses, by way of intervention and, in many cases, interest rate rises, from relevant central banks. This general tendency for central banks to try to moderate swings in their exchange rates is hardly surprising, given the potential for large and sudden changes to throw monetary policy off-track and undermine confidence. It illustrates the practical point that no central bank, whether overseeing fixed or floating rate regimes, can afford the luxury of having a completely “hands-off” approach to its exchange rate.
Over the past two years the Bank has intervened heavily at times, not because it believes it knows better than the market what the rate should be but because it makes sense to be cautious about large shifts in the exchange rate, particularly given the frequent tendency for markets to “overshoot” in the short term. The Bank's intervention clearly has not prevented a substantial drop in the exchange rate, nor was that the intention. This approach, however, has meant that the recent exchange rate adjustments have occurred in a much calmer climate than was the case in the mid 1980s, when the adjustments were larger than could be explained readily by economic “fundamentals”.
The Bank's foreign exchange operations are linked closely with the domestic operations it undertakes for monetary management. Purchases of Australian dollars (ie sales of foreign exchange) by the Bank operate to deplete the cash base of the financial system when those Australian dollars are delivered to the Bank. This requires the Bank to undertake offsetting operations in domestic securities markets to avoid a sharp tightening in financial conditions. In the past, the Bank's domestic operations have been conducted almost exclusively in Commonwealth Government securities (CGS) but in recent years foreign exchange swaps also have been used to manage domestic conditions. At times of heavy foreign exchange intervention, it has been more convenient to manage the domestic liquidity impact through the swap market, than through domestic operations in CGS, because turnover in the swap market is much greater than that in domestic securities markets. Some overseas central banks use foreign exchange swaps as their main, or exclusive, means of managing domestic liquidity.
The use of swaps also gives the Bank greater scope to manage the composition of its balance sheet as between domestic and foreign assets. Over the late 1980s and early 1990s, steady purchases of foreign exchange by the Bank (directed at the time towards limiting the rise in the exchange rate) were offset in large measure by sales of CGS. This produced a quite uneven balance sheet, with holdings of CGS falling to low levels and foreign currency assets and gold rising to over 80 per cent of the total, a higher proportion than was either necessary or desirable over the long run.
About half the foreign currency sold since late 1991 is still in the Bank's portfolio and is funded through the swap market. At the end of June, the Bank had a net commitment under swap agreements to deliver $8.5 billion in foreign currency, up from $2.0 billion a year earlier. This commitment does not involve any foreign exchange risk for the Bank, as the price at which currencies were exchanged outright has already been set and is not affected by the timing of final delivery. These swaps fall due at various times during the coming financial year; decisions, based on commercial and policy considerations, will be made as the swaps mature about whether they should be rolled over or retired.
To the extent that foreign exchange sales are not funded through the swap market, they are offset by purchases of CGS. In buying CGS, the Bank has a choice of outright purchases of short-term securities, outright purchases of long-term securities or repurchase agreements. Decisions about which securities to buy are reached mainly on the basis of what is considered best for the liquidity management of the financial system. A factor here is the estimated length of time for which funds need to be added to the system. Purchases of short-term securities, or securities under repurchase agreements, add funds to the money market for relatively short periods. Where funds need to be added on a longer-term basis, purchases of long-term securities may be more suitable.
Over the past year, the Bank's transactions in CGS involved purchases of about $82 billion and sales of about $72 billion. The bulk of these transactions was for short terms to smooth out day-to-day fluctuations in market liquidity. In net terms, the Bank bought $5½ billion of Treasury notes while transactions in repurchase agreements resulted in net purchases of $1½ billion. Net purchases of long-term bonds amounted to about $3 billion.
Interest Rates of Financial Intermediaries
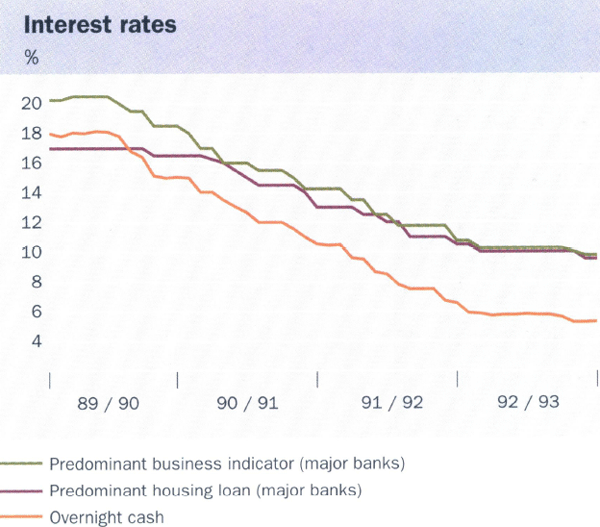
The two reductions (aggregating to 1.25 percentage points) in overnight cash rates – the foundation of the short-term interest rate structure – were reflected broadly in banks' borrowing and lending rates. The main exception was on the deposit side, where the banks' weighted average deposit rate fell by a little under 1 percentage point during 1992/93. Rates offered on low-interest accounts tend to be stickier than market rates, particularly when the general level of interest rates is perceived by depositors to have fallen to an unaccustomedly low level. On the lending side, the calculation of precise falls in rates is complicated by offers of special rates for new customers, as well as reductions in the standard rate, but the general conclusion holds.
|
Transaction accounts |
Fixed deposits and CDs | Weighted average deposit rate | Standard business indicator rates | Standard housing rates |
|---|---|---|---|---|
| 1.0 | 1.0 | 0.9 | 1.0/1.25 | 1.0 |
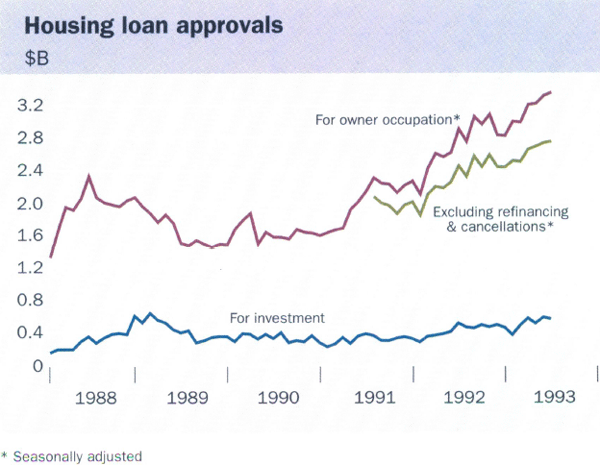
Competition among banks for home loans has remained strong. While banks generally cut their standard interest rates on housing loans to owner-occupiers by 1 percentage point over the year, to 9.5 per cent, most major lenders offered much lower interest rates to new borrowers for the first 6 or 12 months of their loans. Interest rates on these special offers fell as low as 5 per cent for the first 6 months, and 6.5 per cent for the first 12 months. Some lenders also offered to discount loan application fees. This competition, combined with relatively stable house prices, helped to boost housing loan approvals to $3.3 billion per month in the June quarter 1993, compared with $2.7 billion per month in the corresponding quarter of 1992. Loans outstanding for housing rose by 19 per cent. With borrowers taking advantage of special offers, the proportion of new loans made for the purpose of refinancing existing housing loans rose to about 14 per cent at the end of the year, compared with about 11 per cent in June 1992 and 7 per cent in June 1991.
Some signs of greater competition in the market for business credit also emerged but these were more muted than in the housing sector and appeared to have less impact on new approvals. While standard business indicator rates fell by 1 to 1.25 percentage points, broadly in line with the reductions in cash rates, several banks introduced special low interest rates on new business loans, with discounts from standard interest rates of about 2 percentage points. Some banks also offered interest rate caps on these loans for around 3 years, or discounted fixed-rate loans for terms up to 5 years, enabling borrowers to lock in the special low rates over these periods.
At the same time banks were reducing their indicator lending rates for business loans, some were also reassessing the customer risk margins which are added to indicator rates to calculate the rate payable by individual customers. These reassessments are intended to reflect the application of consistent risk-grading systems across all the banks' business customers. This process has resulted in both increases and decreases in customer risk margins with, on average, a slight increase; Reserve Bank estimates suggest that, for the major banks, average customer risk margins have risen by about one eighth of a percentage point over the year.
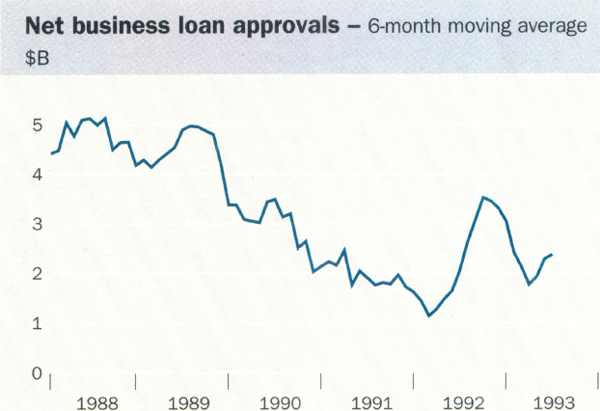
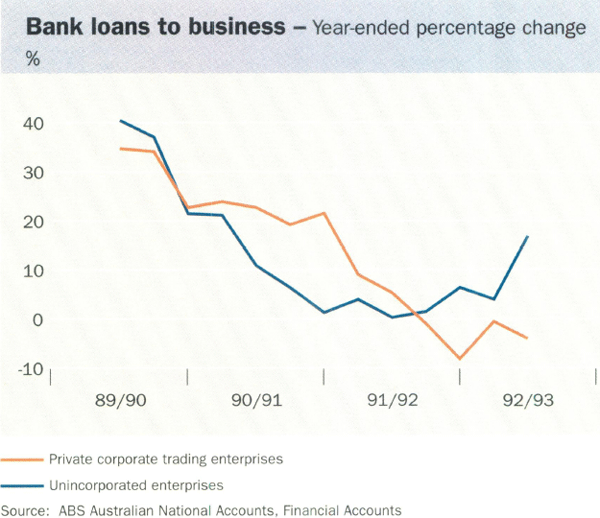
Net business loan approvals by all lenders rose to about $2.5 billion per month on average in 1992/93, compared with about $1.8 billion per month in 1991/92 and rates of about $5 billion per month in the late 1980s. Credit outstanding to business continued to decline in 1992/93, especially to corporations, which account for about three-quarters of bank lending to business. Bank lending to unincorporated enterprises (self-employed people and partnerships) grew by more than 15 per cent in the year to December 1992 (the latest period for which data are available).
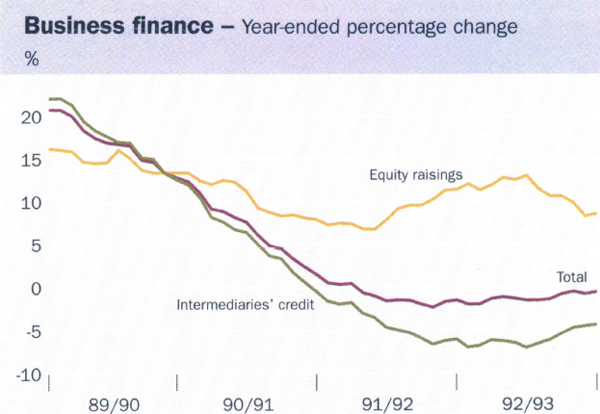
Demand for debt finance other than from intermediaries was also weak during 1992/93, with new issues of fixed-interest securities by the private non-financial sector more than offset by maturities. The result was a fall over the year of $3 billion, to $18 billion, in the stock of these securities on issue. In contrast to the low demand for debt finance, however, equity finance raisings by the private non-financial sector grew by about 9 per cent over 1992/93. The funds raised in the equity market were used mainly to reduce debt, rather than to finance new investment.
Adding together credit from intermediaries and issues of equity and fixed-interest securities, domestic private finance for business fell by about 0.5 per cent over the course of 1992/93, following a fall of 1.5 per cent in 1991/92. The component which represents credit to business from intermediaries fell by 4 per cent. Sluggish economic conditions, and the desire by many businesses to reduce debt, appear to have been the main reasons for this lack of growth, notwithstanding a widespread perception that banks are reluctant to lend to business, particularly to small and medium-sized businesses. The Bank expects to be better informed in future about the problems facing small business in gaining access to finance as a result of several recent initiatives, including:
- the establishment of a small business finance advisory panel to advise the Bank on financing issues of importance to small and medium-sized businesses – the inaugural panel has 12 members, all principals of small or medium-sized businesses, who represent a range of industries and geographical regions; and
- the collection of additional statistics from banks on credit to business classified by size of loan, interest rate, industry and purpose, which will assist in analysing patterns of credit across different sizes of business.