Reserve Bank of Australia Annual Report – 1996 Reserve Bank Earnings and Operations
Earnings
The Bank holds substantial financial assets which support its monetary and banking policy objectives. These assets generate large profits in most years, although profit maximisation is not itself a primary goal. In 1995/96 profits amounted to $2,486 million, compared with an average of $2,108 million over the past decade.
The Bank's profits comprise an “underlying” earnings component, and a component which represents capital gains (and losses) on its holdings of securities and foreign exchange. Underlying earnings reflect the margin between the interest received on assets and the interest paid on liabilities, less the Bank's operating expenses. Bank assets consist almost entirely of Commonwealth Government securities (CGS) and gold and foreign exchange (GFE), the foreign exchange part of which comprises mainly fixed-interest securities of foreign governments denominated in foreign currency. The Bank's liabilities include the large volume of currency notes on issue, on which no interest is paid. Underlying earnings depend mainly, therefore, on the level of interest rates in Australia and overseas, and on the size of the Bank's balance sheet. These earnings have grown steadily over the past decade as the balance sheet has grown; in 1995/96 they amounted to $1,784 million.
|
Underlying earnings |
Realised gains & losses* |
Net operating earnings |
|
|---|---|---|---|
| 1986/87 | 1,412 | 2,035 | 3,447 |
| 1987/88 | 1,508 | 18 | 1,526 |
| 1988/89 | 971 | −554 | 417 |
| 1989/90 | 1,248 | −153 | 1,095 |
| 1990/91 | 1,322 | 391 | 1,713 |
| 1991/92 | 1,516 | 1,038 | 2,554 |
| 1992/93 | 1,760 | 2,803 | 4,563 |
| 1993/94 | 1,556 | −48 | 1,508 |
| 1994/95 | 1,649 | 123 | 1,772 |
| 1995/96 | 1,784 | 702 | 2,486 |
| Average | 1,473 | 635 | 2,108 |
| * The charges to earnings in 1993/94 and 1995/96, when the market value of traded assets fell below cost (and the charges to provisions in the three years to 1989/90), are recorded here as capital losses. | |||
The other component of profits is determined by movements in interest and exchange rates, and fluctuates widely. Gains (and losses) arise in two ways. First, the capital values of domestic and foreign securities in the Bank's portfolio change as interest rates change. When interest rates fall, for example, the value of securities in the Bank's portfolio rises, and vice versa. Movements in bond yields over the course of 1995/96 generated small realised gains of $30 million in respect of actual sales of securities, and unrealised losses of $80 million; the latter virtually eliminated the surplus in the revaluation reserve for investments.
Secondly, gains (and losses) can occur through changes in the Australian-dollar value of foreign-currency-denominated securities held in official reserve assets, as a consequence of exchange rate movements. If, for example, the Australian dollar rises against the currency in which securities are denominated, the value of those holdings in Australian dollars falls. Exchange rate gains and losses are realised when official reserve assets are sold. In 1995/96, realised foreign exchange gains totalled $1,682 million. At the same time, however, the strengthening of the Australian dollar over the course of the year led to substantial unrealised losses on the Bank's foreign exchange holdings, which pushed the foreign currency revaluation reserve into deficit; this was extinguished by a charge against 1995/96 earnings of $1,010 million (representing the write-down of foreign currency holdings to a market value below cost).
Taken together, the realised gains from the sales of financial assets and the unrealised losses on foreign exchange holdings resulted in a net capital gain for the year of $702 million. This brought the Bank's net operating earnings to $2,486 million, an increase of $714 million on the previous year.
The Bank's profits are paid to the Commonwealth Government, net of any transfers to the various reserve funds which the Bank maintains to deal with contingencies. These reserves have been built up in recent years to the point where, with the relatively modest transfers made from 1995/96 earnings, they meet fully the target levels established by the Board.
Reserve Bank profits and payments to Government
($ million)
|
Net operating earnings |
Transfers to reserves |
Balance available for Commonwealth |
Final payment from previous year |
Interim payment from current year |
Total payment |
|
|---|---|---|---|---|---|---|
| 1986/87 | 3,447 | 793 | 2,654 | 1,546 | 1,055 | 2,601 |
| 1987/88 | 1,526 | 740 | 786 | 1,599 | 300 | 1,899 |
| 1988/89 | 417 | 277 | 140 | 486 | – | 486 |
| 1989/90 | 1,095 | 520 | 575 | 140 | 300 | 440 |
| 1990/91 | 1,713 | 210 | 1,503 | 275 | 400 | 675 |
| 1991/92 | 2,554 | 200 | 2,354 | 1,103 | 400 | 1,503 |
| 1992/93 | 4,563 | 750 | 3,813 | 1,954 | 600 | 2,554 |
| 1993/94 | 1,508 | – | 1,508 | 3,213 | – | 3,213 |
| 1994/95 | 1,772 | – | 1,772 | 1,508 | 200 | 1,708 |
| 1995/96 | 2,486 | 150 | 2,336 | 1,572 | 200 | 1,772 |
| 1996/97 | 2,136 |
The Bank has little control over the external factors which can dominate its earnings in particular years, but it does have direct managerial control over some of its revenues and costs, including through:
- the way it manages international reserves;
- the terms on which it provides services to its customers; and
- controls over its operating costs.
Management of international reserves
Foreign exchange reserves are maintained primarily to enable the Bank to intervene in foreign exchange markets. As a consequence, the Bank invests funds only in instruments which are both very liquid and of the highest credit quality. At present, reserves are invested in three major securities markets – the United States, Japan and Germany. The Bank manages its foreign exchange portfolio actively to achieve the best exposure to expected interest rate and exchange rate movements across these three markets. In line with best market practice, the effectiveness of this management is assessed against a carefully constructed benchmark portfolio which reflects the Bank's objectives in relation to credit risk, liquidity and return. Benchmark exposures are shown below.
Benchmarks for foreign currency assets
|
US dollars |
Yen |
Deutsche marks |
|
|---|---|---|---|
| Currency and asset composition (% of total assets) |
40 | 30 | 30 |
| Duration (months) | 12 | 30 | 30 |
In 1995/96 the Bank's foreign portfolio earned a return, measured in SDRs, of 4.0 per cent, on a marked-to-market basis. This was down from SDR 5.2 per cent in 1994/95, reflecting the low level of interest rates prevailing in major countries, especially Japan, and the rise in bond yields over the year, which eroded the capital value of the bond portfolio. The return was nonetheless above that on the benchmark, which earned 3.7 per cent in SDR terms. The value added by active management was equivalent to $A40 million.
Returns on international reserves*
| Absolute return |
Rate of return (per cent) |
|||
|---|---|---|---|---|
| $A million | US assets |
Japanese assets |
German assets |
|
| 1991/92 | 1,698 | 8.8 | 10.7 | 9.8 |
| 1992/93 | 1,461 | 5.2 | 7.5 | 13.4 |
| 1993/94 | 581 | 2.8 | 4.2 | 5.3 |
| 1994/95 | 727 | 6.0 | 3.1 | 6.3 |
| 1995/96 | 520 | 5.1 | 0.7 | 7.4 |
| * Returns shown here are measured on a marked-to-market basis, consistent with the general practice in the funds management industry. They include both realised and unrealised gains and losses, unlike the earnings figures in the Bank's accounts, which exclude unrealised gains and losses (except when market values fall below cost). | ||||
The portfolio was managed for much of the year with an overweight US dollar position against the Deutsche mark and the yen, and for part of the year with an overweight position in German assets against the US and Japan. This proved profitable as the return of the German bond market over this period exceeded that in the US. Duration was generally shorter than the benchmark in the US and Japan, which helped limit the erosion of the bonds' value consequent upon rising yields. The table below shows the results of active management for each year since the benchmark was established.
|
Rates of return (in SDRs) (per cent) |
Value of difference between actual and benchmark returns |
||
|---|---|---|---|
| Actual | Benchmark | ($A million) | |
| 1991/92 | 9.8 | 8.9 | 165 |
| 1992/93 | 16.3 | 11.6 | 420 |
| 1993/94 | 4.0 | 3.8 | 31 |
| 1994/95 | 5.2 | 7.4 | −331 |
| 1995/96 | 4.0 | 3.7 | 40 |
The Bank's holdings of gold totalled approximately 250 tonnes, worth around $3.8 billion, at 30 June 1996. Gold lending activities continued to expand during the year, with the amount of gold on loan rising from 64 to 114 tonnes and the number of counterparties involved rising from 12 to 14. Earnings on gold loans amounted to $20.6 million in 1995/96, a rise of $14.6 million, reflecting both the increased quantity outstanding and a significant increase in margins over much of the year.
Customer services
The Bank provides a range of banking, registry and settlement, note issue and cash distribution services through its capital city branch network. The Bank aims to recover fully the costs of its banking, registry and some specialised cash distribution services through fees and charges. This is in line with the requirements of competitive neutrality endorsed by the Council of Australian Governments for competition between public sector entities and private sector suppliers. No charges are made for those activities which are viewed as public services, such as wholesale note distribution and the processing of notes for quality control purposes.
Specialised banking services are provided to the Commonwealth Government, several State Governments and government instrumentalities, and a number of overseas official institutions. The Bank's principal customer is the Commonwealth Government and its departments.
During 1995/96 the arrangements between the Bank and the Department of Finance for the Bank to be the primary provider of banking services to the Commonwealth were strengthened. To further streamline the Commonwealth's payment and collection processes, the Bank has engaged Australia Post as an agent for the provision of banking and bill collection services (known as “Billpay”). The appointment of Australia Post gives Bank customers access to a much wider network of collection points and enables funds collected to be brought speedily into the Government's accounts.
In conjunction with the Department of Finance, the Bank has reached an understanding with the Australian Taxation Office to review the future development of revenue collection and payment services. A major aim of the review is to provide taxpayers with a range of payment and information transfer methods that is convenient and cost-effective for the parties involved. As a first step, the Bank has assumed management responsibility for the collection of tax payments through the Billpay service. The Bank is also involved with the Departments of Finance and Social Security in developing an electronic service for Commonwealth Government overseas payments. The first phase of this project is scheduled for completion by 1 November 1996.

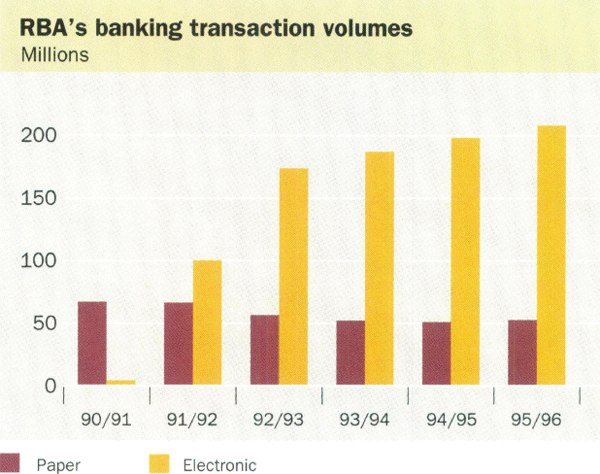
In 1995/96, the volume of the Bank's transactions continued to grow. The number of credit and debit transactions processed through the Bank's Government Direct Entry System (GDES) increased by 5 per cent, to 208 million. This system receives electronic credit and debit instructions from customers and then warehouses, sorts and distributes payments and collections data electronically to a wide range of financial institutions.
The Bank's financial electronic data interchange (EDI) facility processed 104,000 transactions in 1995/96, 25 per cent more than the previous year. The Department of Finance is the major user of this system, making interagency payments and disbursements from the Commonwealth to the States. The volume of paper-based transactions processed by the Bank increased from 51 million to 53 million in 1995/96. This reflected the acquisition of new customers; the underlying trend is still toward electronic transactions, consistent with the aim of reducing costs by progressively replacing paper-based transactions with cheaper and more efficient electronic systems.
During 1995/96, the Bank joined several major banks in the electronic exchange of presented cheque data. This industry-wide initiative is aimed at reducing the costs of clearing cheques through the banking system; it also has the potential to expedite the clearance of cheques and make funds available to depositors earlier. By June 1996, details of over 75 per cent of all cheques drawn on accounts at the Bank were being received electronically. The full benefits of electronic exchange will be realised when the industry agrees on procedures and rules for the “truncation” of cheques, that is, the retention of the actual cheques at the bank branch where they are presented for payment.

The number of customers using ReserveLink, the Bank's PC-based banking package, expanded to 195 during 1995/96 from 110 a year earlier.
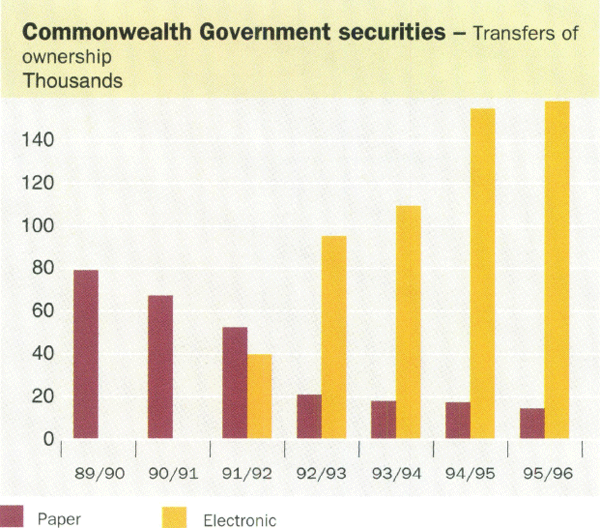
The Bank provides registry services for the Commonwealth Government, borrowing authorities of the governments of New South Wales, South Australia and Western Australia, and several other local and foreign official institutions. Services are provided through the Bank's branches and include maintenance of ownership records, issuance of securities, payment of interest and redemption of securities at maturity. The Reserve Bank Information and Transfer System (RITS) allows members to settle electronically their transactions in Commonwealth Government securities. Membership of the system now stands at 227 compared with 175 a year ago. RITS handles over 97 per cent of turnover in the professional market, and has $93 billion of securities lodged in it.
RITS members have been able to lodge bids electronically at tenders for Treasury bonds and notes since October 1993. In August 1995, the option to tender manually was discontinued; in April 1996, the electronic tendering system was extended to include Treasury adjustable rate bonds. Other services provided by RITS include the automatic payment of interest and maturity proceeds in respect of securities held in the system; provision for members to make high-value loans, either unsecured or secured by mortgages over securities in RITS; and, for those members with accounts at the Bank, a capacity to make high-value payments. In 1995/96, RITS handled about 95,000 transactions of these types.
A new RITS facility for simultaneous settlement of interbank obligations arising from the settlement of equity and other transactions on CHESS, the Australian Stock Exchange's electronic settlement facility, was introduced in April 1996.
As noted already, work has commenced using RITS as the basis for a real-time gross settlement (RTGS) system for high-value interbank payments. To support this work, a facility has been developed in RITS to improve the efficiency and security of reciprocal purchase transactions involving securities for cash with terms of overnight or longer. This facility, which commenced in June 1996, allows members to agree electronically to the terms of a standard, internationally recognised form of reciprocal purchase agreement (the PSA/ISMA Master Repurchase Agreement), eliminate paper confirmations, automatically calculate settlement amounts and reduce the keying of entries.
The Bank acts as National Collator for the Australian Payments Clearing Association (APCA). Each day, the Bank collates details of each bank's obligations arising from transactions in the various clearing streams and calculates the net amount owed to or by each bank for settlement to Exchange Settlement Accounts on RITS at 9 am the next morning. At present, some banks appoint other banks to act as their representative in the paper clearing system, with settlement between these two parties occurring outside the National Collator process. The Bank is currently working with APCA to integrate these settlements into the National Collator process; new arrangements are expected to commence in September 1996.
The value of notes on issue rose by 3.5 per cent in 1995/96, continuing the downward trend of recent years. The high denomination $50 and $100 notes account for 85 per cent of the total value of notes on issue. Some 505 million pieces were on issue at end June 1996, 15 million more than a year earlier. The $50 note continued to account for about a third of the total, followed by the $20 and $100 notes.

Value of notes on issue
($ million)
|
At end June |
$1 |
$2 |
$5 |
$10 |
$20 |
$50 |
$100 |
Total |
Increase (per cent) |
|---|---|---|---|---|---|---|---|---|---|
| 1991 | 43 | 73 | 249 | 679 | 2,048 | 5,345 | 6,356 | 14,793 | 14.0 |
| 1992 | 42 | 71 | 261 | 585 | 1,836 | 5,724 | 6,660 | 15,180 | 2.6 |
| 1993 | 42 | 70 | 297 | 591 | 1,813 | 6,284 | 7,269 | 16,367 | 7.8 |
| 1994 | 21 | 69 | 313 | 634 | 1,795 | 6,837 | 7,907 | 17,577 | 7.4 |
| 1995 | 20 | 49 | 332 | 614 | 1,848 | 7,193 | 8,482 | 18,538 | 5.5 |
| 1996 | 19 | 48 | 337 | 583 | 1,868 | 7,928 | 8,399 | 19,182 | 3.5 |
During 1995/96, around 1.5 billion used notes were processed through the Bank's high-speed note processing machines. Of these, about 85 per cent were passed fit for reissue, and the remainder destroyed.
Polymer notes
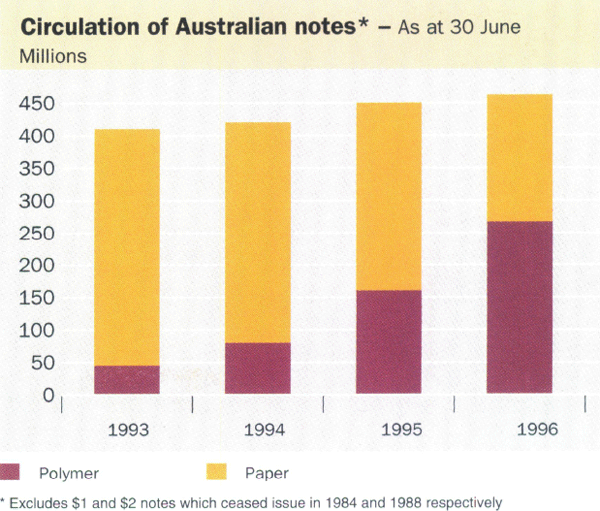
New $50 and $100 notes were introduced on 4 October 1995 and 15 May 1996, respectively. This completed the introduction of the new series of polymer notes, making Australia the only country to switch all its currency notes from paper to polymer. Note Printing Australia has produced polymer notes for seven other countries (commemorative and circulating); overseas interest in the technology remains high.
Counterfeiting of paper notes has become a significant problem worldwide, facilitated by rapid advances in print technologies. That threat has underpinned the Bank's move to polymer notes, which can incorporate anti-counterfeiting features that are not available with paper notes. No polymer-based counterfeit notes have been detected, although some relatively crude attempts have been made to reproduce the new-series notes on paper. In conjunction with Note Printing Australia, the Bank has embarked on a major research and development program aimed at exploiting further the unique qualities of polymer as a secure and practical substrate for currency notes.
The Bank's administration
Following a decade during which staff numbers fell by half, 1995/96 was marked by relative stability in the Bank's staff levels. No further major reorganisation was undertaken and earlier programs to encourage the departure of surplus staff through voluntary redundancies and early retirements had already run their course. Total staff in the Bank (excluding Note Printing Australia) declined by 16 to 1516, with losses through natural attrition in branches more than offsetting a small rise in Head Office.
The tighter staffing environment has meant that more emphasis has been given to improving the performance and skills of staff. New performance appraisal and pay arrangements, together with procedures for the management of poor performers, were introduced in 1995. The Bank maintained its strong commitment to training, including the introduction of a wider range of in-house courses, study assistance and secondments to other institutions.
Staff numbers
|
At end June |
Head Office |
Branches |
Total excl. NPA |
NPA |
Total Bank |
|---|---|---|---|---|---|
| 1970 | 997 | 1,647 | 2,644 | 838 | 3,482 |
| 1975 | 1,169 | 1,808 | 2,977 | 775 | 3,752 |
| 1980 | 1,154 | 1,865 | 3,019 | 629 | 3,648 |
| 1985 | 1,175 | 1,839 | 3,014 | 585 | 3,599 |
| 1990 | 1,043 | 1,255 | 2,298 | 278 | 2,576 |
| 1991 | 1,012 | 1,197 | 2,209 | 283 | 2,492 |
| 1992 | 943 | 1,033 | 1,976 | 273 | 2,249 |
| 1993 | 913 | 935 | 1,848 | 273 | 2,121 |
| 1994 | 913 | 800 | 1,713 | 272 | 1,985 |
| 1995 | 818 | 714 | 1,532 | 263 | 1,795 |
| 1996 | 828 | 688 | 1,516 | 263 | 1,779 |
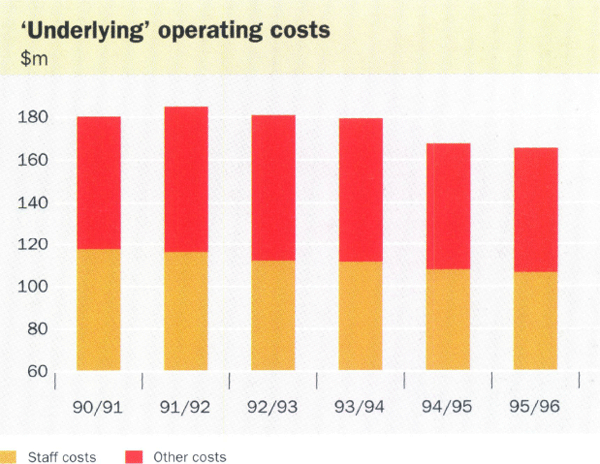
Since their peak in 1991/92, the Bank's “underlying” operating costs (which exclude lumpy expenditures on voluntary redundancy offers and certain other one-off items) have fallen by 11 per cent in nominal terms and by about 20 per cent in real terms.

The restraint on costs has been driven by the competitive pressures facing the Bank's customer services and by the Bank's aim, more generally, to be cost-effective in all its activities, particularly those subject to direct comparison with the private sector. The Bank's costing systems have been upgraded to sharpen this “benchmarking” process. Recent initiatives include a decision to outsource the cleaning of Head Office and branch buildings. The new arrangements, which will result in substantial cost savings, will take effect from August 1996. The Bank also tested the competitiveness of its in-house mainframe computing costs against tenders from commercial suppliers of mainframe services. This process showed that the Bank's own facility was more than competitive with “the market” in terms of both costs and levels of service. In another move, the Bank reviewed its workers' compensation arrangements in the face of a substantial increase in the premium charged by Comcare, the Commonwealth agency with which the Bank had been required to insure its liabilities. Premia paid to Comcare have been well in excess of the Bank's compensation costs. Against this background, the Bank applied for and was granted, in May, a licence from the Safety, Rehabilitation and Compensation Commission to self-insure and manage its own workers' compensation claims. This decision to “insource” will enable the Bank to hold costs to levels determined by its own claims experience.