Bulletin – May 1993 The Australian Foreign Exchange Market
- Download 61KB
This article reviews recent developments in the Australian foreign exchange market.[1] It draws on the Bank's regular statistical collection and on a survey of major foreign exchange markets that was conducted in April 1992 by the Bank for International Settlements (BIS).[2]
The Australian Market
The Australian foreign exchange market expanded rapidly in the second half of the 1980s, after the Australian dollar was floated and exchange controls were abolished. By the close of the 1980s, both the Australian foreign exchange market and the Australian dollar had taken on international standing; that standing remains, although the earlier rapid growth in turnover has levelled off.
Average daily turnover in the Australian market reached US$34 billion in 1990, about seven times larger than the turnover in 1985. It has broadly maintained this level since then, generally fluctuating between US$30 billion and US$35 billion.
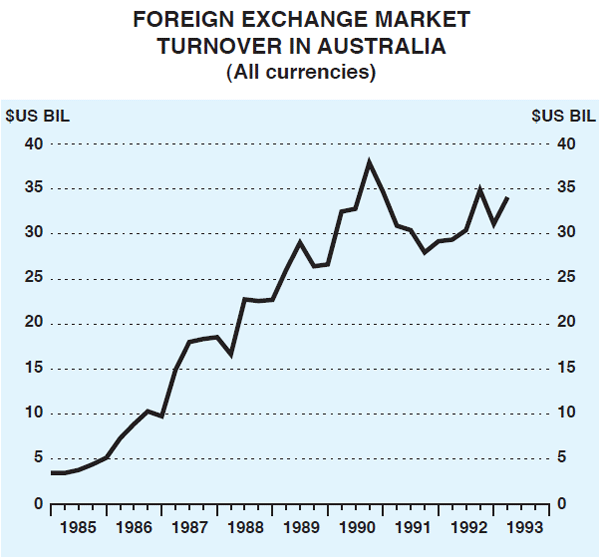
Trading in the Australian foreign exchange market includes transactions in Australian dollars against other currencies (mainly the US dollar) and transactions not involving Australian dollars – US dollars against yen, for example. These latter transactions are known in the market as ‘third currency’ trading. Both segments of the market expanded rapidly in the 1980s, and were of roughly equal size. In the 1990s, third currency trading has grown at a faster pace than Australian dollar trading (see Graph 2).
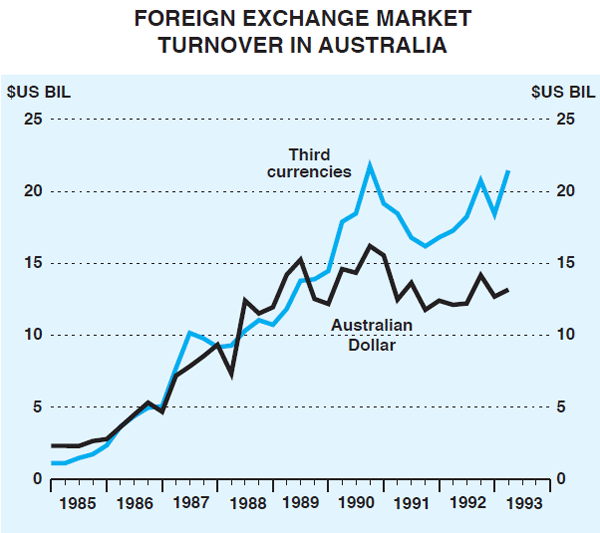
After growing at an average rate of 40 per cent a year over the second half of the 1980s, foreign exchange turnover of the Australian dollar began to level out in 1989 at around US$12–14 billion a day. It has been fairly flat since then.
Three major factors have contributed to the levelling off in turnover in Australian dollars since 1989:
- rationalisation of financial markets in Australia. As part of their plans to concentrate their activities in a few key financial centres, several foreign-owned institutions decided to withdraw from Australia. Some Australian institutions have also merged. As a result, the number of authorised foreign exchange dealers in Australia declined from a peak of 92 in May 1989 to 72 in March 1993;
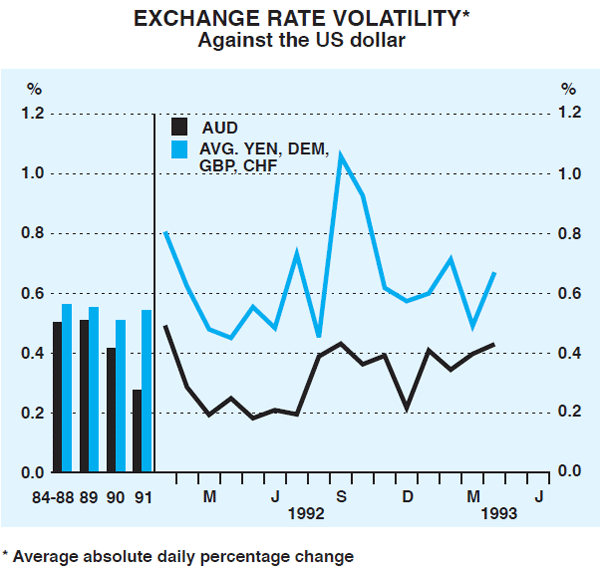
- reduced volatility of the AUD/USD exchange rate. The more stable exchange rate has reduced the need for customers and dealers to engage in foreign exchange transactions: in such circumstances, customers are better able to plan and arrange their foreign currency affairs and dealers are able to hold positions for longer. Graph 3 shows the relative decline in volatility of the Australian dollar. In 1991, average daily volatility was comparable with data during the managed exchange rate era. More recently, volatility of the Australian dollar has increased a little, though it remains below the average experience of other major currencies; and
- interest rates in Australia have fallen sharply relative to those elsewhere. Other things equal, this could be expected to reduce international trading in Australian dollar securities.
In addition to this trading of Australian dollars in Australia, a significant amount of trading in Australian dollars occurs in offshore markets, with the Australian dollar traded actively on a 24-hour basis in all major markets. In April 1992, trading in Australia accounted for only 45 per cent of total turnover in Australian dollars. Trading in the Australian dollar in Asia accounted for 25 per cent of the total turnover in Australian dollars; European and North American markets each accounted for 15 per cent of total turnover.
Global Australian dollar turnover averaged US$27 billion a day in April 1992. At that time, the Australian dollar was the ninth most actively traded currency (see Table 1). It had been ranked sixth three years earlier, but strong growth in turnover in the French franc, Canadian dollar and, especially, the ECU saw these currencies overtake the Australian dollar. After the disruption to the ECU market in September 1992, however, it is likely that this market has now contracted. The five most actively traded currencies remain the US dollar, German mark, yen, sterling and Swiss franc.
| US$ billion | |
|---|---|
| US dollar | 928 |
| Deutsche mark | 461 |
| Yen | 256 |
| Pound sterling | 150 |
| Swiss franc | 96 |
| French franc | 44 |
| Canadian dollar | 37 |
| ECU | 35 |
| Australian dollar | 27 |
Turnover in Australia of third currencies has continued to increase in recent years, after a pause in 1991. It currently stands at around US$20 billion a day, accounting for about 55 per cent of turnover in the Australian market (compared with 45 per cent for Australian dollar trading).
Trading in this segment of the market covers a wide range of currencies but is accounted for mainly by transactions in US dollar/mark, US dollar/yen and US dollar/sterling. There is heavy participation by overseas banks. The factors mentioned earlier which dampened trading in Australian dollars do not apply to any great extent to this segment of the market, which has continued to expand in line with trading in other world foreign exchange markets (see below).
The Global Context
Size of Foreign Exchange Markets
The latest BIS survey provides details of foreign exchange trading in 26 foreign exchange markets. (A similar, albeit somewhat narrower, survey was conducted in 1989.[3]) The BIS estimates that global foreign exchange turnover, net of double-counting of transactions within and between markets, was around US$880 billion a day in April 1992, compared with estimated turnover of US$620 billion a day in April 1989. This represents average growth of around 12 per cent a year over the period. Table 2 shows turnover in the ten largest markets.
| Country | Turnover (US$ billion per day) |
% growth since April 1989 |
|---|---|---|
| United Kingdom | 300 | 60 |
| United States | 192 | 49 |
| Japan | 126 | 10 |
| Singapore | 76 | 38 |
| Switzerland | 68 | 19 |
| Hong Kong | 61 | 24 |
| Germany(b) | 57 | n.a. |
| France | 36 | 38 |
| Australia | 30 | 0 |
| Denmark | 28 | 112 |
|
(a) Unadjusted for double-counting between markets (b) Germany did not participate in the survey in April 1989. |
||
The three largest markets remain the United Kingdom, the United States and Japan; over 50 per cent of total activity occurs in these centres. The United Kingdom dominates; its turnover is the largest and fastest growing. The next tier of markets comprises Singapore, Switzerland, Hong Kong and Germany. In total they account for a quarter of total activity. The third tier comprises France, Australia and Denmark.
The Australian foreign exchange market now ranks as the ninth largest, effecting about 3 per cent of global foreign exchange transactions. Turnover in Australia did not expand between the 1989 and 1992 surveys. Lower turnover against the Australian dollar offset growth in third currencies. In fact, third currency trading in Australia rose by about 32 per cent over the three years, faster than growth of total turnover in Tokyo and Hong Kong within this region. (Since the survey was collected, trading in third currencies has increased in Australia by a further 20 per cent.) The substantial increase in importance of third currency trading in Australia over recent years reflects the important role the Australian market plays in bridging the time gap between the closing of trading in American markets and the opening of markets in Asia.
Currencies Traded
The patterns of currency trading in individual foreign exchange markets cover a wide spectrum. In some, the domestic currency accounts for a high proportion of trading, while in others it represents a low proportion. The United States is an example of the former, although this is largely because a high proportion of all foreign exchange transactions are denominated in US dollars. Another example of this kind of market is Tokyo, where 75 per cent of turnover is against the yen. London, Singapore and Hong Kong are at the other end; for example, only 5 per cent of turnover in Singapore is against the Singapore dollar while in London, only 25 per cent of transactions are against sterling.
The Australian market lies toward the middle of this spectrum. As noted earlier, the Australian dollar is involved in around 45 per cent of transactions in the Australian foreign exchange market. Almost all of this turnover is against the US dollar; the only other significant trading of Australian dollars is against yen. Graph 4 provides more information.
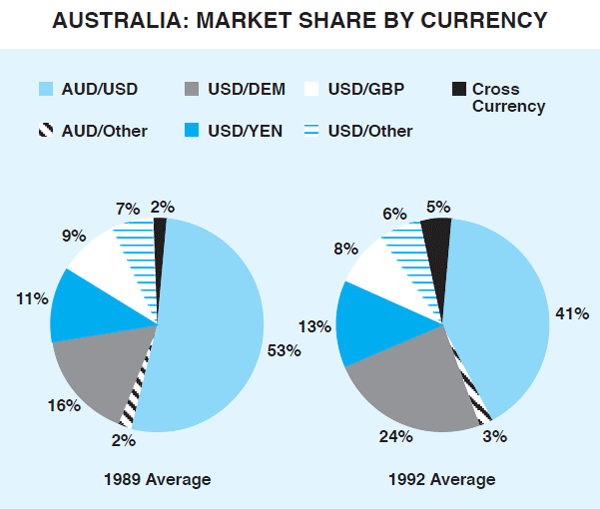
The remaining 55 per cent of turnover in the Australian market covers a range of currencies, mainly with the US dollar on one side of the transaction. The mark accounted for around one-quarter of all turnover in Australia in 1992, well up from 16 per cent in 1989. The strong increase in turnover in marks has been a feature of all markets over this period, and mainly reflects the increased importance of the mark as a reserve currency, particularly because of its links with other European currencies. The proportion of trading of other European currencies in Australia has declined. Trading in yen also has increased, although not to the same extent as that in the mark.
The share of cross-currency trading – i.e. trades which involve neither the US dollar nor the Australian dollar – has increased. This trend is also common to most markets. In Australia, turnover of marks against yen, the largest segment of the cross-currency market, accounts for about 3 per cent of all turnover.
Type of Transactions
There has been a large shift in the different types of transactions undertaken in foreign exchange markets. The proportion of outright spot transactions[4] has fallen noticeably in Australia and elsewhere, while turnover in foreign currency swaps[5] has increased. Table 3 shows some figures.
| Transaction | Australia | Global Market | |||
|---|---|---|---|---|---|
| April 1989 | April 1992 | April 1989(a) | April 1992 | ||
| Outright spot | 61 | 42 | 58 | 47 | |
| Swaps | 32 | 51 | 34 | 39 | |
| Outright forward | 5 | 4 | 5 | 7 | |
| Futures and Options | 2 | 3 | 3 | 6 | |
| (a) The April 1989 figures for the global market are unadjusted for double-counting between and within markets. | |||||
Some points to note from this table are:
- in the Australian market, spot transactions in 1992 accounted for a little over 40 per cent of all transactions, compared with around 60 per cent in 1989. In other markets, a similar, though less pronounced, trend also has been evident. The more pronounced decline in Australia reflects the fall of around 60 per cent in Australian dollar spot turnover; third-currency spot transactions in Australia rose slightly over the period;
- the share of swaps transactions has increased to over 50 per cent in Australia, higher than the global average;
- forward transactions[6] account for around 4 per cent of turnover in Australia, little changed over recent years and below the average for the global market; and
- futures and options continue to play only a limited role in all foreign exchange markets, despite their rapid growth over recent years. Globally, trading in these is roughly similar in size to outright forwards. In Australia, trading in futures and options accounts for around 3 per cent of turnover.
Counterparties
In Australia, almost 80 per cent of turnover is transacted between banks – domestic interbank dealers are counterparts to around 20 per cent of deals and overseas banks are counterparts to a further 60 per cent. Overseas banks' share of the market has risen as the relative importance of trading in third currencies has increased. Graph 5 shows that almost three-quarters of non-Australian dollar transactions are undertaken with overseas banks, compared with less than 40 per cent of transactions that have an Australian dollar leg. The proportion of deals with overseas banks is higher in Australia than elsewhere. In other centres, an average of about 40 per cent of transactions was carried out with banks located abroad and a further 30 per cent with dealers located at home.
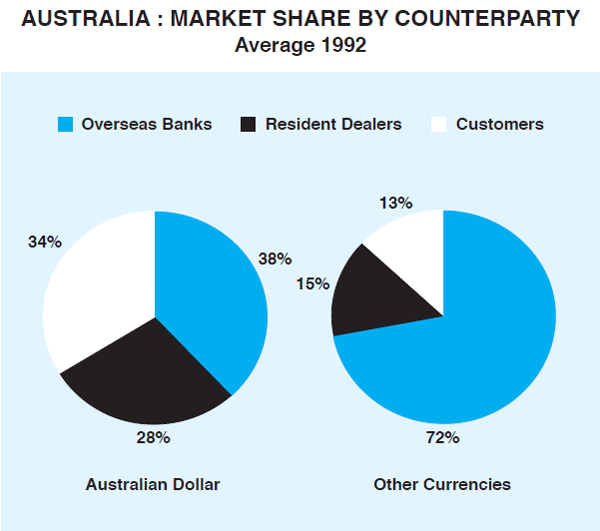
Transactions with customers account for a little over 20 per cent of total turnover in the Australian market, which is low by international standards. In the Australian dollar market, however, customer business is 35 per cent of the total, about the same proportion as customer business in overseas markets. Brokers are involved in one-third of all transactions in the Australian and other foreign exchange markets.
Concentration of Market
A steady increase has occured in the degree of market concentration in Australia in recent years. The ten largest dealers in the Australian foreign exchange market now account for over 70 per cent of all transactions, up by over 10 percentage points since the late 1980s. The twenty largest dealers account for about 90 per cent of transactions.
Footnotes
Earlier articles on the Australian foreign exchange market appeared in the August 1987 and the March 1990 issues of the Bulletin. [1]
‘Central Bank Survey of Foreign Exchange Market Activity in April 1992’, Bank for International Settlements, March 1993. Copies are available on request from the Reserve Bank, Sydney. [2]
‘Survey of Foreign Exchange Market Activity’, Bank for International Settlements, February 1990. [3]
Transactions involving an exchange of currencies within two business days. [4]
The exchange of two currencies at a particular date and the simultaneous agreement to reverse the transaction at a later date, generally at a different exchange rate. [5]
The agreement to exchange currencies at an agreed price more than two business days away. [6]