Bulletin – October 1993 The Economy and Financial Markets in the September Quarter
- Download 555KB
Economic activity remains patchy but there have been tentative signs of heightened confidence over recent months, suggesting that some pick-up in the pace of growth in the Australian economy may be in prospect. Corporate profitability has been improving; companies have been making large raisings of new equity; and share prices have risen strongly. Business investment plans also are being revised upward, although actual investment spending at this stage remains low. This more expansionary tone has not yet been translated into sustained rises in employment, but job vacancies are rising, albeit from a low base.
The external environment, on the other hand, has not improved. Economic conditions in Japan, Australia's biggest single trading partner, have possibly deteriorated in recent months, and earlier forecasts of recovery have been scaled back. Activity in Europe also remains weak, while there is little sign of acceleration in the modest expansion under way in the United States. Growth in the Asian region outside Japan remains robust, though the Chinese authorities are attempting to slow the very strong expansion in that country. Overall, the world economy offers only patchy support for the Australian economic recovery as yet, and after rising tentatively in the middle of 1993, commodity prices subsequently declined again during the September quarter. These trends limit the extent to which growth in Australia can accelerate at this time.
With low levels of activity, there are few pressures on costs and prices from domestic sources. The June quarter CPI, released in late July, confirmed that underlying inflation remains low. This information strengthened the case for an easing of monetary policy and, with a period of relative stability in financial markets, the Bank acted to reduce cash rates by 0.5 of a percentage point, to 4.75 per cent, on 30 July. Market reaction to this change, which had been widely anticipated, was generally positive and remained so in the lead-up to the Budget.
Subsequently, however, against a background of weak commodity prices, the uncertainty associated with the passage of the Budget and its medium-term deficit-reduction measures put the Australian dollar under downward pressure, with the trade-weighted index reaching an all-time low during September. Rising import prices, together with the recent Budget revenue measures, will push up the ‘headline’ CPI over the quarters ahead. ‘Underlying’ inflation, however, should remain around 2 to 3 per cent.
The International Economy
Economic activity continues to be weak in the major industrialised countries. With few exceptions, unemployment is high while inflation is at its lowest levels for many years (Table 1). The improved inflation environment saw further falls in long-term interest rates on world bond markets. Lower interest rates will help growth in time, but short-term prospects have again been marked down, with international forecasters now expecting growth in the industrialised countries of around 2 per cent in 1994.
|
Consumer price inflation (year-ended rate, per cent) |
Unemployment rate (per cent) |
|||
|---|---|---|---|---|
| latest | a year earlier | |||
| United States | 2.8 | (Aug) | 6.7 | 7.6 |
| Japan | 1.9 | (Aug) | 2.5 | 2.2 |
| Western Germany | 4.0 | (Sep) | 8.4 | 6.7 |
| France | 2.2 | (Aug) | 11.7 | 10.4 |
| United Kingdom | 1.7 | (Aug) | 10.4 | 10.0 |
| Canada | 1.7 | (Aug) | 11.3 | 11.6 |
| Australia | 1.9 | (Jun qtr) | 10.9 | 10.8 |
The United States is still the only one of the big three economies recording an expansion in output. Real GDP rose at an annual rate of about 2 per cent in the June quarter. Information for July and August on retail sales, industrial production and housing starts suggests a continuation of this modest expansion.
The expansion also has become more sustainable, particularly as it is generating new jobs. Employment is now rising steadily, with non-farm employment rising 1.5 per cent over the year to August, pushing the unemployment rate down to 6.7 per cent and helping to lift household incomes. Earlier concerns that inflationary pressures might re-emerge relatively early in the recovery have receded, as CPI results have improved over recent months. There was no change to Federal Reserve monetary settings in the quarter.
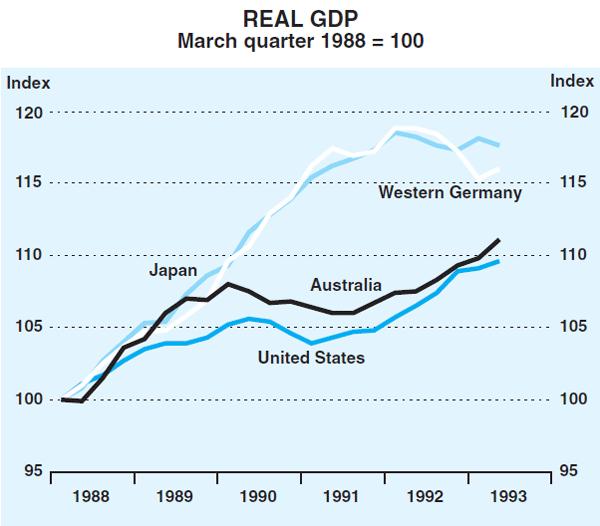
Economic performance in continental Europe is still weak. Real GDP in western Germany increased by 0.6 per cent in the June quarter, but this came after four consecutive quarterly falls, and output was still 2.4 per cent lower than a year earlier. Production growth in the quarter went largely into stocks, suggesting that output could fall back in the September quarter. Employment continues to fall and the unemployment rate reached 8.4 per cent in August, compared with 6.7 per cent a year ago. Some key indicators, such as industrial production and new orders for manufacturing, have levelled out in recent months, suggesting that the economy could be reaching a trough, though there are few signs of actual expansion in activity as yet.
Inflation pressures have eased slightly in western Germany, particularly for goods (services prices are still rising more quickly, particularly rental costs). Preliminary data indicate that the CPI rose by 0.2 per cent in September, taking the rise over the year to 4.0 per cent. The increase in the value-added tax last January accounted for about ½ of a percentage point of this rise.
These trends have provided scope for the Bundesbank to continue to ease monetary policy. During the September quarter, the discount rate was cut in two steps by a total of 1 percentage point to 6.25 per cent and the Lombard rate in three steps by 1.25 percentage points to 7.25 per cent. The more important repurchase rate, which determines short-term market rates, was lowered gradually by 0.9 of a percentage point to 6.7 per cent.
These reductions did not prevent continuing stresses in the European Exchange Rate Mechanism (ERM), despite the fact that several countries raised official interest rates in July to shore up their currencies and central banks intervened heavily to the same end. The pressures were finally brought to a head when the Bundesbank, at its Council meeting in late July, reduced interest rates by less than was generally expected. The immediate crisis was resolved on 1 August by widening the bands within which most members' currencies are permitted to fluctuate to 15 per cent either side of their mid rates.
This added flexibility opened the way for early easings of monetary policy among Germany's ERM partners, but these easings were slow to come and, when they did, were smaller than expected. In many European countries, official interest rates remained higher at the end of the quarter than they had been before the crisis developed. The movements in interest and exchange rates are summarised in Table 2. Only the Netherlands came through the episode without a significant fall in its exchange rate.
| Three-month interest rate (percentage points change) |
Exchange rate against
Deutschemark (percentage change) |
||||
|---|---|---|---|---|---|
| 30 June to 30 July (pre ERM crisis) |
30 July to 30 September (post ERM crisis) |
30 June to 30 September | |||
| France | 1.5 | −1.5 | −3.5 | ||
| Denmark | 9.8 | −8.3 | −5.1 | ||
| Ireland | −0.6 | 0.6 | −4.1 | ||
| Belgium | 1.8 | 0.9 | −5.0 | ||
| Netherlands | – | −0.5 | −0.1 | ||
| Spain | 1.3 | −2.1 | −5.6 | ||
The economic situation in Japan appears to have deteriorated. Real GDP fell in the June quarter, reversing the rise recorded in March. Recent movements in indicators such as industrial production, new orders and retail sales suggest that the September quarter was weak as well, although output would have been supported by public spending associated with the implementation of the April fiscal package. The Bank of Japan's August Tankan survey pointed to further falls in business confidence and investment spending. Growth has not been helped by the sharp appreciation of the yen in recent months. The new government, formed in early August, announced another fiscal package in mid September, costed at over 1 per cent of GDP, though financing for the measures it contains is unlikely to pass through the Diet until next year.
Underlying inflation in Japan has fallen to around 1½ per cent, from 2½ per cent a year ago. With price moderation and few signs of any recovery in activity, monetary policy was eased on 21 September, with a reduction in the official discount rate of 0.75 of a percentage point, to the historically low level of 1.75 per cent. The cut was larger than expected and although short-term interest rates had fallen ahead of the announcement, they subsequently declined further. Overnight rates in Japan fell by a total of 0.8 of a percentage point in the September quarter, to 2.5 per cent.
Elsewhere in Asia, growth is still much stronger than in the major industrialised countries. The Chinese economy has been overheating. Industrial production increased by 23 per cent over the year to August, which is down from annual rates of up to 30 per cent reported earlier this year. The annual rate of consumer price inflation in the major cities has exceeded 20 per cent in recent months, and continuing confidence and rapid credit growth in the fast-growing provinces have fuelled asset price rises. This has prompted a series of restrictive policy measures, including increases in interest rates, cuts in government spending and the reining in of credit to State-owned enterprises. The full effect of these measures is yet to be seen.
Partly on the back of strong growth in China, the economies of Hong Kong and Taiwan continue to expand solidly, with increased linkages between the three countries. Output growth in South Korea over the year to June was a little over 4 per cent, with the industrial dispute in Hyundai (the largest car manufacturer) and uncertainties about economic reforms slowing the expansion.
Output growth in Singapore was 10 per cent over the year to June, with inflation around 2 per cent. Malaysia also recorded growth of about 10 per cent over the year to June, although inflation is running at around 4 per cent. These two economies are becoming increasingly inter-linked as Singapore relocates some of its manufacturing production capacity to Malaysia. The New Zealand economic recovery has continued, with growth of 3.9 per cent in the production measure of GDP over the year to June. Business confidence is high, and inflation remains very low.
The Australian Economy
Economic activity
In the national accounts for the June quarter, the average measure of real GDP rose by 1.2 per cent in the quarter and by 3.3 per cent over the year to June. Domestic final demand rose strongly in the quarter. Private consumption, expanding more quickly after several weak quarters, and higher government expenditure each contributed about half the rise. The production accounts suggest a large expansion in manufacturing output.
The figures were compiled unusually early to meet Budget deadlines; this suggests that some caution is required in interpreting them. The composition of growth – in particular, the lumpy nature of estimates of government demand and the sharp movement in non-farm stocks – suggests that the ‘headline’ figures could overstate the strength of the underlying trend in activity.
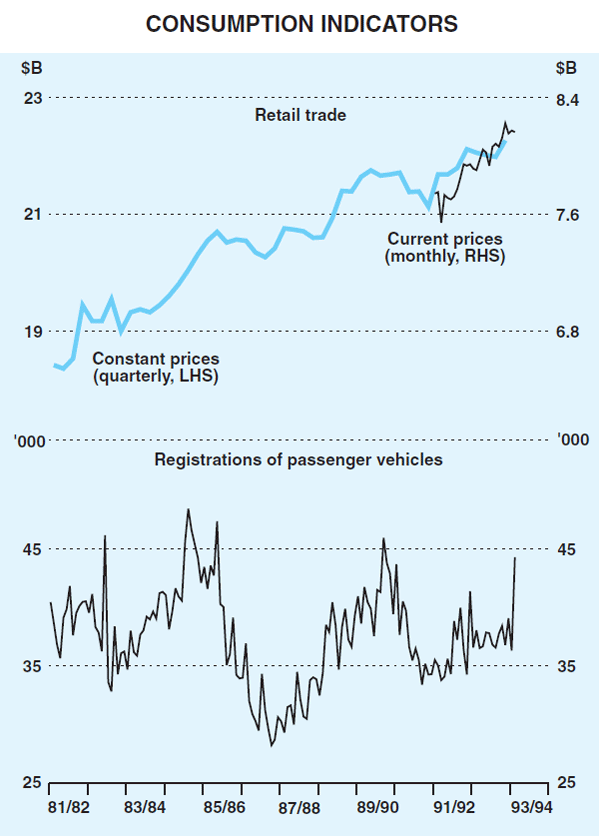
More recent information also suggests the apparent strength in consumption has not been maintained. The value of retail trade fell back in June after the very strong reading in May, and remained around the same level in July and August. The underlying growth of retail trade is running at around 3 per cent in nominal terms. The number of passenger vehicle registrations rose sharply in August, against a fairly flat trend since early 1992. This appears to reflect the bringing forward of sales, with expectations that a large rise in motor vehicle sales tax might be included in the Budget. Overall, the best interpretation is probably that modest growth in consumption is still occurring, with growth constrained by the fairly sluggish expansion in household incomes.
In other areas, however, indications of growth are more positive. Company profits as estimated by the Statistician rose strongly in the June quarter, and have been on a solid up-trend for some time. More recent profit reports suggest that this trend is continuing, and this is one factor helping to move share prices higher. Companies are taking advantage of this environment to raise new equity capital (see the section on monetary and credit conditions below).
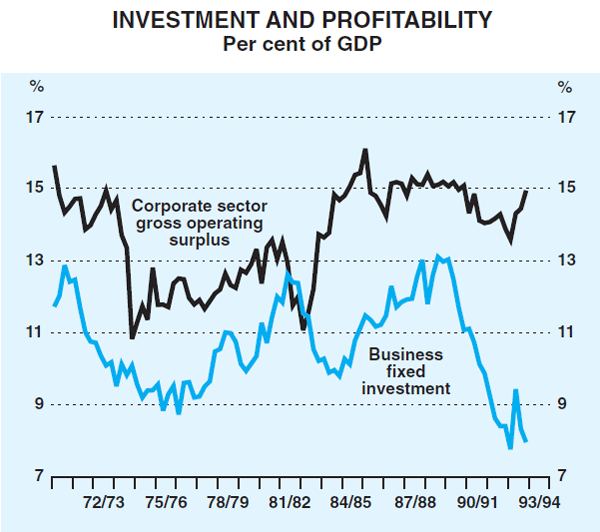
To a large extent, the higher cash flows and proceeds of new raisings are still being used to retire debt – a trend observed over the past two years – and investment, as recorded in surveys of actual capital expenditure, remains at low levels. The responses to the Statistician's preliminary June quarter survey of businesses' investment intentions for 1993/94, however, showed significant upward revisions to plans for spending on equipment. This was the largest upward revision to the June quarter estimate for the year ahead since 1989/90.
Activity is strong in the residential construction sector, with households continuing to expand their borrowings for housing purposes in response to low nominal interest rates and relatively stable house prices. Housing finance approvals have run at record levels over recent months, and while some of this represents refinancing activity and not all loan commitments are being drawn down, local government building approvals are also running at high levels. The number of building approvals was 2.5 per cent higher in the three months to August than in the previous three months, which points to a small increase in private dwelling commencements in the September quarter; commencements are running at an annual rate of about 160,000.
Approvals for non-residential construction remain on the shallow uptrend evident since late 1992, with increased construction of shops and factories being only partially offset by further falls in office building activity.
The manufacturing sector is expanding. The national accounts suggested a strong rise in output – about 3½ per cent in the June quarter, and around 7 per cent over the year to June. Other indicators also suggest expansion, though at a more modest pace. A positive net balance of respondents to the ACCI-Westpac survey for the September quarter reported a rise in output, and expect it to rise again in the December quarter. The expansion has been helped by the growth in manufactured exports, which rose by over 20 per cent in real terms over the year to June, and now represent about 10 per cent of manufacturers' total sales, compared with 5 per cent five years ago. Notwithstanding the weakness of business investment overall, capital expenditure by manufacturing industry rose by 12 per cent in nominal terms over the year to June, a trend which survey respondents expect will continue in 1993/94.
Labour market
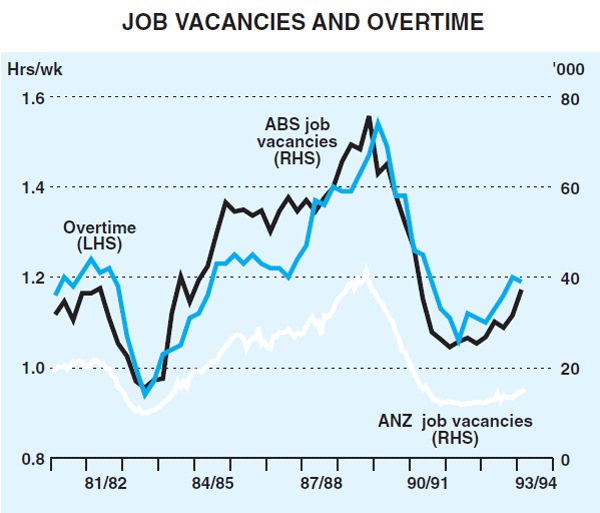
A step-up in activity is apparent in job vacancies, which have risen sharply in recent months. The ANZ Bank's series rose by 15 per cent between May and September, to be some 21 per cent higher than a year earlier. The broader ABS series rose by 18 per cent between May and August, to be about 40 per cent higher than a year earlier; vacancies in the private sector rose by more than 50 per cent over the year.
Vacancy levels remain well down on peak levels of 1989, and the ABS series at least appears to be boosted by the inclusion of placements by the Commonwealth Employment Service under the Government's job subsidy programs. Nonetheless, the clear upward trend in all measures of vacancies, combined with higher levels of overtime worked, suggests that demand for labour is picking up.
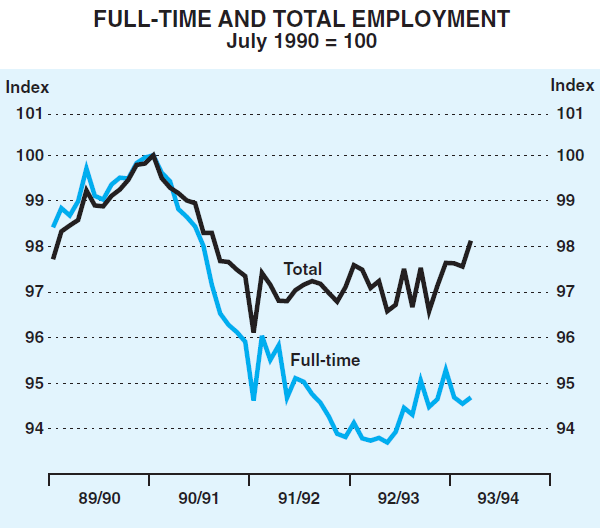
To date, there are only tentative signs of this translating into a significant rise in numbers employed. Total employment remained at its (higher) June level in July and August and rose by 45,000 in September, but the volatility of monthly data suggests caution in interpretation of these movements. Since late 1992 there had been a shift towards full-time jobs, but recent increases have been concentrated in part-time employment. The unemployment rate remains around 11 per cent, with job-shedding due to structural change probably adding to short-term unemployment. Measures confirmed in the recent round of State budgets will see further public sector job shedding over the coming year.
Prices and costs
The Consumer Price Index rose by 0.4 per cent in the June quarter and by 1.9 per cent over the year to June. Over the year, the effects of falling interest rates partially offset the effects of increases in government taxes and charges and higher prices for imported items.
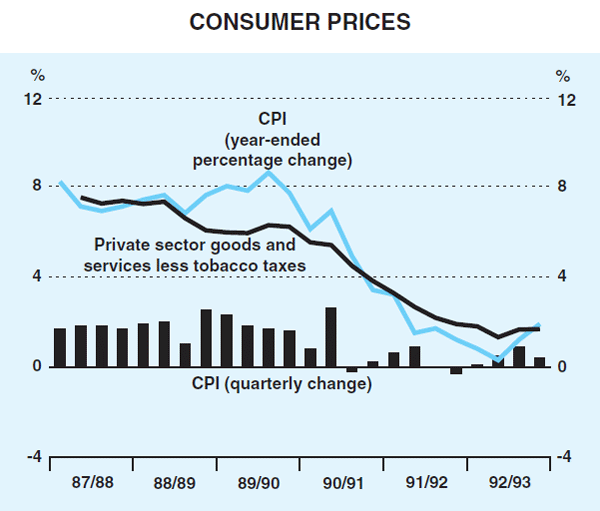
Measures of underlying inflation remained around 2 per cent. A measure of prices of goods and services provided predominantly by the private sector, for example, increased by 2.5 per cent over the year to June; adjusted for the effects of tobacco taxes, the rise was around 1¾ per cent. The good performance on prices reflects quite slow increases in major costs – both labour costs and prices for most raw materials – and a still-difficult trading environment for retailers. Table 3 summarises recent price and labour cost statistics.
| June qtr 1991 |
June qtr 1992 |
June qtr 1993 |
|
|---|---|---|---|
| Consumer prices | |||
| Total CPI | 3.4 | 1.2 | 1.9 |
| Private sector goods and services | 4.1 | 2.1 | 2.5 |
| – adjusted for tobacco taxes | 3¾ | 2 | 1¾ |
| Treasury underlying measure | 4.0 | 2.7 | 1.9 |
| Fixed-weight consumption deflator | 3.8 | 2.2 | 2.1 |
| Nominal labour costs | |||
| Ordinary-time earnings | 5.0 | 4.7 | 1.8 |
| Private sector OTE | 4.3 | 4.4 | 1.1 |
| Unit labour costs | 1.8 | 2.6 | −0.9 |
Over the year ahead, two key influences on prices are likely to be increases in indirect taxes and the effects of a lower currency on prices for internationally-traded goods and services. Increases in government taxes and charges, mainly at the State level, added about 1 percentage point to the rise in the CPI in 1992/93. In 1993/94, revenue measures in the Commonwealth Budget could contribute directly about ¾ of a percentage point to the CPI, with indirect effects of the higher fuel prices through higher transportation costs adding further to general prices. The State governments made only minimal increases to their taxes and charges in their budgets this year.
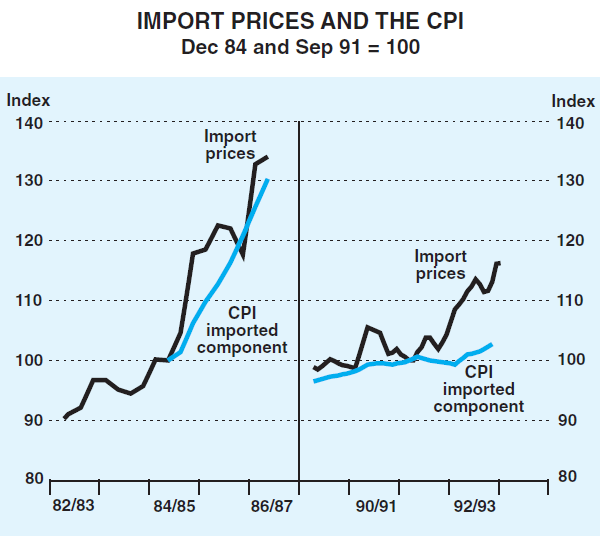
Over the two years to June 1993, the Australian dollar declined by about 17 per cent in trade-weighted terms. The corresponding increase in measures of import prices ‘across the docks’ has been about 14 per cent. To date, the flow-through into retail prices has been slow and muted, particularly when compared with the experience of the mid 1980s. The prices of imported items in the CPI rose by only 3.0 per cent over the year, contributing around ⅓ of a percentage point of the 1.9 per cent rise in the CPI. This slow flow-through reflects weak demand and a competitive sales environment in which cost savings are being found elsewhere to help margins.
Some price increases are, however, still in the pipeline. In the cases of some key products – for example, motor vehicles – the process of raising retail prices to reflect the lower exchange rate is underway, and is likely to continue over the next year or so. The falls in the exchange rate in recent months will put added upward pressure on wholesale import prices, and the flow-through to retail prices is expected to be greater in 1993/94 than last year.
Absorbing these once-off impacts without being pushed off course on the medium-term objective of low inflation requires that inflationary expectations remain low, and that temporarily higher ‘headline’ rates of CPI inflation not form the basis for higher wage claims. Higher import prices are the mechanism by which falls in national income from lower commodity prices are shared across the economy, while income tax cuts and other measures would compensate many for rises in indirect taxes.
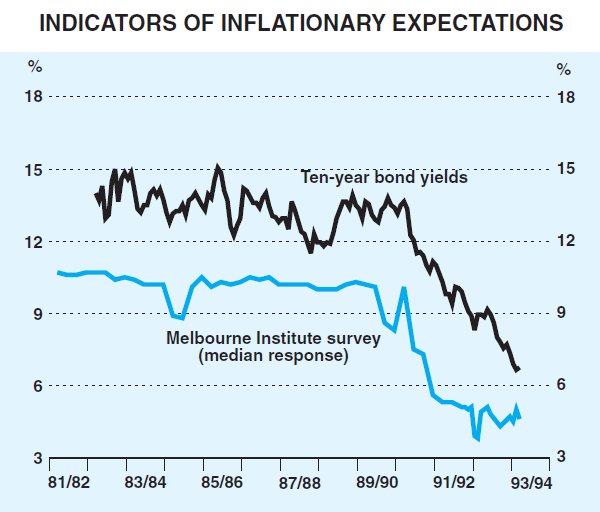
To this point, the indirect tax measures proposed in the Commonwealth Budget and recent falls in the exchange rate have not had a discernible adverse impact on measures of inflationary expectations, although the continual downward adjustment to expectations which has characterised recent years appears to have ended for the time being. Formal forecasts for inflation over the next year or two are centred on 3 to 3¼ per cent, little changed from six months ago. The median response to the Melbourne Institute's survey of inflation expectations of consumers over the next year remains, as it has traditionally done, somewhat higher, at 4½ to 5 per cent.
At this stage, wage pressures appear to be minimal, at least in the private sector. Private sector ordinary time earnings grew by 1.1 per cent over the year to May, much less than the 3.0 per cent rise recorded in the public sector (reflecting wage rises under the Australian Public Service agreement). With increasing labour productivity, unit labour costs were flat over the year to June.
Enterprise agreements involving about 12 per cent of wage and salary earners have been registered with the Industrial Relations Commission. In the metals industries, a small number of firms have started negotiations on a second round of increases which generally involve wage rises of 6 per cent over the next two years. These increases are termed ‘economic adjustments’ and the extent of any productivity offsets is unclear.
Continued moderation in wage growth is needed if recent gains in international competitiveness are to be maintained, and if inflation is to be kept low in the context of stronger recovery in output and employment and the additions to employers' labour costs as a consequence of the Superannuation Guarantee Charge.
Balance of payments and commodity prices
The extreme volatility exhibited by balance of payments statistics in the early part of 1993 has subsided in recent months. The current account deficit appears to be running at a little over $1.3 billion per month, just above the monthly average for 1992/93, but just under the projected average for 1993/94.
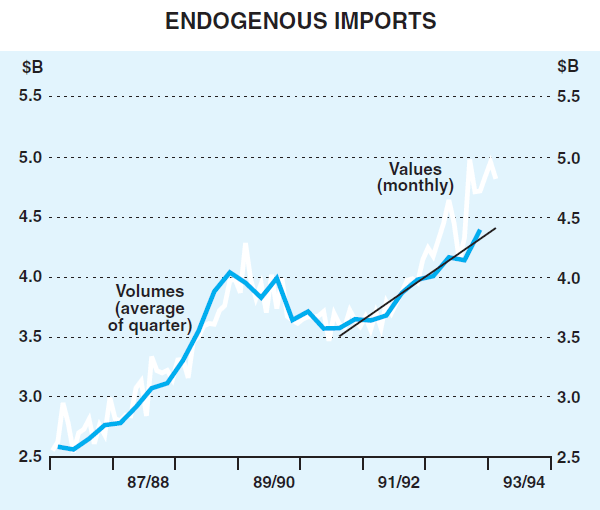
The gradual pick-up in domestic activity and the weakness of the world economy continue to shape trends in the current account. Import volumes have been boosted by the expansion of domestic spending. The value of imports has grown more rapidly, as a result of the boost to import prices coming from a lower exchange rate. Export volumes have been constrained by subdued external demand but are still growing. The continued growth in exports (and the broadening of the export base) in the face of weak demand and the relative strength in import volumes reflects the growing internationalisation of the Australian economy.
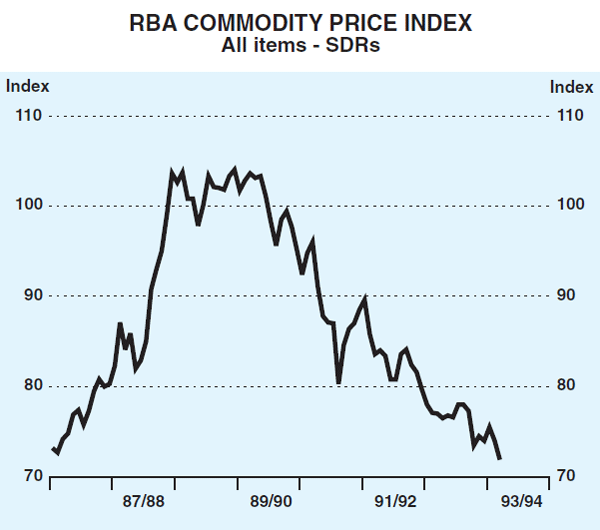
The on-going weakness in the world economy has seen further falls in commodity prices. Commodity prices fell through August and the first half of September, after being relatively steady for some months. In the three months to September, the Reserve Bank's Commodity Price Index (in SDR terms) fell by almost 3 per cent, to be about 30 per cent below the peak in June 1989. A sustained increase in commodity prices is dependent on stronger growth in the world economy than is currently in sight.
Net foreign liabilities increased to $223 billion (55.6 per cent of GDP) at the end of June. Net foreign debt was $172 billion (42.9 per cent of GDP), an increase of about $20 billion on a year earlier; valuation effects flowing from the weaker exchange rate contributed almost $7 billion of this rise. The interest burden on Australia's net foreign liabilities has fallen in the past few years on the back of the global fall in interest rates; debt service payments represented 12.3 per cent of total export income in 1992/93, compared with 21.0 per cent in 1989/90.
Public sector finances
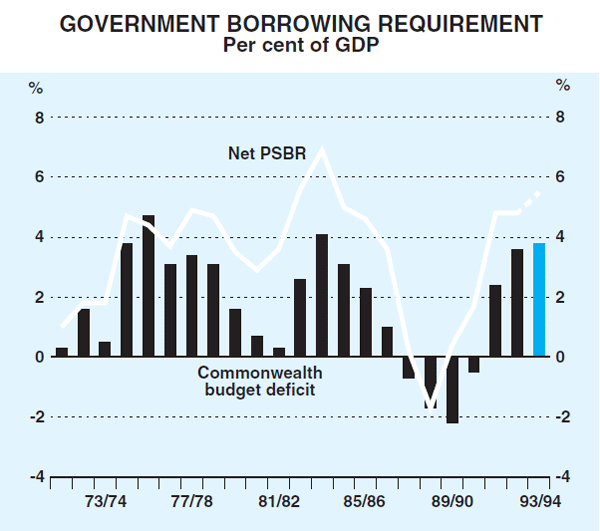
The 1993/94 Commonwealth Budget provides for a deficit of around $16 billion, or 3.8 per cent of GDP. This compares with a deficit of 3.6 per cent of GDP in 1992/93 and an earlier peak of 4.1 per cent in 1983/84. The Budget provides a further small stimulus to the economy. Real growth in outlays (excluding asset sales) of about 4 per cent is projected, compared with 6.6 per cent in 1992/93.
The Budget estimates, together with information from the recent round of State budgets, suggest that the overall Public Sector Borrowing Requirement in 1993/94 could amount to 5½ per cent of GDP, compared with 4¾ per cent in 1992/93.
The most important aspect of the Budget is its broad focus on winding back public sector deficits in coming years. This medium-term fiscal thrust is critical to enhancing the nation's savings and, over time, reducing our dependence on overseas borrowings.
Financial markets
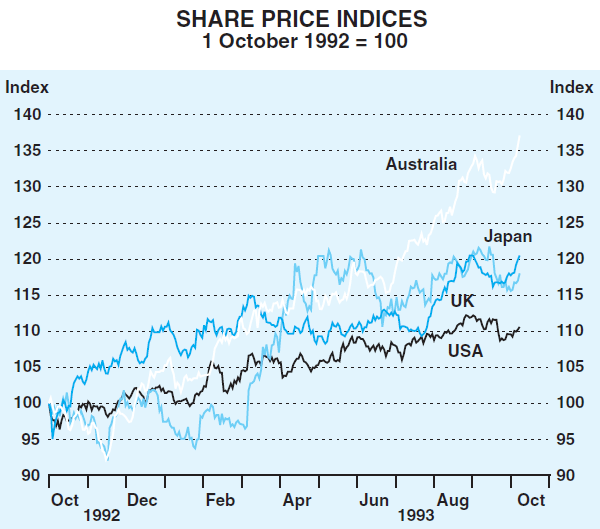
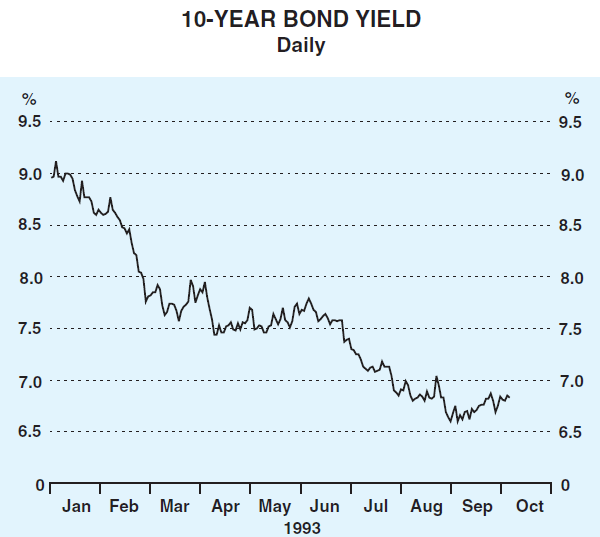
The Budget became a focal point for financial markets during the September quarter. Confidence improved in the weeks leading up to the Budget, as early indications of the Government's likely fiscal strategy were well received. This positive sentiment, helped by a rise in gold prices, was reflected in the Australian dollar which, between end June and mid August, rose by about 2 per cent in both trade-weighted terms and against the US dollar. The firmer exchange rate, and the release of the June quarter CPI pointing to continuing low inflation, led to a rally in the bond market over this period. Yields on 10-year securities fell by 0.8 of a percentage point, to 6.8 per cent, between late June and the time the Budget was delivered on 17 August. Share prices also rose very strongly (by about 10 per cent) in this period.
The better climate in foreign exchange and bond markets that emerged in July, and the continuing good performance on inflation, provided an opportunity to ease monetary policy. Official cash rates were lowered by 0.5 of a percentage point to 4.75 per cent on 30 July. Bill yields had declined in anticipation of the easing, and were at a discount to cash throughout July.
Subsequent market reaction to the easing was favourable, with bonds and the exchange rate strengthening further. The exchange rate was helped in this period by renewed volatility in European financial markets, which resulted in some ‘safe-haven’ demand for Australian dollars.
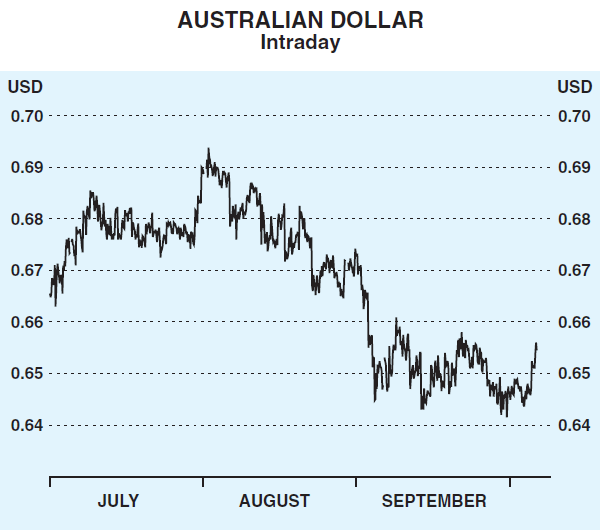
The exchange rate showed little net change in the week or so after the Budget, but started to fall in late August when the political obstacles to the Budget's passage through the Senate became apparent. The back-drop of weak commodity prices did not help. There was a particularly sharp fall in the exchange rate in early September as the attitude to the Budget of the non-Government political parties hardened. The exchange rate reached a new low in trade-weighted terms of 47.1 on 14 September, down by 5 per cent from the level at the time the Budget was delivered. The heaviest selling was in offshore markets, particularly in the United States, but also in Japan.
The Bank intervened during the month or so after the Budget to steady market conditions. Virtually all the sales of $A1.7 billion of foreign exchange it made during the September quarter occurred in this period, during episodes of heightened political uncertainty. This scale of intervention was about the same as in the previous quarter, and a little larger than in the March quarter.
Comments by the Governor, in mid September, that the phase of falling interest rates in Australia was coming to an end and that interest rates would be raised if foreign exchange market conditions warranted, provided some support for the exchange rate. The Government's decision to modify some tax measures and put these to the Senate in a number of separate bills also improved the mood temporarily. As it became apparent that no clear solution to the impasse was imminent, however, the exchange rate fell to US64.2 cents on 29 September, its lowest level against the US dollar since November 1986. The $A ended the quarter at US64.5 cents, or 47.3 in trade-weighted terms. These levels represented falls of 4 per cent and 5 per cent, respectively, over the quarter.
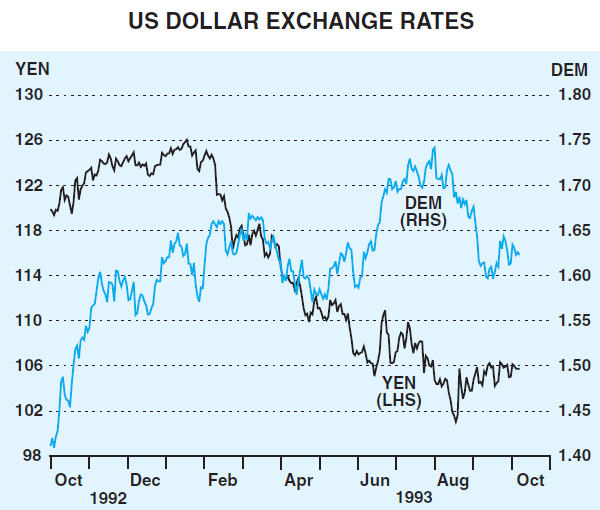
The larger fall in trade-weighted terms reflected the fall in the US dollar against other major currencies during the quarter. The US dollar weakened particularly against the yen in the first half of the quarter, falling to an historical low of 100.4 by mid August, a fall of around 20 per cent since February when its depreciation against the yen began. The main factor was continuing trade tensions. The US dollar later recovered some ground, on aggressive intervention by the Bank of Japan and the Federal Reserve and the easing of monetary policy in Japan. Against the German mark, the US dollar weakened by about 5 per cent over the quarter as the Bundesbank moved more slowly than expected to ease monetary policy.
The bond market in Australia initially weakened after the Budget, on the announcement of the larger-than-expected forecast pick-up in inflation. However, subsequent assessments that this forecast could be on the high side, as well as the markets' view that the deficit-cutting strategy was credible, saw bond yields resume their decline. Yields on 10-year bonds fell below 6.6 per cent briefly in early September, their lowest level since 1973. The subsequent exchange rate weakness and the political uncertainties pushed yields up from these lows, and the yield on 10-year bonds at end September was 6.8 per cent, still down by a net 0.8 of a percentage point over the quarter. The share market closed off its highs, although the very strong performance over the first two months of the quarter meant that share prices over the quarter as a whole were up by 13 per cent.
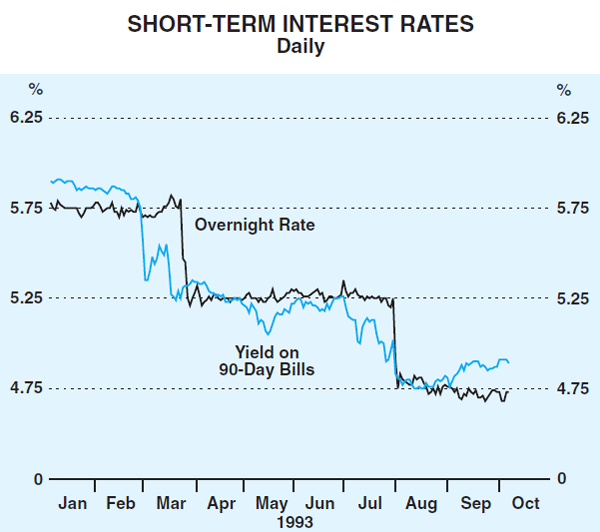
Short-term interest rates also tended to move higher after the Budget as markets came to the view that prospects for further easing in monetary policy were diminishing, while the possibility that policy might need to be tightened was increasing. Yields on 90-day bank bills rose above the overnight cash rate to end the quarter at 4.9 per cent. This rise meant that over the quarter they fell by only 0.3 of a percentage point, less than the fall in the cash rate. The rise in yields on bill futures contracts was more marked; yields on December contracts ended at 5.15 per cent, while those on March contracts ended at 5.3 per cent.
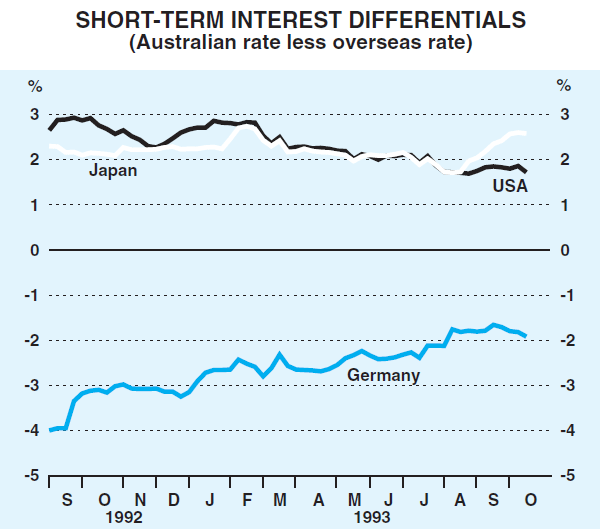
While domestic interest rates fell during the quarter, interest differentials moved in favour of Australian dollar assets, most noticeably against yen-and mark-denominated assets. The differential on Australian short-term securities rose by 0.2 of a percentage point against corresponding Japanese assets and by 0.5 of a percentage point against German assets, reflecting the easings of monetary policy in those countries.
Monetary and credit conditions
Credit conditions eased a little further in the September quarter. The easing in monetary policy in late July saw intermediaries' interest rates fall. Major banks cut their business indicator rates by 0.5 of a percentage point, in line with the Bank's request that lending rates for business borrowers fall by at least the reduction in official rates. The predominant rate for large borrowers is now 9.0 per cent, and 9.25 per cent for small to medium-sized borrowers. Special low-interest offers to small business borrowers continue to be made, with interest charges about 1½ per cent less than those which normally apply.
Banks reduced the standard variable rate on owner-occupied housing loans by 0.75 of a percentage point, more than the fall in cash rates, to 8.75 per cent. Discounts still apply for up to the first 12 months of new loans; the range of the 12-month rates is 5.5 to 7.0 per cent.
There was increased competition in the pricing of personal loans in the quarter, with one bank substantially reducing interest rates in this area. Banks also started to announce reductions in credit card interest rates and the introduction of annual fees; this followed the removal, on 1 August, of restrictions on banks charging card fees.
Deposit rates of intermediaries were also reduced but by generally less than the cut in cash rates and by less than the reductions in business indicator and housing rates.
Credit provided to the private sector by financial intermediaries continued to expand a little faster during the quarter, maintaining the firmer trend seen in the first half of the year. In August, aggregate credit was 2.7 per cent higher than a year earlier. As has been the case for the past year or more, this expansion was due entirely to borrowing for housing; other personal credit remained flat while business credit outstanding fell again.
| February 1993 | May 1993 | August 1993 | |
|---|---|---|---|
| Currency | 6.2 | 6.0 | 6.4 |
| M1 | 10.7 | 15.7 | 16.1 |
| M3 | 9.1 | 4.0 | 4.0 |
| Broad Money | 3.5 | 4.5 | 1.6 |
| Credit | 1.6 | 4.9 | 3.8 |
| – housing | 16.5 | 18.3 | 21.0 |
| – personal | −4.1 | −1.0 | 0.9 |
| – business | −4.2 | −0.5 | −4.3 |
With the low levels of deposit rates that have emerged over the past two years, portfolios are being adjusted in search of higher rates of return, in particular through exposure to equities. This trend – which is occurring worldwide – is helping to push up share prices, and companies have been raising new equity. New equity issues were strong in each of the three months to September. These issues included the floats of a small number of large companies but also of a large number of smaller companies. Part of the proceeds of equity raisings is being used to retire debt, though companies' holdings of financial assets have also been rising recently. The ongoing reduction in leverage and rebuilding of financial assets has substantially improved the health of corporate balance sheets.
Growth in the broad monetary aggregates, M3 and Broad Money, generally remains subdued, consistent with the modest demands of intermediaries for funds to finance credit expansion. Growth in the narrower M1 continues to be boosted by the on-going consolidation of deposit products. Recent monthly movements in M1 and, to a lesser extent, M3 and Broad Money, have also been affected by the short-term churning associated with the proceeds from equity issues. Currency continues to grow broadly in line with nominal spending, at an annual rate of around 6 per cent.