Bulletin – April 1994 The Economy and Financial Markets in the March Quarter
- Download 644KB
Earlier signs that the Australian economy was picking up pace have been reinforced over recent months. Various indicators suggest that output is expanding at about 4 per cent per annum. With this faster growth has come a continuation of the rise in employment which began last September, and a gradual reduction in the rate of unemployment. Corporate profitability and confidence are also stronger. The external economic environment is still not strong, but for the most part is no longer worsening, and is likely to show some modest improvement over the coming year. These and other factors are likely to encourage robust domestic expansion during 1994.
In the United States – where the recession was the least severe and the recovery is most advanced – the Federal Reserve has moved to raise short-term interest rates from the very low levels of the past year and a half. This change severely jolted international financial markets, as investors re-positioned themselves in light of what they saw as the end of a long phase of falling long-term interest rates. Long-term interest rates have moved up sharply in a number of countries, including Australia; in contrast to other episodes of nervous financial markets, however, the Australian dollar has held firm on this occasion.
Australia's underlying inflation remains around 2 per cent and the prospects for another year of low inflation during 1994 appear good at this stage, with surplus capacity serving to dampen upward price and wage pressures and a stronger exchange rate winding back some of the earlier potential for prices to rise. With inflation contained, the monetary policy settings in place since last July were maintained during the March quarter. Those settings remain appropriate at present, and so long as the economy continues to grow without threatening an upsurge in prices and wages.
The International Economy
A divergence in performance is still apparent amongst the major regions, with North America and the bulk of Asia recording solid growth, but Japan and most of Europe yet to recover from recession.
In Japan, real GDP fell by 0.6 per cent in the December quarter, more than reversing the rise in the September quarter. This meant there has been no net rise in output in Japan since late 1991, the longest such period in the post-war era. The indicators available so far for the early months of 1994 suggest that activity may be bottoming out, although any significant pick-up seems some time off. New orders, retail sales and housing starts all rose in January, and industrial production rose further in February but remains at lower levels than a year earlier. The Bank of Japan's February Tankan survey reports that business confidence remained at the very low levels reached in late 1993; this reflects a number of factors, including the slackness in consumer spending, recent high yen/$US exchange rates, and on-going political uncertainties. Consumer prices rose by 1.1 per cent over the year to February.
Elsewhere in East Asia economic growth remains strong. Industrial production in China was 33 per cent higher in January than a year earlier, and foreign investment remains at high levels. In Singapore, real GDP grew by 10.7 per cent over the year to December 1993; this strong growth is broadly based and has contributed to a budget surplus now running at over 10 per cent of GDP, despite recent cuts in corporate tax rates.
Export expansion has underpinned rapid growth in Malaysia and Indonesia. Growth in South Korea is yet to regain the strength it had before the policy tightening in late 1991. Real interest rates remain high and reforms to corporate regulation have caused temporary disruption to some commercial activity. Power shortages have disrupted economic activity in the Philippines, but this problem appears to be diminishing as new plant is brought into operation. The Philippines government agreed recently to implement a reform program negotiated with the IMF.
| South Korea | 6.5 | Sep qtr |
|---|---|---|
| Hong Kong | 5.6 | Sep qtr |
| Taiwan | 6.1 | Dec qtr |
| Malaysia | 8.1 | Sep qtr |
| Singapore | 10.7 | Dec qtr |
| Philippines | 2.1 | Sep qtr |
|
Source: National Sources. |
||
Output in the United States grew by an unusually strong 1.7 per cent in the December quarter, bringing the increase over the year to 3.1 per cent. Activity in the March quarter is expected to have been dampened by weather conditions and the effects of the Californian earthquake. In underlying terms, however, the expansion in the United States remains on a firm footing, and forecasts for growth in 1994 have tended to move up in recent months. Since the trough in March 1991, real GDP has expanded by 8 per cent; over the same period employment has risen by 3 per cent and business investment by 20 per cent.
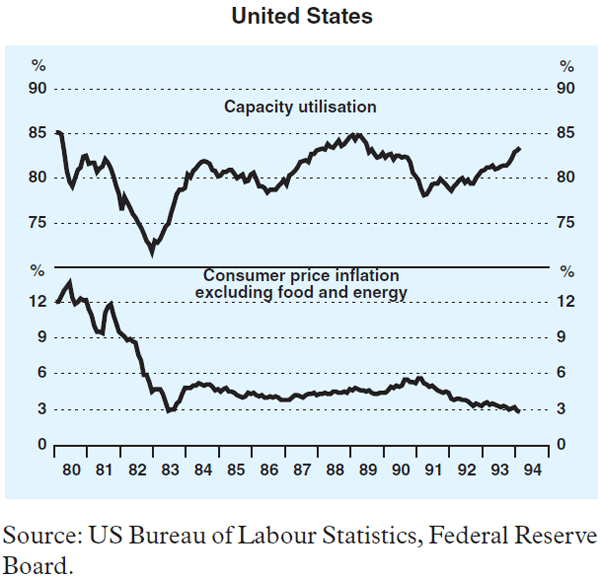
Inflation continued to ease into the early months of 1994. The 2.5 per cent increase in consumer prices over the year to February was the lowest since early 1987. Excluding food and energy prices, the rise was 2.8 per cent, the lowest on this basis for over two decades. Wholesale prices have been virtually unchanged over the past year and unit labour costs, if anything, have tended to fall.
Indicators suggest that the US economy is now operating with relatively little spare capacity. The Department of Commerce's measure of capacity utilisation in the manufacturing sector stood at 83.4 in February, close to its high point in the late 1980s. In the same month, the unemployment rate fell to 6.5 per cent, about a percentage point above its low point in the 1980s. Despite the good inflation performance over the past year, the conjuncture of high and increasing capacity usage with relatively low levels of short-term interest rates led the Federal Reserve to increase its key interest rate in February and again in March.
In the United Kingdom the economy has continued to recover gradually, while the trough of the recession appears to have been reached in France and Italy during 1993. Output has stopped falling in some of the Eastern European economies, although not in most of the former Soviet republics.
| latest | one year ago | |
|---|---|---|
| Western Germany | 1.1 | −11.8 |
| France | 0.1 | −3.9 |
| Italy | 1.5 | −4.4 |
| United Kingdom | 4.0 | 1.8 |
| Spain | 3.5 | −12.0 |
| Netherlands | 0.7 | −3.1 |
| Poland | 4.7 | 8.3 |
| Hungary | 9.0 | −6.0 |
| Ukraine | −13.1 | −4.5 |
|
Source: National Sources and OECD. |
||
A more vigorous European economic recovery awaits a return to solid growth in Germany. While the period of sharply declining output in western Germany came to an end in the middle of 1993, signs of growth are still relatively few. The available indicators for the March quarter suggest little change in output, which fell back slightly in the December quarter after small increases in the preceding two quarters. The unemployment rate reached 8.3 per cent in March, compared with 7.0 per cent a year earlier, although the recent rise in job vacancies suggests that the rate of increase in unemployment could slow in 1994.
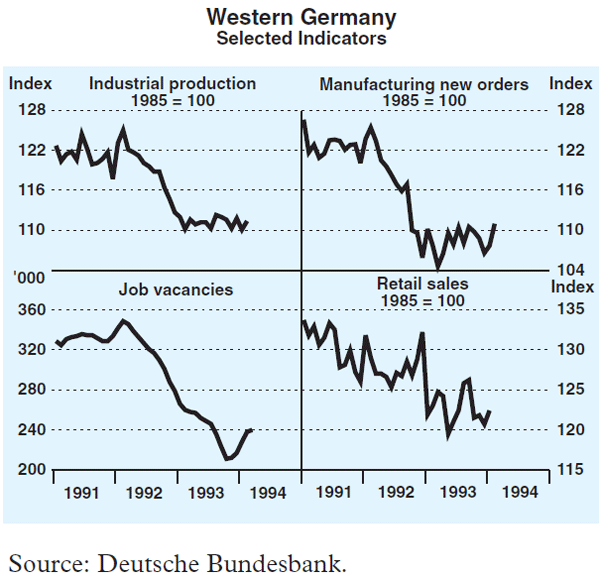
German inflation has been falling, with consumer prices increasing at rates around 3 per cent recently, rather than the 4 per cent that prevailed for much of 1993. Prospects for further improvements have been helped by moderate wage settlements; in March, the pace-setting IG Metall union put aside planned industrial action and agreed to a 2 per cent increase. Allowing for reduced bonuses, this amounted to very little if any increase in labour costs for employers. Similar deals have now been accepted by unions covering the public sector and construction industries. Against this background, the Bundesbank has allowed a further slight fall in short-term interest rates. Even so, recovery is likely to be relatively subdued for some time, given the structural problems, including the budget deficits resulting from reunification and high unit labour costs, to be overcome.
The Australian Economy
Economic Activity
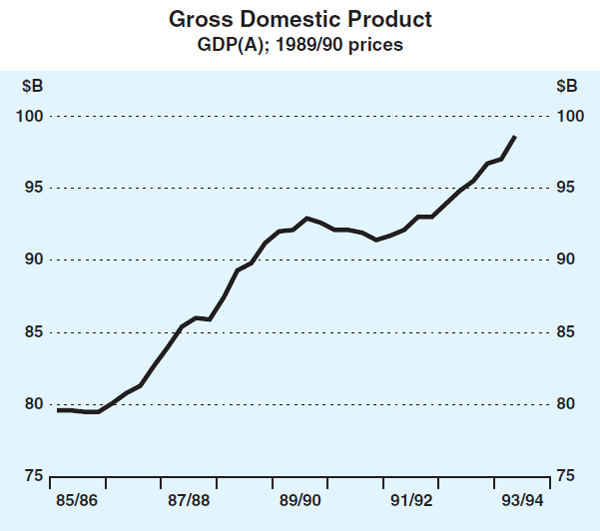
On the average measure, real GDP rose by 1.7 per cent in the December quarter, bringing the increase over the year to 4 per cent. Expenditure on GDP grew by 2.5 per cent in the quarter, driven by strong growth in consumption expenditure, a further rise in net external demand, and a run-up in stocks. Public sector expenditure, however, was flat, after a large fall in the September quarter, while business fixed investment was also lacklustre; spending on non-dwelling construction fell while plant and equipment spending recorded only a small increase.
The production accounts showed a further sharp rise in manufacturing production. Output rose by around 9 per cent over the course of 1993, and is now 12.5 per cent above the trough in mid 1992. The ACCI Westpac survey of manufacturers suggests a further expansion in the March quarter. Exports are a continuing source of growth for this sector: manufactured exports rose by 16 per cent in real terms over the year to the December quarter, and are now equivalent to around 23 per cent of total manufacturing sector GDP, up from 17 per cent in 1990/91. Other sectors showing robust growth are electricity, gas and water, communications, community services and recreational services; mining output, on the other hand, has fallen by 1.3 per cent over the past year.
Households
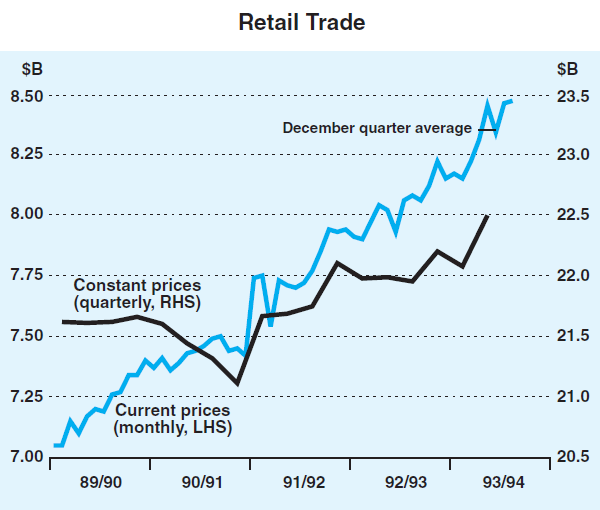
Consumer spending picked up in the final months of 1993, growing by nearly 2 per cent in real terms in the December quarter. This trend has continued into early 1994, with retail trade in nominal terms rising by 1.5 per cent in January, and holding this higher level in February. Sales of motor vehicles have also recorded consistent strength in recent months, after a flat performance over the past two years. Registrations of passenger vehicles in January and February were about 8 per cent higher, on average, than in the December quarter, with both fleet and private buyers stepping up their purchases.
The stronger trend in consumer spending owes something to both more consistent income growth and higher confidence. Real household disposable income rose by 0.6 per cent in the December quarter and by about 2 per cent over the year to December, and these figures are unlikely to reflect fully the effects of higher employment growth and the November 1993 tax cuts. Confidence among consumers, as measured by the Melbourne Institute's Index of Consumer Sentiment, was close to the all-time high recorded in January 1984.
Higher levels of confidence, and strong competition among lenders, has also been reflected in further borrowing by households. After a long period of decline, credit extended to persons for non-housing purchases has grown over recent months, in line with stronger purchases of some consumer durables. The same factors have seen borrowing for the purchase of houses continue at a rapid rate. The value of housing finance commitments to owner occupiers in January was down from its December peak, but still some 30 per cent higher than a year earlier; commitments to investors in housing were 66 per cent higher in January than a year earlier. These numbers probably reflect some refinancing (or ‘churning’), but housing credit outstanding rose by 21 per cent over the year to February.
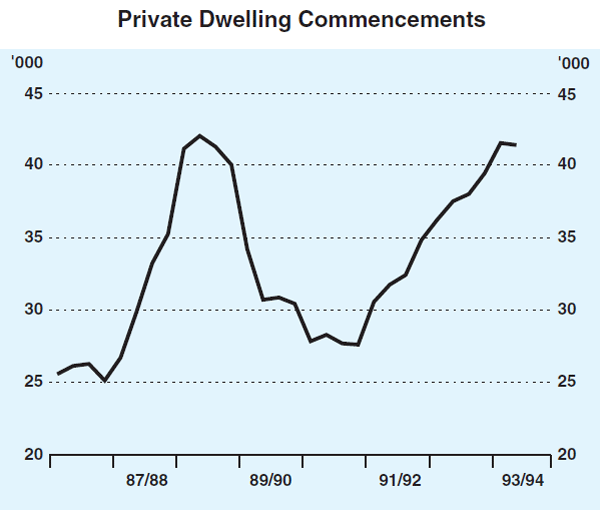
The strong housing lending has helped to prolong the dwelling construction cycle, with commencements of new dwellings remaining near historical highs in the December quarter and likely to do so again in the March quarter. Before falling in February, the strength of investor interest had pushed approvals for multi-unit dwellings, especially in NSW, to record levels.
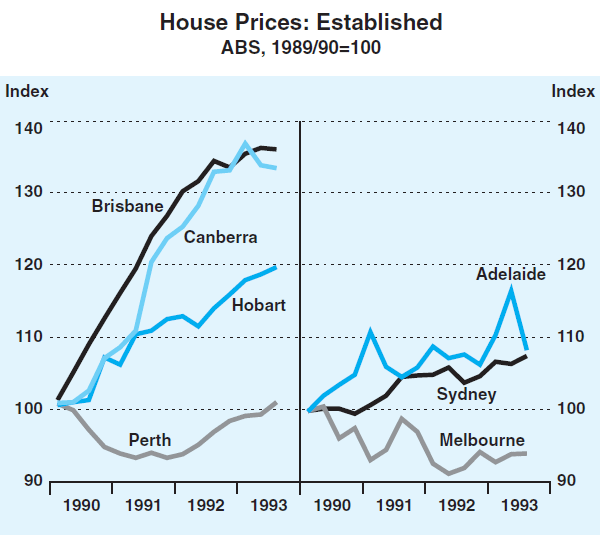
Despite the strong demand for housing, indicators of established house prices across Australia continue to grow only slowly. The strength of the upturn has differed among the States, however, and price movements have reflected this. Housing activity in the early stages of the recovery grew fastest in Queensland and the ACT and house prices grew more rapidly in those areas over this period. Elsewhere, price increases to date have been relatively modest. Rental vacancy rates, which are already relatively high in some areas, could rise further over the months ahead on the back of continuing high construction rates and lower rates of immigration; that situation, should it develop, would have a restraining influence on rises in house prices.
The Reserve Bank has been keeping a close watch on housing lending recently, and has held consultations with the banks to improve its understanding of the strength of the demand for housing finance and the banks' responses to that demand. Without threatening the banks with interest rate increases or other measures, the Bank indicated that it would be concerned if housing loans outstanding were to continue to grow at a rate of more than 20 per cent, as they did over the year to February. Such a rate of lending could not go on indefinitely without causing house prices to rise sharply and encouraging a return of asset price expectations of the kind last seen in the late 1980s. To this point at least, however, there is no clear evidence that such a situation is about to re-appear.
Businesses
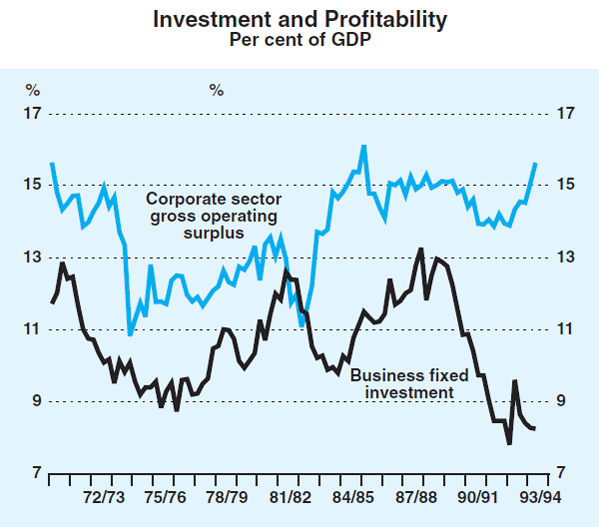
Although investment has still to pick up, the business sector generally is in a healthy condition. According to National Accounts estimates, the corporate gross operating surplus rose by 5 per cent in the December quarter and by 15 per cent over the year to December. Allowing for interest payments, the increases were even higher, at 7 and 24 per cent respectively. Companies' interim results provide further evidence of strong corporate profitability. Reductions in interest rates and lower corporate tax rates have been important factors in this improvement but higher sales are now also contributing, and should help to generate further good profits over the year ahead.
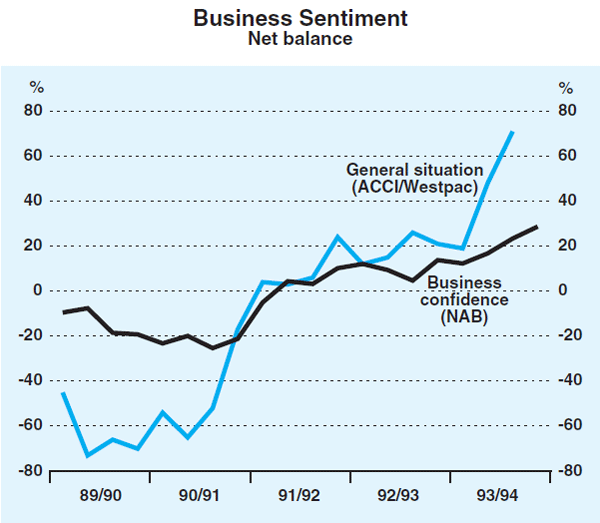
Buoyant profit results have been accompanied by a further improvement in business sentiment. The manufacturing sector continues to be an area of particular strength, with respondents to the latest ACCI/Westpac survey giving their most positive assessment of business conditions and prospects for thirty years, but the strengthening in confidence is fairly broadly based.
The balance sheet position of companies has continued to improve. Net credit provided to business by financial intermediaries has declined further in recent months. In some instances, this process of reducing debt has been accelerated by raisings on equity markets; equity raisings by non-financial corporations in the first eight months of 1993/94 were more than double those in the corresponding period last year.
The improvement in profits, confidence and financial structure has still to be translated into substantial increases in net investment. Gross expenditure on plant and equipment was little changed in the December quarter, and while it has expanded by about 12 per cent in underlying terms since its trough, present levels of investment appear to be only slightly above the depreciation rate of the capital stock. The ABS and other surveys of capital expenditure suggest that investment in plant and equipment will strengthen in 1994/95 as more existing capacity is taken up. Spending on building and structures appears to have stopped falling, but the ABS capital expenditure survey, and other information, suggests that any growth will be weak for some time.
By industry, investment spending during 1993 was concentrated in the mining sector and, to a lesser extent, in manufacturing; finance sector investment fell during the year. For 1994/95, the outlook for manufacturing investment looks stronger than for mining investment.
Labour Market
The firmer trend in the labour market seen in the latter months of 1993 continued into the New Year. Employment rose by a further 35,000 in the March quarter, and this was associated with a further slight reduction in the rate of unemployment, to 10.3 per cent in March. The cumulative increase in employment since August 1993 amounts to over 150,000 (or 2 per cent). About half of this increase has been in full-time jobs, for both males and females.
| 1989/90 | 1990/91 | 1991/92 | 1992/93 | Sep Qtr 1993 | |
|---|---|---|---|---|---|
| Change in Financial Assets | −5.1 | −5.2 | −3.3 | 7.6 | −0.4 |
| Change in Liabilities | 24.5 | 9.6 | 4.1 | 4.0 | 1.7 |
| – Debt | 24.3 | 9.5 | −8.8 | −8.9 | 0.3 |
| – Equity | 0.9 | −0.6 | 14.1 | 9.2 | 1.4 |
| – Other | −0.8 | 0.6 | −1.3 | 3.7 | 0.0 |
| Change in Financial Position | −29.6 | −14.8 | −7.5 | 3.6 | −2.1 |
|
Source: ABS Financial Accounts. |
|||||
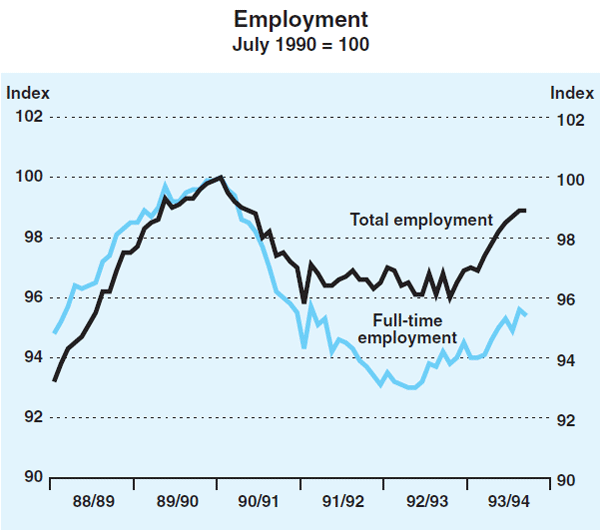
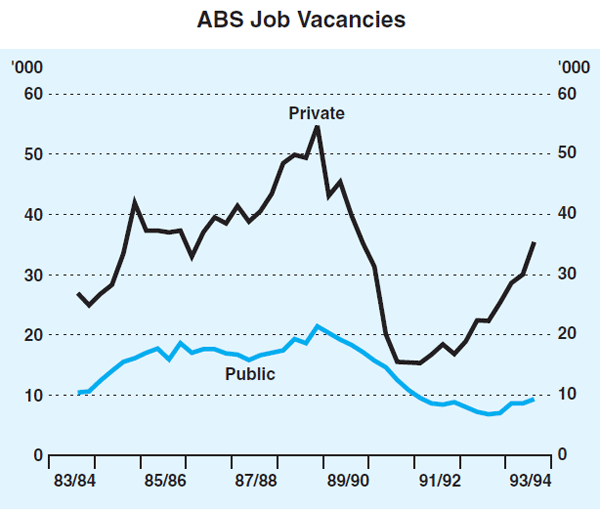
Gains in employment in recent months have not been as strong as those seen in the initial pick-up in the period from September through to November, which may have reflected a delayed response to the pick-up in activity earlier in 1993. A continued upward trend in employment is suggested, however, by measures of job vacancies, which have generally been a good leading indicator of employment. The ANZ Bank's measure rose by around 12 per cent between November and March, and by around 42 per cent over the year to March. The more broadly based ABS measure of vacancies rose by 17 per cent over the three months to February, and over 50 per cent over the year. In the private sector, vacancies have almost recovered to the levels seen in the mid 1980s. The most notable rises have been in manufacturing, wholesale and retail trade, and the services sector (including finance). Overtime hours worked increased further in the three months to February, as a result of more employees working overtime; hours of overtime per employee actually working overtime declined slightly.
On an industry basis, employment growth since August has been reasonably broadly based. Sectors recording falls in employment over this period were those where output growth has lagged behind the rest of the economy (eg. agriculture, mining, construction), or where staffing continues to be rationalised (eg. public administration and defence, and electricity, gas and water). By region, growth has been concentrated in Queensland, NSW, Western Australia and Tasmania; growth has been subdued in South Australia and flat in Victoria.
Prices and Wages
Recent information on prices suggests that inflationary pressures remain low. The Consumer Price Index rose by 0.2 per cent in the December quarter, and by 1.9 per cent over the year to the December quarter. The result was helped by a fall in world oil prices and the residual impact of the reduction in mortgage interest rates in September 1993. Net of interest charges, fresh fruit and vegetables and petrol, the increase in the quarter was 0.6 per cent.
This figure is probably still affected to some extent by the lift in wholesale sales taxes in the 1993/94 Budget. Higher import prices at the retail level also have added slightly to the CPI, driven by a rise in prices of imported cars and a seasonal increase in the cost of overseas travel. The total impact of prices of items judged to be wholly or predominantly imported has still been rather small, however, relative to the fall in the exchange rate over the past couple of years. Since September 1991, when the exchange rate began to decline, the ‘imported’ component of the CPI has risen by around 5 per cent. This relatively small impact of the lower exchange rate appears to reflect competitive trading conditions, both domestically and abroad.
Overall, the ‘underlying’ annual rate of increase in prices – the most relevant measure for monetary policy purposes – continues to be around 2 per cent.
Partial indicators for the March quarter suggest another good result, helped by lower world oil prices, which have pushed down both retail fuel prices and energy-related input costs to business during the past several months. Even excluding oil, however, manufacturing input prices fell in January and output prices were stable; the rises over the year to January were modest in both cases. With the recent rise in the exchange rate, the import price index fell in each of the four months to January, to be little changed from its level in January 1993. Apart from timber prices, which are still rising, the cost of construction materials is fairly steady in the face of quite strong demand for new housing.
Consumers' expectations of inflation over the coming year, as recorded in the Melbourne Institute survey, showed a median figure of 4.9 per cent in March, up a little from the results of the preceding several months, although not noticeably higher than the average of the past year or so. (This series consistently over-estimates actual inflation by around 2 percentage points.) The average forecast for CPI inflation in 1994 amongst forecasters surveyed by Consensus Economics Inc has come down to 2.3 per cent, from around 3 per cent three months ago. The latest forecasts for 1995 average around 3½ per cent, slightly lower than that recorded at the beginning of the year.
In the labour market, unemployment is still well above levels where significant pressures on wages would usually be expected, and on most indications unemployment would be expected to be able to fall for some time yet before serious problems emerged. Thus far, wage behaviour seems broadly consistent with this view. Ordinary time earnings of full-time adults, a measure of underlying earnings growth, fell by 0.3 per cent in the three months to November after a large rise in the preceding three months. Over the year to November, this measure rose by 3.0 per cent. The current reading on wages growth is in accord with the continuing spread of enterprise bargaining, which is now thought to cover 15– 20 per cent of wage and salary earners, although it could also be held down by changes in the industry composition of employment towards low-wage sectors. With underlying productivity rising at between 1 and 2 per cent, unit labour costs appear to have been fairly static over the past couple of years.
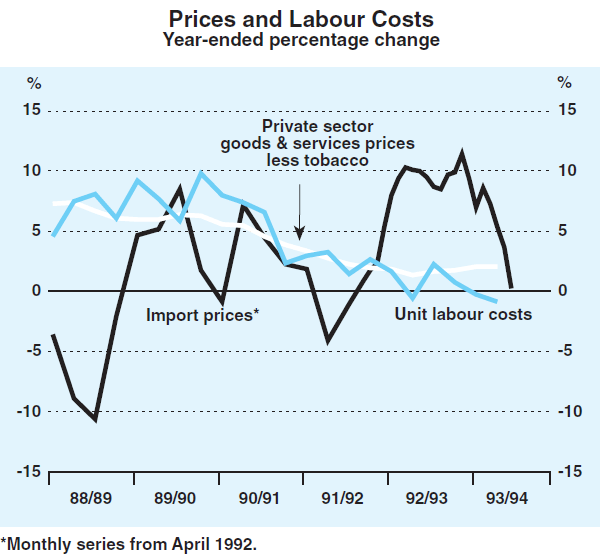
The flow through of the $8 safety net wage increase, which is now being reflected in an increase in award wage rates, and recent large wage settlements in State public sectors (particularly NSW) are likely to add to aggregate wage measures in the early part of 1994. The pace of enterprise bargaining in certain sectors could also be expected to pick up under conditions of stronger growth. The DEET survey of skilled vacancies, for example, shows increasing vacancies in the building and metal trades sectors, although the number of vacancies is still well below the peaks recorded in the late 1980s.
| 1991/92 | 1992/93 | 1993/94 | ||
|---|---|---|---|---|
| Consumer Prices | ||||
| Consumer Price Index | 1.5 | 0.3 | 1.9 | Dec qtr |
| Private sector (excl tobacco taxes) | 2.7 | 1.3 | 2.0 | Dec qtr |
| Private consumption deflator | 2.0 | 1.5 | 2.0 | Dec qtr |
| Treasury underlying inflation | 3.4 | 1.8 | 2.1 | Dec qtr |
| Producer Prices | ||||
| Manufacturing input prices | −3.7 | 4.8 | −3.2 | Jan |
| of which: | ||||
| – domestic | −4.6 | 4.2 | −4.5 | Jan |
| – imported | −2.0 | 5.9 | −0.8 | Jan |
| Manufacturing output prices | −0.3 | 2.6 | 0.4 | Jan |
| House building materials prices | −0.7 | 1.8 | 5.5 | Jan |
| Other building materials prices | 0.1 | 0.1 | 1.3 | Jan |
| Gross non-farm product deflator | 1.3 | 0.8 | 1.3 | Dec qtr |
| Import Prices | ||||
| Import price index | −1.0 | 9.4 | 0.2 | Jan |
| CPI – imported items | 1.3 | 0.4 | 3.5 | Dec qtr |
| Labour Costs | ||||
| Private sector ordinary-time earnings | 2.2 | 0.6 | 3.4 | Nov |
| Total average weekly earnings | 3.9 | 0.3 | 3.1 | Nov |
| Unit labour costs (National Accounts) | 3.2 | 0.6 | −0.9 | Dec qtr |
|
Source: Australian Bureau of Statistics. |
||||
Foreign Trade and Payments
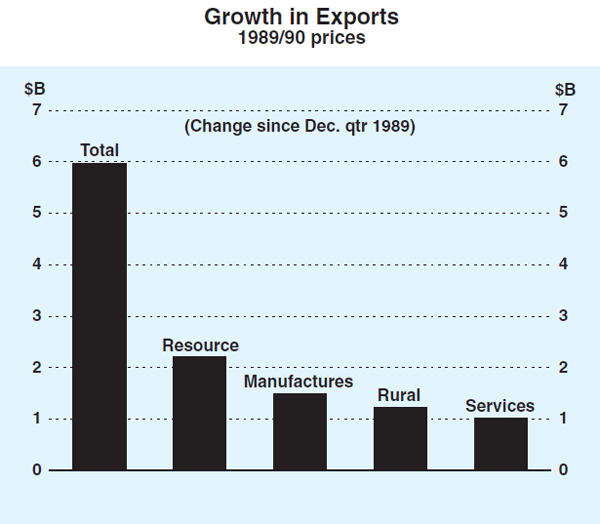
Export volumes continued their strong growth in the December quarter. Manufactured exports, which rose by 7 per cent, to be 16 per cent above their level a year earlier, have accounted for a quarter of the rise in total exports over the past four years. Rural exports also rose strongly in the December quarter (up 5 per cent), service and resource exports increased more modestly.
Over the three months to February, export values fell by 2½ per cent. These figures are affected by fluctuations in gold shipments; excluding gold, export values declined by only about ½ per cent.
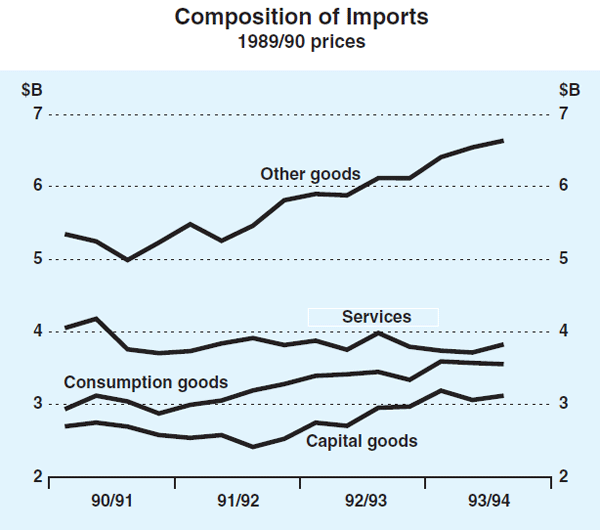
The value of merchandise imports declined in January and February after a large rise in December. Part of this change can be attributed to valuation effects flowing from the recent appreciation of the exchange rate, but part also reflects a pause in the growth of import volumes. The volume of imports of goods and services has risen by around ½ per cent in each of the past couple of quarters, following a steep rise in the June quarter 1993. As domestic spending expands, and particularly as import-intensive equipment investment picks up, the volume of imports can be expected to grow faster.
The current account deficit averaged $1.35 billion for the three months to February, little changed from the corresponding figure for the three months to November. For the financial year to date, the deficit has been running at an annualised rate of about $15.7 billion, equivalent to around 3¾ per cent of GDP.
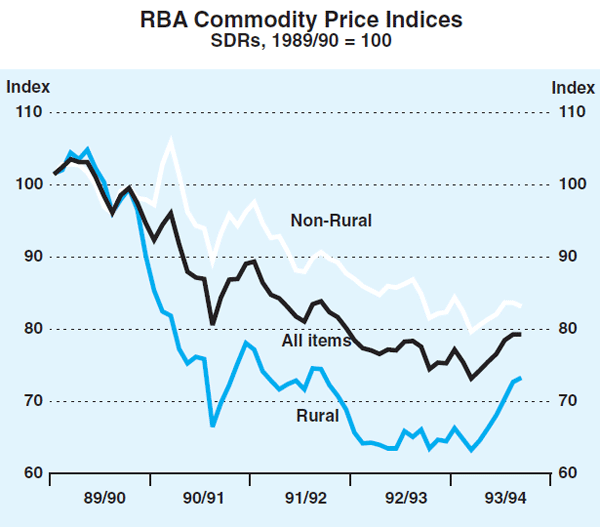
The Bank's Commodity Price Index has risen strongly in recent months and was 8 per cent above its September trough in March. Both rural and non-rural prices contributed to this pick up. Base metal prices rose particularly strongly between November and February, underpinned by signs of a stronger world economy and potential production cuts to support prices for some items; they have since fallen back a little on signs that some of the agreements to cut production of lead and zinc may not be honoured. Negotiations over recent months on contract prices for coal and iron ore have resulted in price cuts of around 8 per cent for iron ore and coking coal, and a smaller cut in steaming coal prices. The lower prices will affect the Index from April.
The value of net foreign liabilities of Australian residents rose by $9 billion over the December quarter. Net inflows of debt amounted to $1.6 billion, but the appreciation of the exchange rate and other factors reduced the value of debt outstanding by around $4 billion, so that net foreign debt outstanding fell by $2.2 billion to $172 billion (41 per cent of GDP). Non-residents continued to invest strongly in Australian equities in the December quarter, attracted by the good profit opportunities in the Australian corporate sector. Rising share prices during the latter part of 1993 also helped boost the value of Australian equity held by non-residents; net equity liabilities consequently rose by $11 billion to $72 billion (17 per cent of GDP).
Financial Markets
Developments in Australian financial markets fell into two categories in the March quarter. Initially, the bullish sentiment evident late in the December quarter took fresh impetus from a re-appraisal by international investors of Australia's economic prospects. This was in line with the improving trend in the US economy. The exchange rate strengthened, bond yields fell and share prices rose through January and into early February. In the second part of the quarter, sentiment – especially in bond and equity markets – was more fragile as conditions in US and other markets became unsettled.
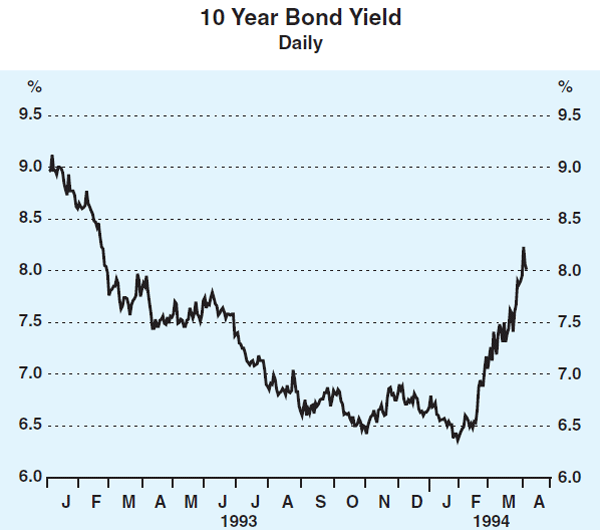
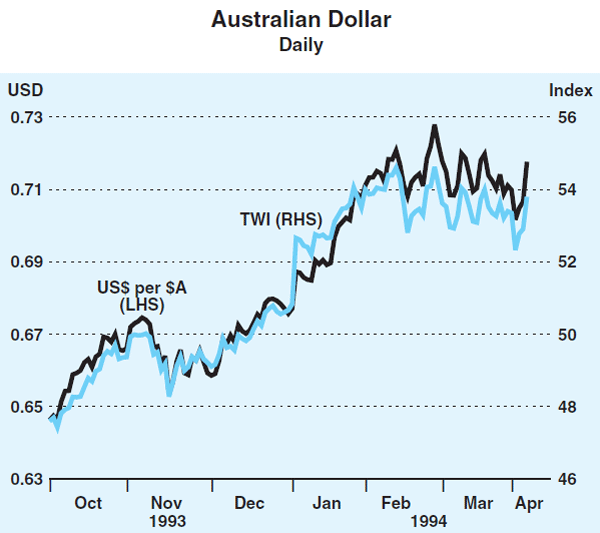
The exchange rate opened the quarter at 50.8 in trade-weighted terms and US67.7 cents. By the end of the first week of February, it had reached a TWI of 54.0 and US71.5 cents. (Part of this rise in the TWI – 0.9 index points – was attributed to the impact of a change in the method of determining the Chinese yuan exchange rate used to calculate the TWI.) The rise in the Australian dollar was associated with heavy foreign buying of Australian dollar assets, particularly shares. The All Ordinaries index rose by 6.3 per cent during January, reaching levels last recorded just before the share-market crash of October 1987. Bond yields also continued their rally. The yield on 10-year bonds fell in January by 0.3 of a percentage point to about 6.4 per cent, its lowest level for about 20 years. News in late January of the good CPI result for the December quarter was an important influence on the bond market at that time.
The climate in international markets was also favourable over this period. Share prices rose in most industrial countries and bond markets were generally buoyant, although yields moved up in Japan in conditions of uncertainty about fiscal policy and the political situation.
The tone in financial markets turned negative from early February. While the trigger point was the announcement on 4 February of a rise of 0.25 of a percentage point (to 3.25 per cent) in the target for the Fed funds rate, the underlying concern was that inflation would accelerate in the US as that economy gathered momentum. The market's concerns were aggravated by upward revisions to already strong estimates of US GDP in the December quarter and a series of partial indicators suggesting some deterioration of inflationary expectations. By mid March, yields on 10-year bonds in the US had increased by nearly a percentage point. They then rose further in late March and early April following the decision by the Federal Open Market Committee to lift short-term rates by a further 0.25 of a percentage point, and the release of data showing a very strong increase in employment.
Most measures of inflationary expectations in the US have increased in recent months, although the increases have been fairly modest. Commodity prices, which are sometimes seen as forward indicators of inflation, were also generally stronger in the March quarter. Some rise in bond yields would have been consistent with these developments, but the extent of the rise that has taken place appears to have run ahead of the indicators of future inflation which, overall, point to inflation remaining under control.
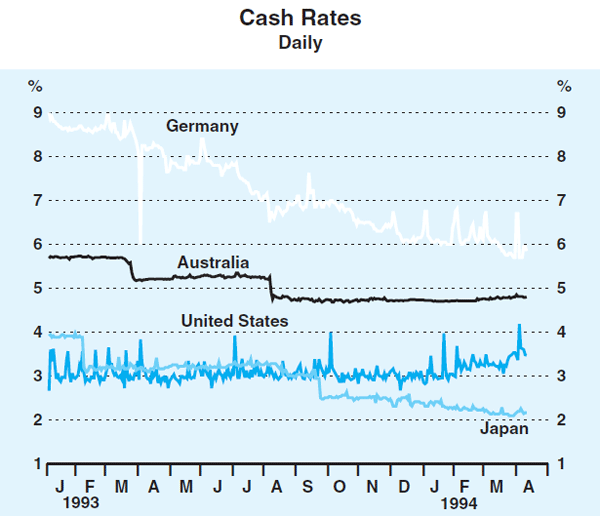
In contrast to the US, Japan and Germany eased cash rates during the quarter in line with continued weakness in their economies and signs of low inflation. Japanese cash rates fell by 0.2 of a percentage point over the quarter, while German cash rates fell by about 0.5 of a percentage point. These moves in cash rates, however, did little to bolster sagging market confidence. Bond yields in both countries tended to key off US yields. It was only towards the end of the quarter that markets started taking the different economic circumstances of these countries into account; yields in Japan and Germany fell in the last week of the quarter, notwithstanding further substantial rises in US yields.
By early April, the yield on 10-year US Treasury bonds had increased by 1 percentage point from its end-December levels, to 6.85 per cent. In Japan, they had also risen by 1 percentage point to 4.0 per cent, and in Germany, by 0.8 of a percentage point to 6.3 per cent.
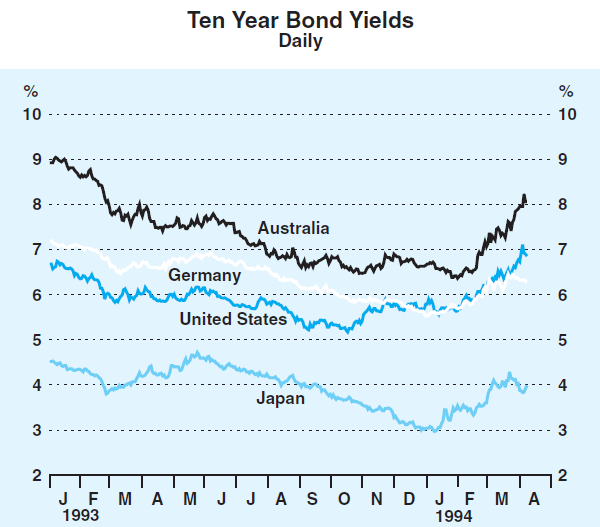
In Australia the rise in bond yields over the quarter was a little larger than in the US; this was also the experience of Canada. Bond markets in these two countries had gained relative to the US in earlier months and the movements in the March quarter restored previous relativities.
Australian bond yields started to rise sharply in early February, both in response to developments abroad and on further signs of gathering strength in the domestic economy. Overseas investors, who had been substantial buyers early in the quarter, were noticeable sellers in the second half. By early April, the yield on 10-year bonds in Australia had risen to over 8 per cent, from its end-January low of 6.4 per cent. This took yields back to the levels of early 1993. The big movements in bond yields, both up and down, in recent months have made markets less confident about what represents the ‘correct’ level of bond yields in current circumstances and more susceptible to exaggerated movements in response to news. Volatility in the Australian bond market increased sharply in February and March, as it did in most countries.
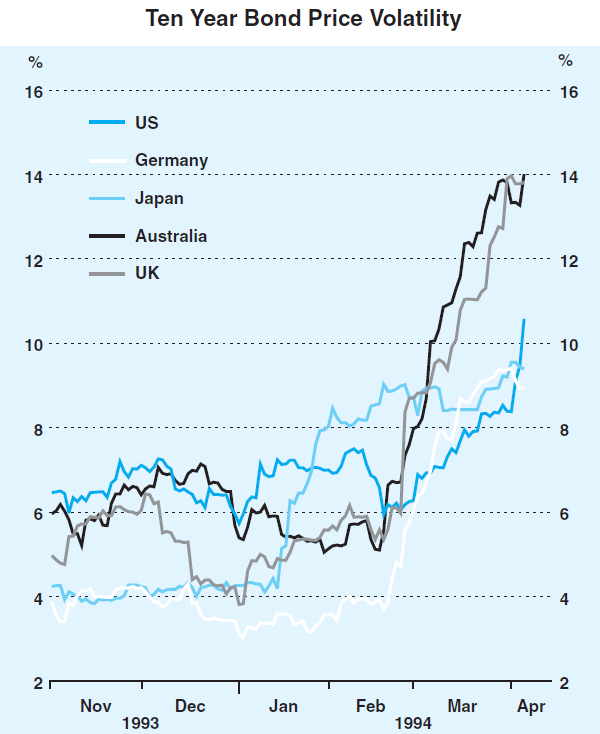
As in the US, the rise in bond yields in Australia seemed to run well ahead of changes in inflationary expectations which, as noted earlier, have been relatively small. Movements in yields on indexed bonds also suggest that the recent rise in bond yields reflects more than an increase in inflationary expectations. Indexed bond yields are quoted in real terms and therefore are not affected by inflation, yet the yield on indexed bonds has increased by about 0.75 of a percentage point in the March quarter. This suggests that factors other than inflationary expectations, such as international linkages among markets and the dynamics of the market adjusting to what has been the biggest bull run in bonds in post-war history, have been important influences on bond yields. Strong bull runs in capital markets often come to an abrupt and untidy end. Developments in bond markets are discussed further in the Attachment to this article.
The Australian dollar was affected by the uncertainty in international bond and equity markets, causing a pause in the upward movement of the exchange rate in the first half of February. Further evidence of strengthening growth in Australia in late February helped the bullish mood re-emerge for a time, and the exchange rate reached a high of 54.6 in trade-weighted terms and US73 cents on 24 February, its highest level since October 1992. Continuing instability in global markets then saw the exchange rate subside, fluctuating in a range between US70 and 72 cents during March before moving up again in early April.
Over the March quarter, the exchange rate appreciated by 2.6 per cent in trade-weighted terms and by about 3.5 per cent against the US dollar. The $A has now reversed about a third of the fall which occurred over the two years to September 1993.
The Bank did not intervene in the foreign exchange market during the March quarter. This is the first quarter it has not supported the Australian dollar since the September quarter 1991 (although purchases of Australian dollars in the previous quarter were negligible).
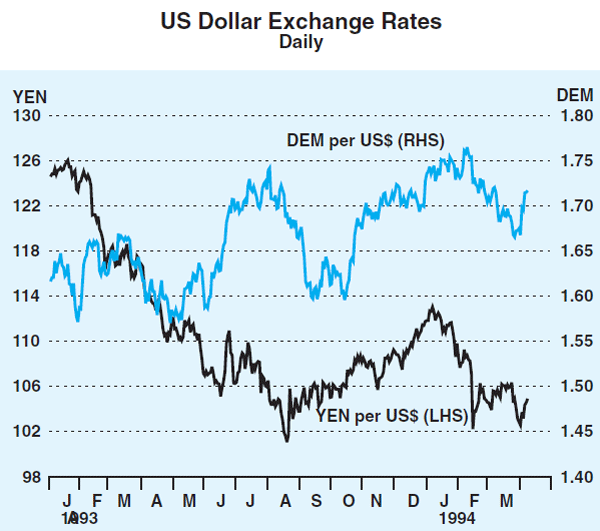
The US dollar depreciated by 8 per cent against the yen over the quarter, largely as a consequence of trade disagreements between the US and Japan. This took the US dollar back to 103 yen, close to the low point reached in August 1993; the US dollar subsequently rose to about 105 yen, following the resignation of the Japanese Prime Minister on 8 April. Against the Deutschemark, the US dollar fell by 4 per cent to 1.67 marks. This fall occurred despite the tightening in US monetary policy and appears to have reflected easings in German monetary policy being more cautious than market participants had earlier expected.
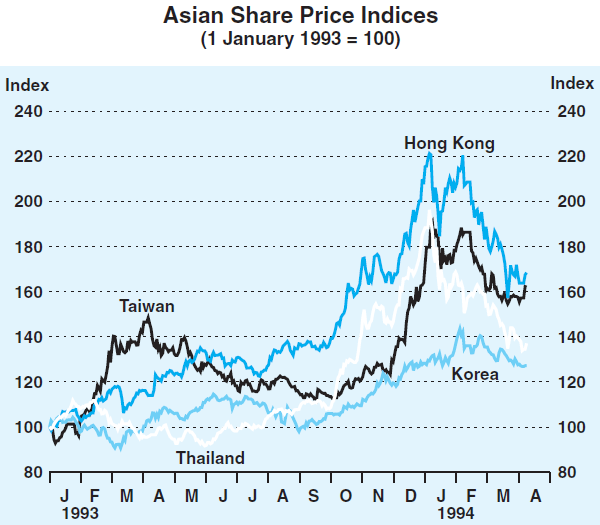
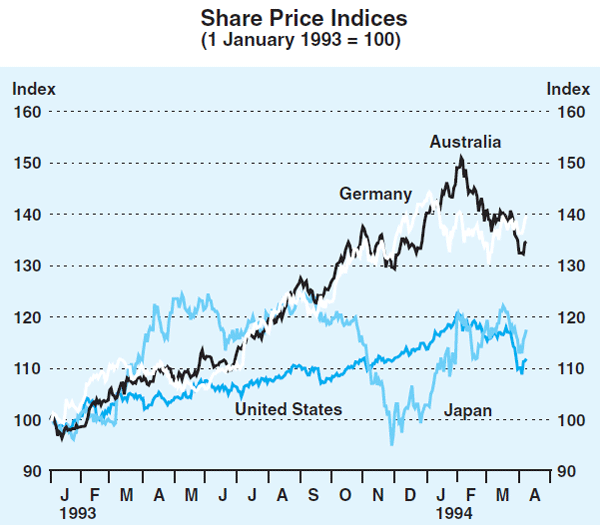
The turmoil in bond markets served to check the earlier exuberance on major stock exchanges. Over the quarter as a whole, share prices fell in most countries, Japan being the main exception; some Asian markets recorded quite heavy falls. Despite the falls in the March quarter, over the year to March share prices in all economies showed healthy rates of growth (Table 5).
| Over the March Quarter |
Over the year to the March Quarter |
|
|---|---|---|
| US | −3.1 | 5.8 |
| Japan | 9.7 | 2.8 |
| Germany | −4.4 | 23.1 |
| UK | −9.7 | 7.2 |
| Australia | −5.5 | 23.1 |
| New Zealand | −1.1 | 32.2 |
| Hong Kong | −24.0 | 41.3 |
| Indonesia | −16.4 | 58.4 |
| Malaysia | −25.3 | 48.1 |
| Singapore | −14.2 | 24.7 |
| South Korea | 0.1 | 30.1 |
| Taiwan | −13.5 | 8.8 |
| Thailand | −25.9 | 43.3 |
|
Source: National sources. |
||
Financial Intermediaries, Credit and Money
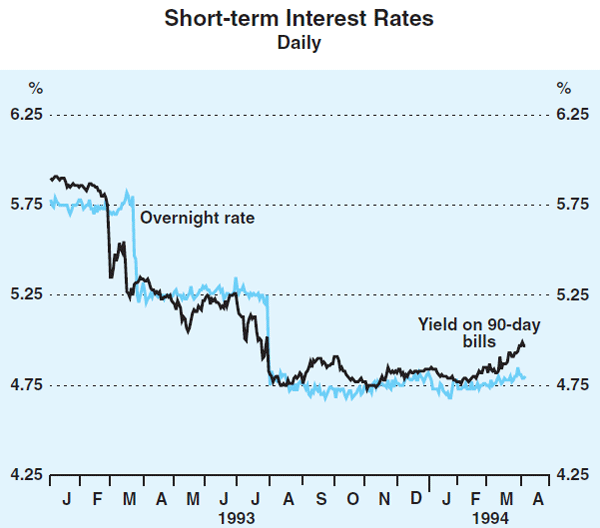
Cash rates were steady during the March quarter, but the rise in bond yields led to some increases in financial intermediaries' deposit and loan rates. Interest rates on retail term deposits of medium to long maturities recorded small increases, and some banks raised interest rates on fixed-rate housing loans, generally by a ¼ to ½ a percentage point. Fixed-rate housing loans generally represent only a small proportion (about 5 per cent) of banks' total lending for housing. Other intermediary interest rates, including those on variable rate owner-occupied housing loans and indicator rates on business loans, remain unchanged.
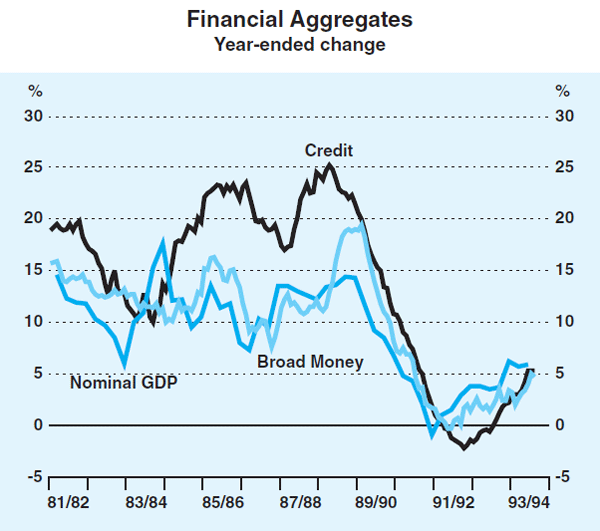
The trends in demand for finance by the business and household sectors were reflected in the portfolios of financial intermediaries. Credit provided to the private sector grew at an annual rate of 6 per cent in the three months to February, maintaining the slightly faster growth recorded in the December quarter. Credit to households, particularly for housing, remained the major source of growth; business credit continued to contract. In recent months, intermediaries have funded a greater proportion of their assets through borrowings from the domestic private sector, the main component of the broad monetary aggregates, and have been drawing less on offshore funding, which is not included in the aggregates. As a result, growth in the broad monetary aggregates has been running a little ahead of growth in credit; M3 and broad money each rose at an annual rate of 8½ per cent in the three months to February. The narrower aggregate currency, held primarily for transactions purposes, has continued to grow moderately at around 6 per cent.
| Aug 1993 | Nov 1993 | Feb 1994 | |
|---|---|---|---|
| Credit | 3.8 | 6.5 | 6.0 |
| – housing | 21.0 | 22.3 | 21.4 |
| – personal | 0.8 | 0.7 | 4.4 |
| – business | −4.3 | −0.9 | −2.4 |
| * Adjusted for breaks in series. | |||
Overall, the financial aggregates are recording growth which, while somewhat faster than previously, appears to be broadly consistent with the growth of nominal expenditure and income. If anything, overall credit growth and the corresponding expansion in broad money over the past year have been a little below what would ordinarily be expected, based on their longer-term relationship with the economy.
Attachment: Developments in International Bond Markets
Since early February, bond yields in all countries have risen sharply (see Graph 1). Movements in yields in most countries keyed off US yields, which rose following signs of increased strength in the US economy and the tightening of monetary policy in the United States on 4 February.
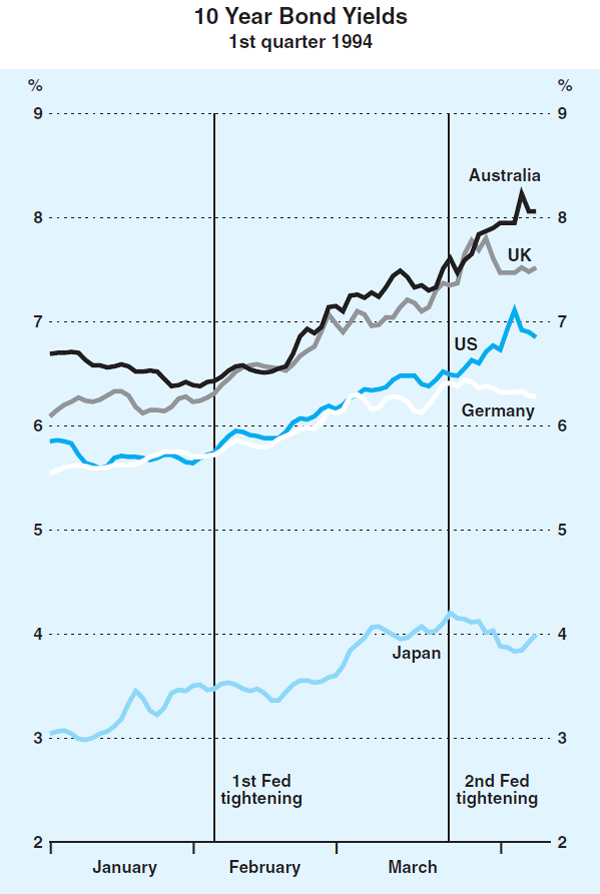
This Attachment puts recent movements in perspective and discusses international linkages in bond markets.
Some Trends
Linkages across international financial markets have become stronger over time, as controls on international capital flows have been dismantled and financial institutions have become accustomed to operating in overseas markets. The closeness of the linkages was well illustrated in the October 1987 stockmarket shake out, when exchanges world-wide mirrored the reassessment of equity prices that began in the US.
Bond markets too have become closely linked. Bond yields reflect a variety of factors, some specific to an individual country, and others common to all bond markets. The main influence on bond yields is the expected rate of inflation: in countries where inflation is expected to be high, bond holders will demand a higher nominal interest rate to compensate them for this. Other factors which enter into the setting of yields may be country-specific or universal: assessments of risk and uncertainty, for example, may reflect the situation in individual countries, or may affect the world bond market. Over long periods of time there may be significant changes in the underlying world demand/ supply capital situation which causes shifts in real interest rates world-wide.
Bond yields in several countries since 1970 are shown in Graph 2. (The shaded areas show periods of falling inflation in the US.) During this period bond yields everywhere reflected the high inflation which characterised the world economy in the 1970s and 1980s, although differences in inflation rates and other factors resulted in some significant divergences among countries.
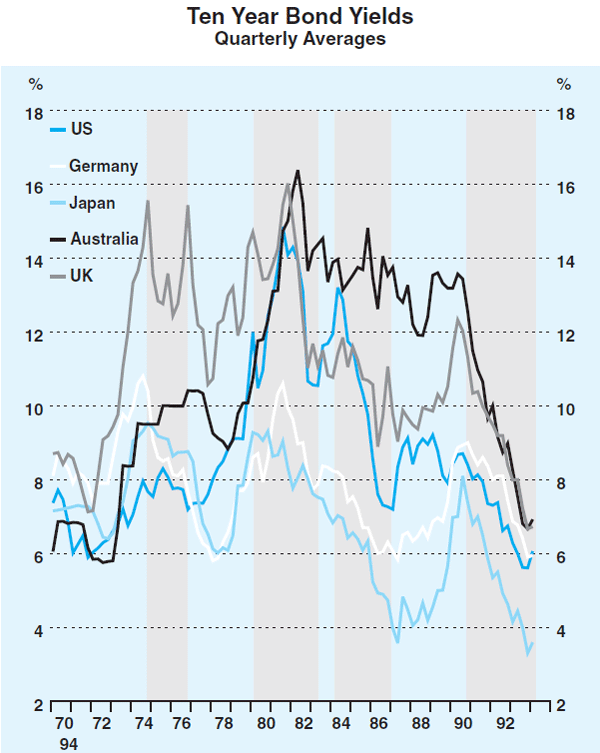
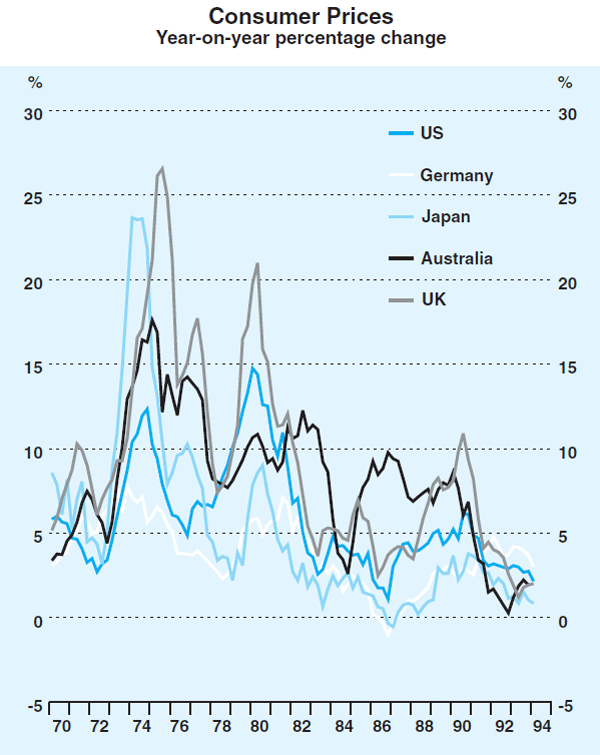
The period since 1990 has seen a remarkable uniformity in bond-yield trends in the countries covered. Not only has the direction of movement been similar, but the levels of bond yields have also converged, reflecting a similar convergence of inflation rates (see Graph 3). Inflation rates have been low and within a narrow range for about three years now. Rates of inflation among the countries covered currently fall within a range of about 2 percentage points.
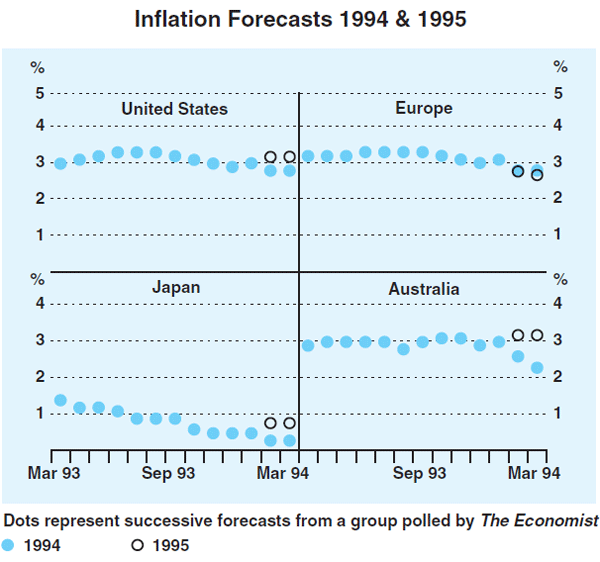
The recent rise in yields in the US was prompted by fears that inflation in the US would increase as the recovery gathered momentum. US bond yields began to rise in October 1993, as market participants came to believe that inflation was close to its low point for this cycle and that the three-year fall in world bond yields had run its course. On past experience, markets expected that inflation would rise as the economic recovery matured. While inflation was (and is) still falling in the US, the strong result for December quarter GDP led markets to judge that economic growth was accelerating, at a time when the economy was approaching capacity limits. The reassessment, however, seems to have gone beyond this reappraisal of inflation prospects, as other indicators of price expectations generally have not moved much (see Graph 4). Speculative market dynamics also appear to have played a key role in the bond market turnaround. Many funds managers, particularly the highly-leveraged ones (including the so-called Hedge Funds), were unable to withstand an unexpectedly large rise in bond yields. When this occurred in the wake of the Fed's tightening, they had to cover their positions by aggressively selling bonds, which increased and prolonged the rise in rates.
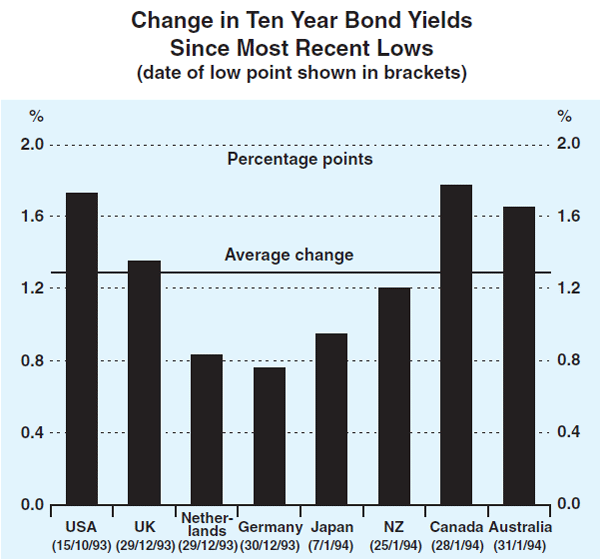
Bond yields in other countries have risen in sympathy, even though concerns about inflation are much less pronounced than in the US. If some reassessment of inflation prospects may have seemed appropriate for the US, this was clearly not the case for Germany and Japan, where economic activity is still weak; yet yields in those countries also rose significantly for a time. Graph 5 shows the rises in bond yields in different countries, since their most recent low points. This pattern of behaviour lends support to the view that a good part of recent behaviour of yields reflects short-run market churning. More recently, the continuing rise in US yields has not been mirrored in Germany and Japan, where yields have actually fallen a little, suggesting the beginnings of a more discerning reappraisal by market participants.
International Linkages
The broad trends shown on Graph 2 do not cast much light on the short-term dynamics of bond markets or on whether international links have, in fact, become stronger. The correlation co-efficients shown in the table below shed some light on these questions (though their limitations also need to be kept in mind).
The correlation co-efficients based on quarterly movements in bond yields have generally increased. This reflects at least two factors. As country-specific inflation differentials have become less pronounced in recent years, changes in bond yields have come to be influenced more by other factors which have influenced the real interest component of yields, and which are applicable to bond markets world-wide. Secondly, the links between bond markets have been strengthening. This is consistent with the globalisation of capital markets and the virtual elimination of controls on international capital flows among major countries in the 1980s, the continued growth of the funds management industry, and the increasingly global view taken by funds managers, particularly in the US.
Daily observations are available only for more recent years. These co-efficients are lower than those based on quarterly data partly because daily data contain a fair bit of ‘noise’. There is, however, a large increase in the correlation co-efficients in the latest two month period, suggesting that the recent reaction in bond markets to rising US bond yields has been much stronger than would have been expected on the basis of average experience. This is the case for most of the countries shown, not just Australia.[1] In earlier periods, while bond yields in most countries have tended to move up after a tightening of policy in the US, the evidence is less marked than in the most recent episode.
| Quarterly Movements | Daily Movements | ||||||
|---|---|---|---|---|---|---|---|
| 1970s | 1980s | 1990s | Mar 1987– Mar 1994 |
Jan 1990– Mar 1994 |
Feb 1994– Mar 1994 |
||
| Australia | 0.05 | 0.39 | 0.78 | 0.22 | 0.26 | 0.50 | |
| Japan | 0.10 | 0.60 | 0.73 | 0.26 | 0.25 | 0.28 | |
| Germany | 0.32 | 0.68 | 0.53 | 0.17 | 0.20 | 0.59 | |
| UK | – | 0.41 | 0.66 | 0.23 | 0.26 | 0.66 | |
| France | 0.20 | 0.53 | 0.45 | 0.24 | 0.14 | 0.35 | |
| Canada | 0.75 | 0.91 | 0.88 | 0.49 | 0.60 | 0.73 | |
| Italy | 0.17 | 0.23 | −0.15 | n.a. | 0.03 | 0.25 | |
| New Zealand | – | −0.13 | 0.44 | 0.12 | 0.13 | 0.30 | |
Conclusion
The consistently low inflation recorded by virtually all developed countries in the early 1990s brought bond yields in these countries closely into line. With some countries now in strong recoveries and others still in recession, important differences exist in the economic circumstances of the major countries. Despite this, bond yields in most countries have moved similarly in recent months, taking their lead from the US. There are some signs that, after the quick transmission of that shock through international bond markets, participants are coming gradually to give more weight to country-specific conditions.
Footnote in Attachment
In the case of Australia, correlations based on movements early in the trading day are even higher, indicating that early trading is heavily influenced by developments overnight in the US bond market. Over the course of the day, however, the influence of that early ‘fix’ tends to diminish as domestic news is digested. [1]