Bulletin – December 1994 A Cross-Country Comparison of External Debt[1]
- Download 461KB
Discussions of external debt have been hampered by the lack of an internationally comparable set of figures. While good comparisons are published for developing countries, there is no comparable set of data available for developed countries. This article, which is a summary of a larger research paper, sets out to fill that gap.
What is External Debt?
External debt accrues as a result of borrowing by Australian residents from residents of other countries. It includes the borrowings of both the private and government sectors. Net external debt represents gross debt less lending by Australian residents to non-residents.
Debt, however, is not the only form of external liability. Foreigners can also hold equity claims in the form of share portfolios, and ownership of subsidiaries or branches or real estate. Australians also have equity and property investments abroad. Adding Australia's net equity liabilities to net external debt gives the overall net claims against residents – that is, net external liabilities, or the net international investment position. This indicates whether a country is a net supplier of funds (debt and equity) to the rest of the world, or a net user of funds from abroad. In analysing the figures, the absolute levels of the various measures of indebtedness are usually related to a measure of national income or production, typically GDP.
The debate in Australia has focused largely on the level of net external debt, and to a lesser extent on the broader measure of liabilities, which also includes equity. Both forms of liabilities ultimately have to pay a return to the holder of the asset – either in interest or dividends. A distinction is often made, however, on the basis that debt is characterised by a contractual obligation to pay interest and principal and failure to pay then results in default and possible bankruptcy for the borrower concerned. In contrast, equity holders share in the earnings of the enterprise, with dividend payments dependent upon the enterprise having the capacity to pay.
A Cross-Country Comparison
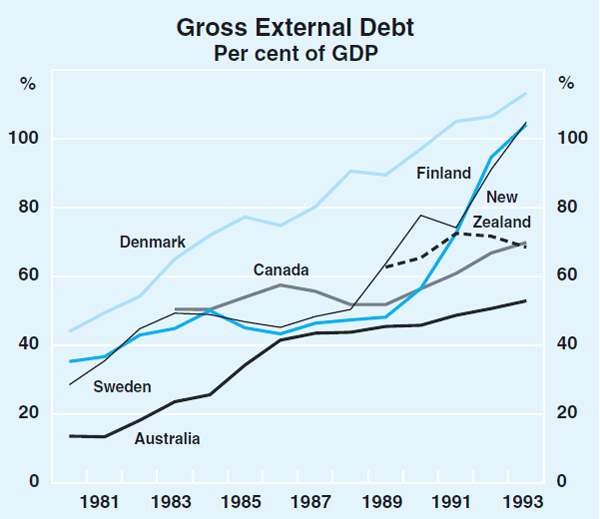
Table 1 compares external debt and total liabilities for a group of industrial countries, relative to GDP. Foreigners have a relatively low level of gross debt claims against Australians. In 1993, gross debt was equivalent to 53 per cent of GDP, ranking Australia in the lower half of this group of countries. The current level is more than double that of a decade ago, but large increases also have occurred in a number of other industrial countries (Graph 1). The industrial countries' range of gross external debt is quite large. Gross cross-border claims are much higher for countries which have extensive financial and economic linkages. Spain has the lowest debt-to-GDP ratio, at 32 per cent, while Belgium-Luxembourg heads the list at almost 270 per cent of GDP.
| Gross debt | % | Net debt | % | Net liabilities | % | |
|---|---|---|---|---|---|---|
| 1 | Belgium-Lux. | 267 | New Zealand | 62 | New Zealand | 70 |
| 2 | Denmark | 113 | Iceland | 61 | Finland | 59 |
| 3 | Ireland | 109 | Finland | 59 | Australia | 55 |
| 4 | Sweden | 105 | Sweden | 59 | Sweden | 46 |
| 5 | Finland | 104 | Canada | 44 | Canada | 44 |
| 6 | Switzerland | 92 | Ireland | 44 | Denmark | 31 |
| 7 | Netherlands | 88 | Australia | 42 | Spain | 22 |
| 8 | Iceland | 73 | Denmark | 35 | Italy | 10 |
| 9 | Canada | 70 | United States | 16 | United States | 8 |
| 10 | New Zealand | 68 | Italy | 9 | Norway | 8 |
| 11 | Austria | 63 | Norway | 7 | Austria | 4 |
| 12 | France | 58 | Spain | 5 | France | 1 |
| 13 | Germany | 56 | Austria | 3 | UK | −3 |
| 14 | Norway | 54 | France | 0 | Germany | −14 |
| 15 | Australia | 53 | Germany | −7 | Japan | −15 |
| 16 | Italy | 44 | Netherlands | −13 | Belgium-Lux. | −15 |
| 17 | United States | 34 | Belgium-Lux. | −75 | Netherlands | −20 |
| 18 | Japan | 34 | Switzerland | −107 | Switzerland | −100 |
| 19 | Spain | 32 | Japan | n.a. | Iceland | n.a. |
| . . | UK | n.a. | UK | n.a. | Ireland | n.a. |
|
For Australia and New Zealand, the data refer to the financial year ending in June
and March, respectively. All other countries refer to the end of the calendar year. |
||||||

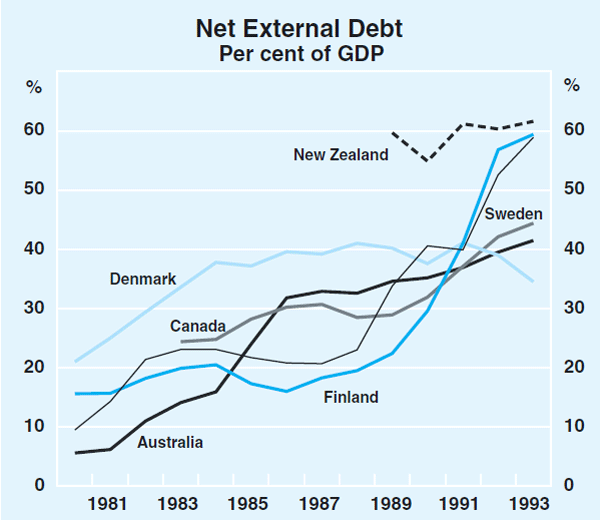
Australians, however, have relatively few loans outstanding to foreigners, so that net external debt is comparatively high. Australia is one of a number of industrial countries with net external debt of between 30 and 60 per cent of GDP. (See Table 1 and Graph 2.)

One difference between Australia's position and that of some other countries with large debt is the comparatively small share owed by the government sector. Most of the debt reflects borrowings by the private sector and public trading enterprises. In 1993, net government external debt in Australia was equivalent to 8 per cent of GDP, compared with 44 per cent for Denmark and over 20 per cent for New Zealand, Finland, Canada and Sweden.
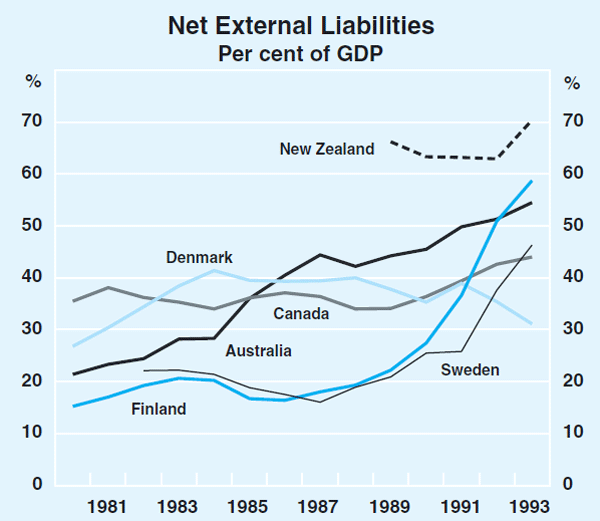
Australia has absorbed larger net inflows of equity capital than most other industrial countries; in 1993, net equity claims were equivalent to 13 per cent of GDP. Combining net debt and net equity liabilities, the total level of external liabilities of Australians in 1993 was about 55 per cent of GDP, below only Finland and New Zealand (Table 1 and Graph 3).

Footnote
This article is based on work by Mark Rider, which appeared in ‘External Debt and Liabilities of Industrial Countries’, Reserve Bank of Australia Research Discussion Paper No. 9405. [1]