Bulletin – July 1994 The Economy and Financial Markets in the June Quarter
- Download 581KB
Activity and employment continued to expand in the June quarter, and growth of around 4 to 5 per cent appears likely over the next twelve months. Confidence in the business and household sectors should support an expansion in domestic demand, with the improved world outlook providing some additional external stimulus. Inflation remains at around 2 per cent in underlying terms and is projected to remain in the 2 to 3 per cent range over the next year.
World financial markets were again unsettled in the June quarter. Bond markets remained the focus of attention; the gathering momentum in the world economy has raised concerns in markets about future inflation, leading to further rises in bond yields. Ongoing large budget deficits in many countries have not helped. The Federal Reserve continued its gradual tightening of monetary policy in the June quarter, aimed at keeping US inflation under control. This action calmed bond markets for a time, but did not prevent the US dollar declining against other major currencies and reaching a new low against the yen in June.
These international developments provided a difficult background for Australian financial markets, and contributed to a further rise in domestic bond yields. The rise in Australian bond yields was larger than in most other countries, reflecting market doubts about how Australia would manage its strong growth without an unacceptable increase in inflation. The weakness in the bond market spilled over into the equity market where prices fell sharply over the quarter. The Australian dollar was largely unaffected by this turbulence, drawing support from stronger commodity prices; it showed little net change over the quarter.
Short-term security yields moved up in mid June, as the prospect of a tightening of monetary policy increased. During the June quarter, the risks of excessive growth and associated price pressures were not such, in the Bank's judgment, as to warrant a change in monetary policy and cash rates remained at 4.75 per cent. As indicated on previous occasions, the Bank will take steps to adjust short-term rates when that is judged necessary to keep inflationary pressures in check.
The International Economy
The outlook for the world economy is improving. The United States is still growing quite strongly, recovery has commenced in Europe and Japan is showing signs of having bottomed. This prospect provided a fillip to commodity prices and contributed to the rise in bond yields around the world, notwithstanding the fact that inflation remains low in most industrial economies. Growth remains exceptionally strong in some Asian economies.
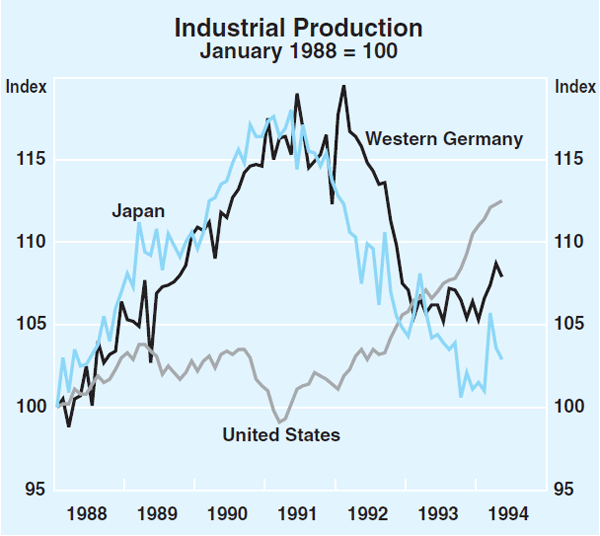
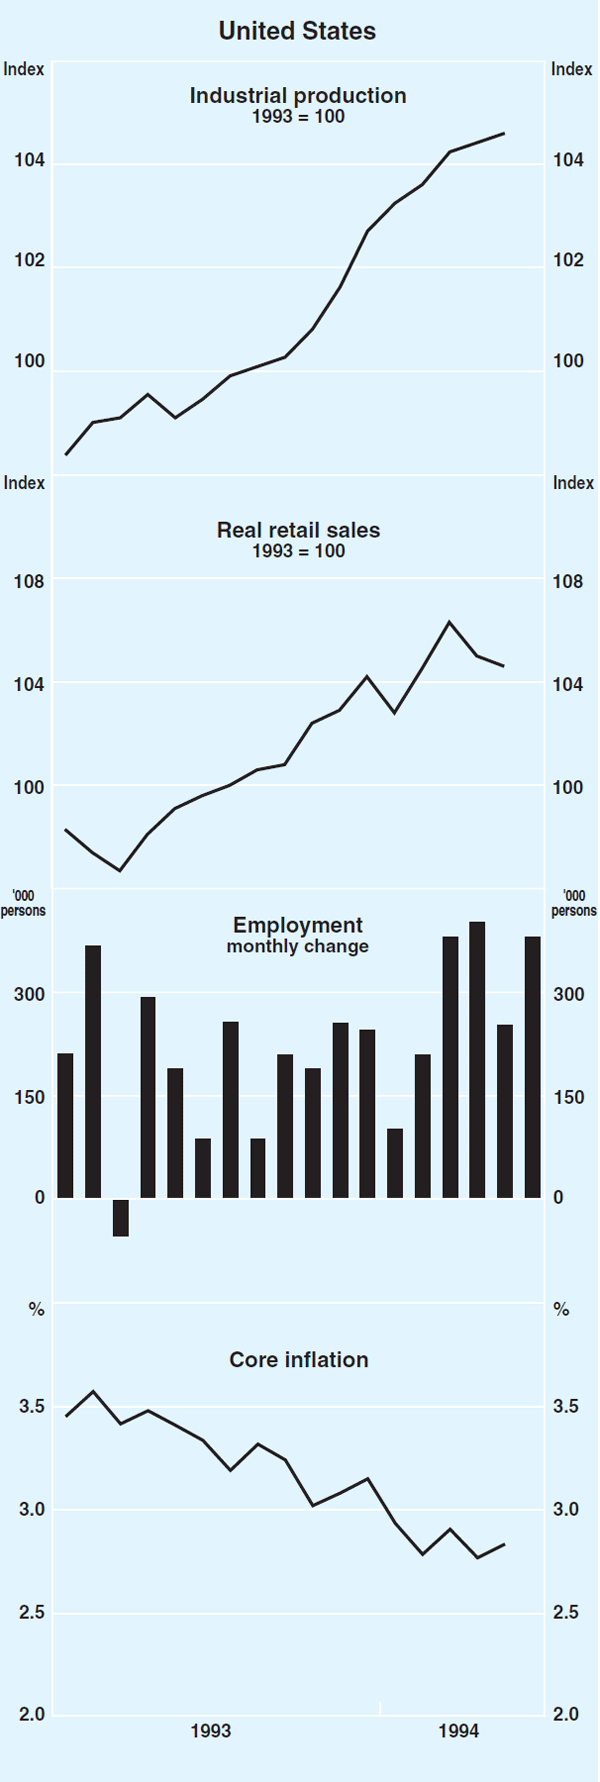
In the United States, the recovery has proceeded at a more moderate clip in the first half of 1994, following the unsustainably high growth recorded at the end of 1993. Industrial production rose by 0.2 per cent in both April and May, after growth averaging 0.5 per cent per month in the first three months of the year. Employment, on the other hand, continued to rise solidly to be 2.7 per cent higher than a year earlier; with the average number of hours worked now at its highest level since 1987, further increases in employment seem likely. The unemployment rate, at around 6 per cent, is now close to the point where wage and price pressures could be expected to develop. Output-based measures of capacity utilisation also show that firms are operating close to historical highs.
To date, however, there are few signs of any pick-up in inflationary pressures. Consumer prices rose by 2.3 per cent (or 2.8 per cent excluding food and energy) over the year to May, about the same pace as earlier in the year. To maintain this performance, and avoid pushing the economy too hard against capacity levels, the Federal Reserve continued its gradual tightening of monetary policy, lifting the Federal Funds rate a further 0.75 per cent over the quarter, to 4.25 per cent.
Recovery in western Europe is becoming more apparent. In western Germany, industrial production and new manufacturing orders have risen, helped by expanding foreign demand, and both are now above the levels of a year ago. German unemployment appears to have stabilised. Most European economies have seen a lift in industrial production over recent months, and all recorded a rise in real GDP in the March quarter. Only in the United Kingdom, however, where recovery has been under way for some time, has there been a fall in the rate of unemployment.
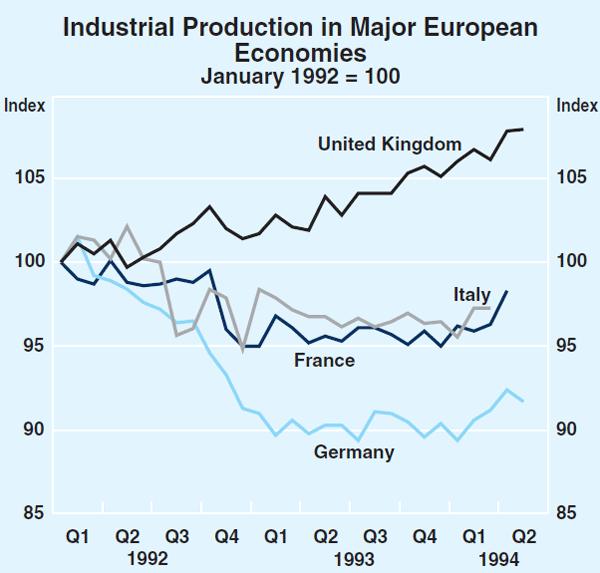
Inflationary pressures in western Europe also remain subdued. Inflation in western Germany was under 3 per cent over the year to June, compared with an average of just over 4 per cent in 1993. Modest wage increases negotiated at the beginning of the year, stable producer prices and a steady currency point to the likelihood of further improvements in that country's inflation performance. These factors have allowed the Bundesbank to ease key interest rates by nearly 1 percentage point since the end of March, notwithstanding rapid growth in monetary aggregates. Most other European countries also reduced their official interest rates.
In Japan, the low point for economic activity may have been reached in the December quarter of 1993. Real GDP rose by 1.0 per cent in the March quarter, to be around its level of a year earlier. Household expenditure was the major contributor to this growth, and both retail sales and housing starts rose in April; relatively stable employment, income tax cuts and fiscal stimulus are underpinning household spending.

The mood of the business sector is much more subdued, although the Bank of Japan's quarterly Tankan survey indicates that business confidence has improved a little in the last three months. Other indicators also suggest a pattern of recovery, albeit a modest one. Industrial production fell in April and May from the unusually high March level but, over the two months, was still about 2 per cent higher than in the December quarter. Unemployment has declined marginally since February.
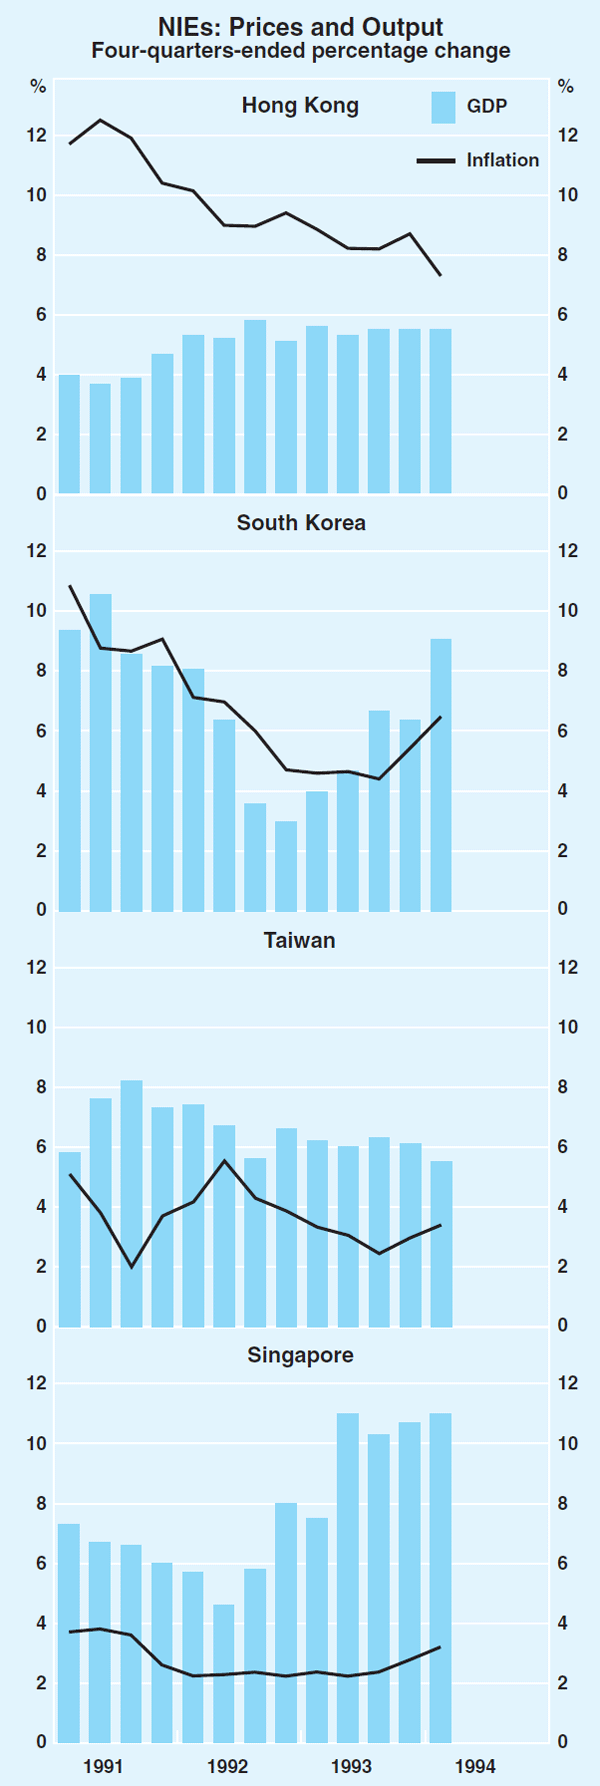
Elsewhere in Asia, ongoing rapid growth continues to fuel concerns about inflation. In China, industrial production has been expanding at rates of almost 20 per cent, raising major worries about inflation. Price controls have been placed on some basic commodities and various restrictions announced on ‘speculative’ financial trading.
Singapore's growth rate of 11 per cent is also faster than the authorities would wish to see. Measured inflation has picked up, although this is mainly because of the introduction of a VAT, and on latest figures is still below 4 per cent. Strong growth in exports and investment pushed South Korea's growth rate to around 9 per cent over the year to the March quarter, following a period in which growth slowed in response to tighter policies. Korean inflation also has moved up over the past six months. Output in both Hong Kong and Taiwan is growing at annual rates of over 5 per cent, assisted by their close links with the Chinese economy.
The Australian Economy
Economic activity
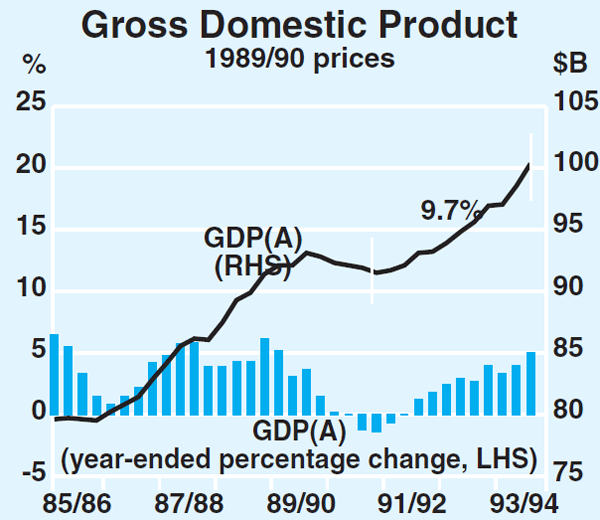
National income and expenditure accounts show that the economy grew strongly in the March quarter. The average measure of real GDP rose by 1.9 per cent, to be 5.0 per cent higher than a year earlier, and nearly 10 per cent above its trough in 1991. Growth was broadly based with most components of spending and all three measures of output recording solid increases. Public spending rose particularly strongly in the quarter and was an important contributor to expenditure growth. Abstracting from this lumpy and erratic item, underlying growth was still strong, at around 4–4½ per cent over the year.
Private consumption again rose strongly, but business investment, abstracting from transfers from the public sector, declined a little. Sales grew more strongly than production and the rate of stock accumulation slowed by the equivalent of 0.6 percentage points of GDP. On the income side of the accounts, both wages, salaries and supplements and company profits rose strongly. Manufacturing output continued to expand rapidly.
Information available to date on the June quarter suggests a further expansion in activity, although the recorded growth figures are likely to be lower than the exceptionally-strong March quarter ‘headline’ figures.
Households
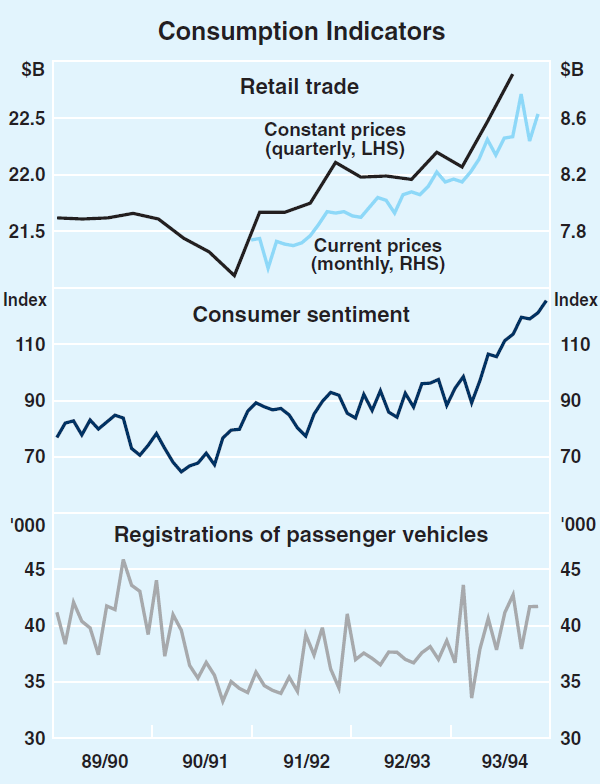
After expanding strongly in both the December and March quarters, consumption expenditure appears to have moderated in the June quarter. In large part, this pattern is the result of the timing of Easter, with a large rise in retail trade in the month of March reversed in April. In underlying terms, consumer demand appears to be moving along a solid upward trend, and sales in May were 1.8 per cent higher than in February. This is consistent with the improved economic and employment prospects; consumer sentiment, as measured by the Melbourne Institute, in fact reached a record high in June after registering strong gains since late 1993. This confidence is also being reflected in purchases of cars, with registrations of motor vehicles recording a large increase in April after the big fall in March, and a further small increase in May. Registrations were almost 3 per cent higher, on average, in those two months than in the March quarter, with manufacturers reporting solid private buying interest.
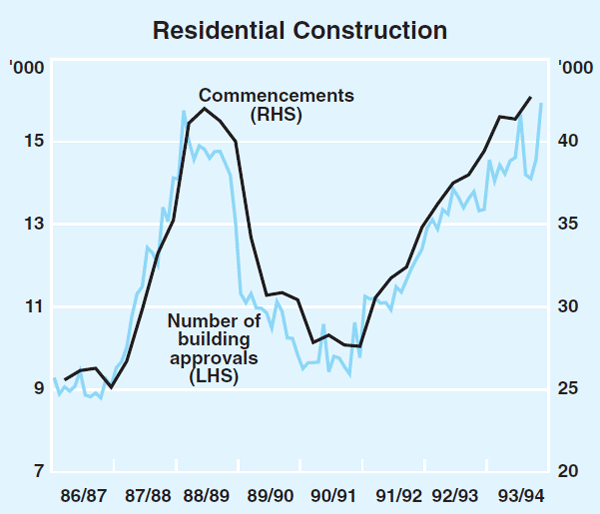
The conjuncture of greater confidence with low nominal interest rates has encouraged households to take on additional housing debt. The number of housing loan approvals for owner occupation rose strongly in April, and increased by more than 30 per cent over the past year. Finance for investor housing also has been strong, with the value of loan commitments in April around 70 per cent higher than a year earlier. Preliminary indicators for May and June point to lending continuing at very high levels. The strength of borrowing for housing has, in turn, extended the upswing in the housing construction cycle. The trend in local government building approvals through to May suggests private dwelling commencements remained at record levels in the June quarter.
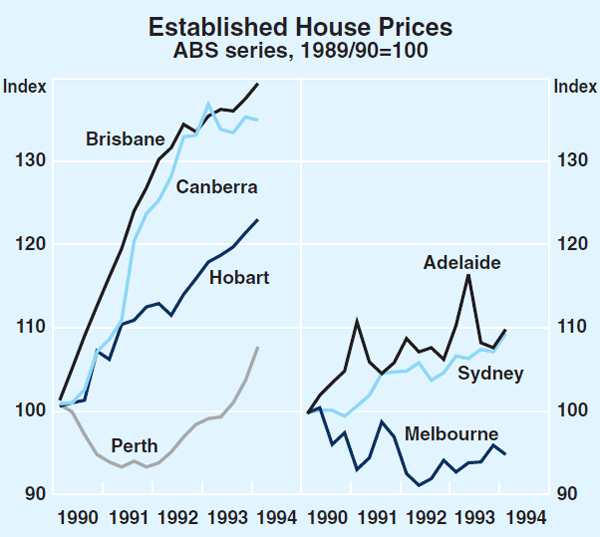
These developments have not led to any significant acceleration in house prices overall, although considerable differences exist among the regions. Based on ABS data, established house prices Australia-wide rose by 1.1 per cent in the March quarter, and by 2.8 per cent over the year to the March quarter. Prices have slowed in some regions where they had been rising strongly, such as Brisbane and Canberra, but have accelerated in Perth after falling during 1990 and 1991. Prices in Melbourne remain below the levels of a few years ago. Price rises in Sydney generally have been below the national average over the past couple of years, although the increase in the March quarter was the largest since September 1991, and house prices in some areas appear to be increasing quickly.
Business conditions
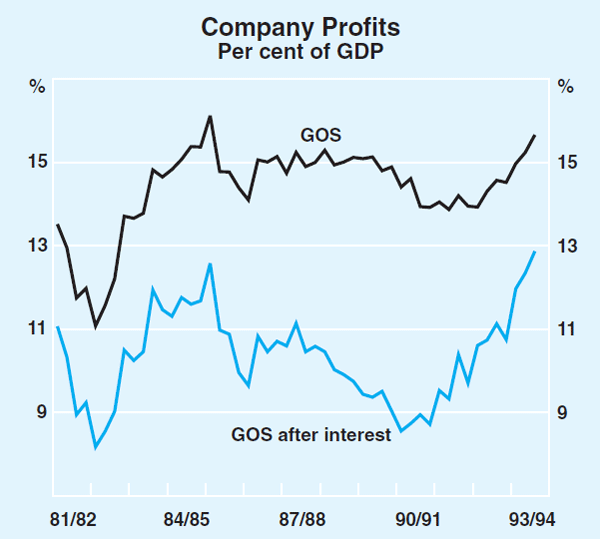
Business conditions remain very favourable. Increased sales, and the effects of cost-cutting and productivity improvements, have combined with lower debt servicing costs to boost profits. According to the national accounts, the gross operating surplus of corporate trading enterprises increased by 5 per cent in the March quarter and by 15 per cent in the year to March. After net interest payments are deducted, the increase was 23 per cent in the year to March. Measured as either a share of national income or as a rate of return on assets, profits are at historical highs. Conditions in the unincorporated business sector (largely sole traders and partnerships) are also improving, with recorded profitability increasing by 8 per cent over the nine months to March.
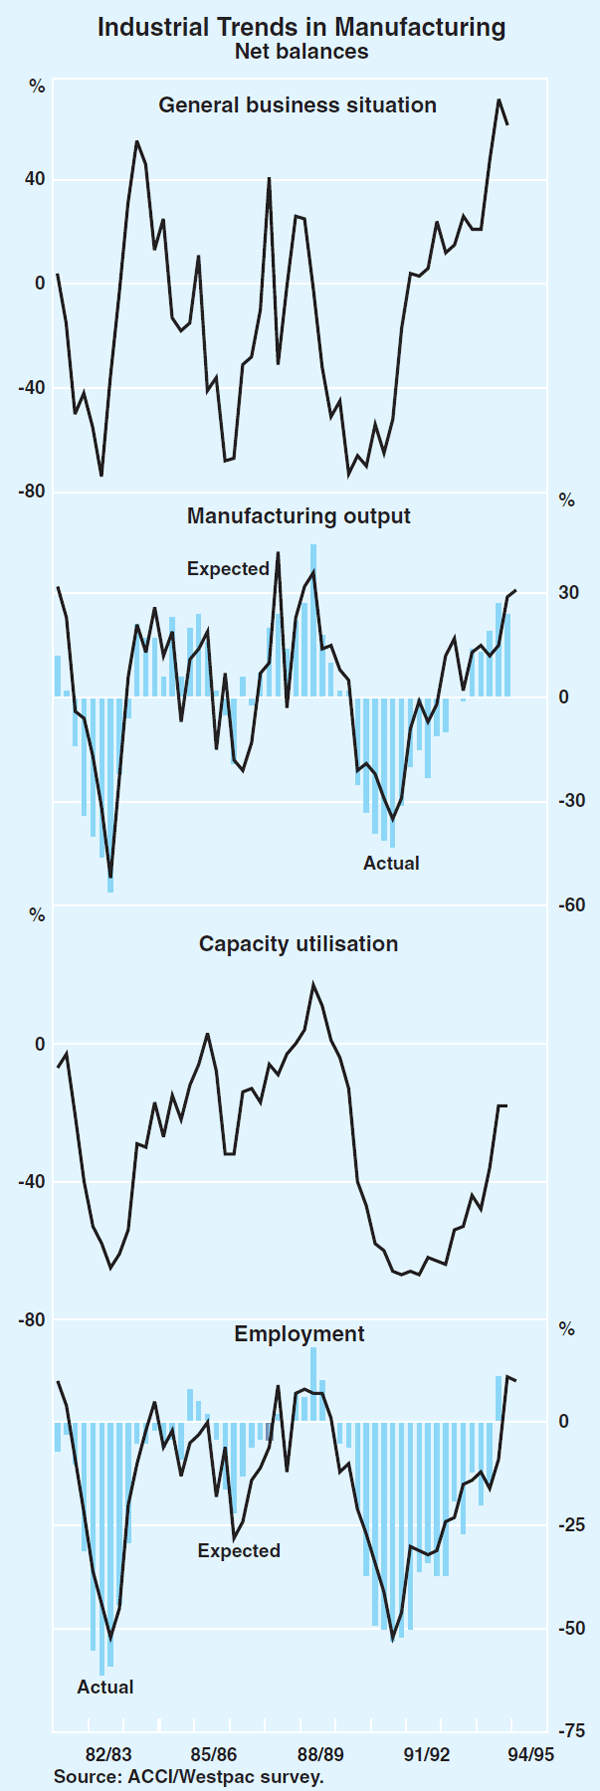
Not surprisingly in these circumstances, business sentiment has been strong, with recent surveys suggesting the majority of businesses expect to increase sales, profits and investment. In the June quarter ACCI-Westpac survey of manufacturers, the number of firms reporting increases in new orders, output and employment remained high. Most firms expected higher levels of new orders, output and employment in the September quarter. This appears to be a reasonable assessment of the level of confidence in most of the other sectors of the economy.
To date, firms largely have met increased demand by expanding production within existing capacity limits. Capacity utilisation has thus moved up, and is thought to be at relatively high levels in manufacturing. It is likely that some firms are now in the process of expanding capacity, despite the relatively weak investment figures reported in the national accounts for the March quarter. Signs of this include: the recent strength of imports of capital goods, such as machinery, industrial equipment and computers; higher levels of registrations of commercial motor vehicles; and the latest surveys of capital expenditure intentions.
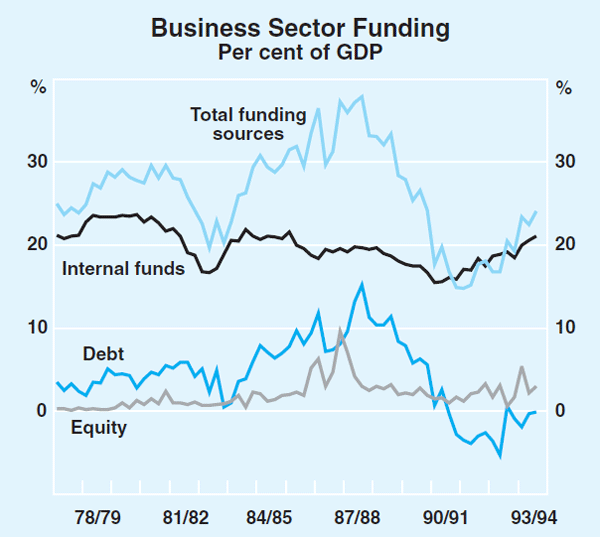
One indirect indication that firms are in a more expansive mood comes from financial data. During the early phase of recovery, the corporate sector continued to take advantage of lower interest rates – reduced interest repayments and higher equity prices – to re-organise its balance sheet and reduce debt levels. More recently, business credit has begun to rise, expanding at an annual rate of about 3 per cent over the three months to May, the first increase in three years. At the same time, equity raisings have remained very strong; in the eleven months to May, equity raisings by non-financial corporates totalled $16.3 billion, compared with $7.3 billion in 1992/93. The small increase in debt funding and the continued strength of equity raisings together point to a modest increase in the total demand for external funding by the business sector. Given the funds presently available from cash flows, this supports the view that investment may be rising already.
Labour market
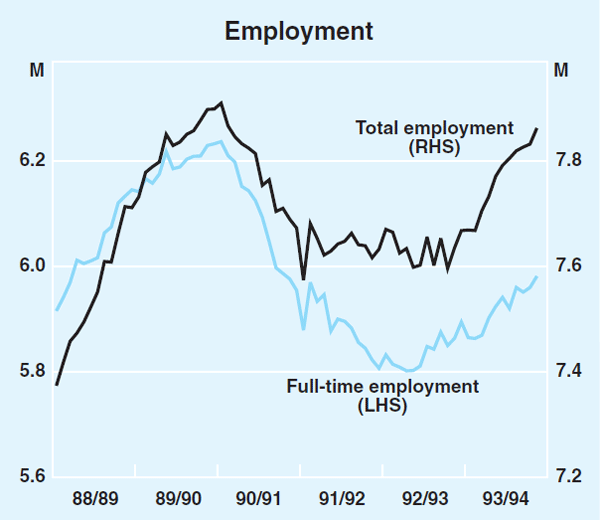
The labour market continued to firm during the June quarter. Employment, which had expanded only slightly during the March quarter, rose by 55,000 to be 2.8 per cent higher than a year earlier. Since August 1993, when the upward trend in employment became clear, growth has been concentrated in full-time male and female part-time employment, consistent with the industry composition of growth. The fastest growing sectors have been those typically employing male full-time workers (e.g. manufacturing, wholesale trade, and communications), or those where part-time female employment dominates (e.g. retail trade, and recreation, personal and other services). Employment also has risen in the Finance, Property and Business sectors, but has continued to fall in the public sector. The unemployment rate fell further, standing at 10 per cent in June, compared with 10.3 per cent in March, and 11.1 per cent a year earlier.
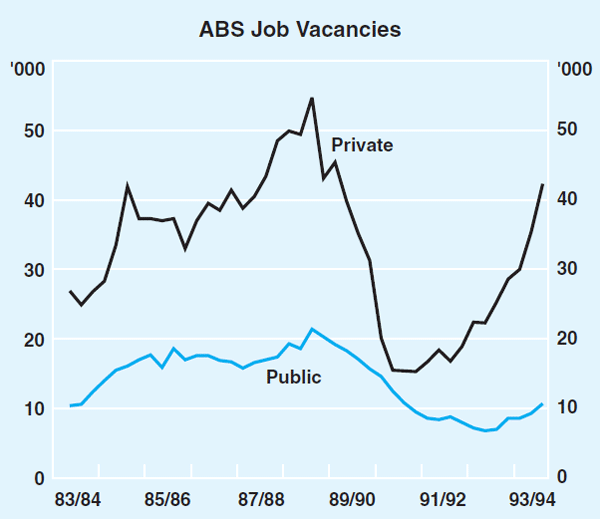
Higher demand for labour is also reflected in a further expansion in job vacancies and overtime hours worked. The ANZ Bank's measure of job vacancies increased by 5.6 per cent between March and June, and by 45 per cent over the year to June. The more broadly-based ABS series expanded by 18½ per cent in the three months to May. The bulk of this increase was in the private sector, where vacancies rose by 67 per cent over the year to May, and are at their highest level since late 1989. A rise of about 7.5 per cent in the average number of overtime hours worked per employee in the June quarter took overtime to its highest level since the middle of 1990.
Prices and costs
Price inflation remains low. The Consumer Price Index rose by 0.4 per cent in the March quarter and by 1.4 per cent in the past year. This result was helped by a fall in world oil prices (which has since been reversed), and by the effects of reductions in interest rates for both mortgages and credit cards during 1993. Rates of increase in price measures used to gauge ‘underlying inflation’ continue to be around 2 per cent per annum.
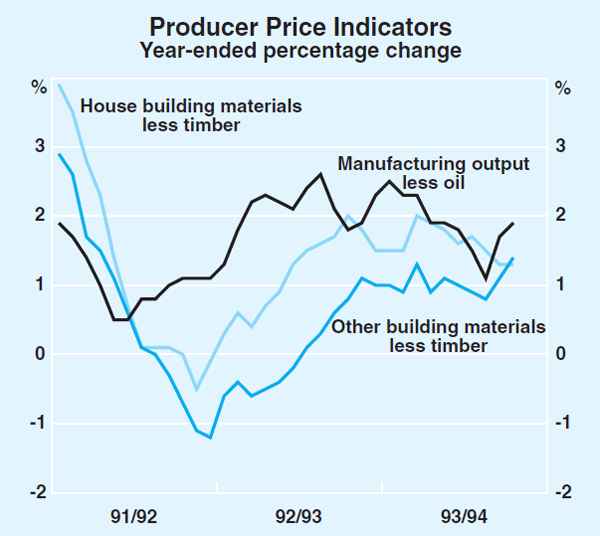
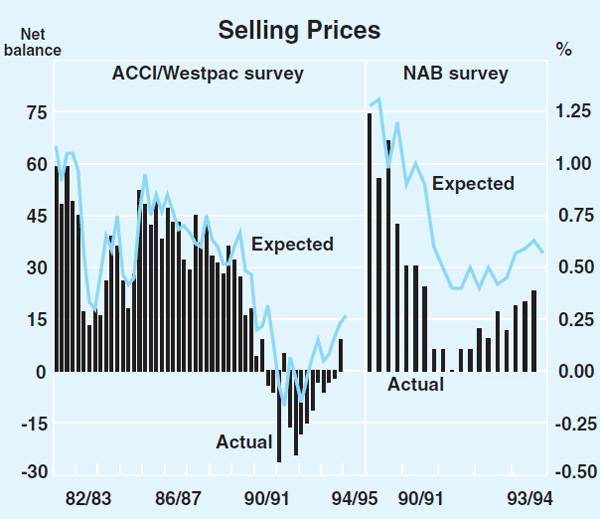
Few hard statistics on prices are available for the June quarter. Producer price measures continue to be fairly subdued overall, although they are being affected by movements in oil prices. Manufacturing output prices, for example, rose by 0.6 per cent between February and April. About half of the increase reflects higher oil prices towards the end of this period, and further increases can be expected over the next couple of months, given recent trends in international oil prices. Other significant price movements were in the food, beverage and tobacco group, and for wood and wood products. The former was associated with a surge in live cattle prices, which continued into April but appears to have subsided more recently. The latter reflects international factors in the timber industry, and is the main factor pushing up the price index for housing construction costs. A wide range of other products saw small rises in prices, which is consistent with ACCI-Westpac survey data showing that a net balance of respondents increased their selling prices in the June quarter. This was the first positive balance since the December quarter of 1991 and the first occasion since 1990 when the actual outcome was close to expectations.
Consumers' inflationary expectations remain at levels similar to those reported over the past two years. The Melbourne Institute median measure of consumers' inflationary expectations was 4.4 per cent in June, about the same as in February, having been a little higher in the intervening months. Economists' forecasts for inflation in 1995 have not changed materially over recent months. Producers' price expectations have moved up a little over recent quarters, although they remain well down on levels seen in the 1980s.
At an aggregate level, growth in overall labour costs remains subdued relative to prices and the apparent trend in productivity. Over the year to February, the AWE survey shows growth of around 3 per cent in ordinary-time earnings, with growth in the private sector a little below, and public sector wage growth above, that average. This is likely to be a more reliable gauge of underlying wages growth than the national accounts measure of earnings, which rose by only 0.5 per cent over the year to March, a figure which appears to be low relative to other indicators (including the growth in PAYE tax collections). Taking into account the continuing growth in non-farm productivity, unit labour costs appear have grown by around 1–1½ per cent over the latest year for which data are available.
Over the period ahead, across-the-board wage increases will be limited to ‘safety net’ increases of $8 per week, about 1¼ per cent of ordinary-time earnings, available in cases where the enterprise bargaining process cannot deliver agreed outcomes. On top of this modest base, the main factor influencing growth in labour costs will be the quality of the enterprise bargains which are struck.
| 1991/92 | 1992/93 | 1993/94 | ||
|---|---|---|---|---|
| Consumer Prices | ||||
| Consumer price index | 1.7 | 1.2 | 1.4 | Mar qtr |
| Private sector (excl. tobacco taxes) | 2.2 | 1.6 | 2.0 | Mar qtr |
| Private consumption deflator | 2.1 | 1.9 | 1.3 | Mar qtr |
| Treasury underlying inflation | 3.0 | 2.0 | 2.1 | Mar qtr |
| Producer Prices | ||||
| Manufacturing input prices | 2.5 | 3.7 | −2.6 | Apr |
| of which: | ||||
| – domestic | 3.5 | 2.8 | −3.0 | Apr |
| – imported | 0.7 | 5.5 | −2.0 | Apr |
| Manufacturing output prices | 1.2 | 2.2 | 1.0 | Apr |
| House building materials prices | −0.5 | 3.6 | 4.1 | Apr |
| Other building materials prices | −0.7 | 1.0 | 1.7 | Apr |
| Import Prices | ||||
| Import price index | 0.8 | 9.6 | 0.7 | Apr |
| CPI – imported items | 0.5 | 1.5 | 2.7 | Mar qtr |
| Broader Measures | ||||
| Domestic final demand deflator | 1.5 | 2.3 | 0.9 | Mar qtr |
| Gross non-farm product deflator | 1.3 | 1.4 | 0.7 | Mar qtr |
| Nominal Labour Costs | ||||
| Private sector ordinary-time earnings | 3.7 | 0.3 | 2.6 | Feb |
| Average weekly earnings | 2.1 | 2.0 | 2.0 | Feb |
Including employees under State awards, total registered enterprise agreements cover around 20 per cent of all wage and salary earners, with a further number of unregistered agreements believed to have been struck. Thus far, the vast majority of enterprise agreements is thought to include some productivity offsets. The size of these offsets is impossible to gauge with any precision, but labour productivity overall is growing at a good pace at present, albeit helped by the usual cyclical factors. Maintaining the integrity of the enterprise bargaining process is obviously important in helping to keep inflationary pressures in check.
Money and credit
With the economy growing solidly, the demand for credit has broadened, and the growth of credit accelerated to an annual rate of 10 per cent in the three months to May, up from 6 per cent in the three months to February (Table 2). This acceleration was attributable to an increase in business credit, which recorded its first clear rise in three years. Lending for housing continued to expand rapidly; other personal credit also grew modestly after an extended period of decline.
| November 1993 |
February 1994 |
May 1994 |
|
|---|---|---|---|
| Credit | 6.5 | 6.0 | 10.4 |
| – housing | 22.3 | 21.4 | 23.7 |
| – personal | 0.7 | 4.5 | 3.9 |
| – business | −0.9 | −2.5 | 3.6 |
| M3 | 8.8 | 8.1 | 11.0 |
| Broad Money | 4.9 | 8.3 | 11.4 |
| Currency | 6.9 | 6.4 | 7.3 |
| * Figures are adjusted for breaks in series. | |||
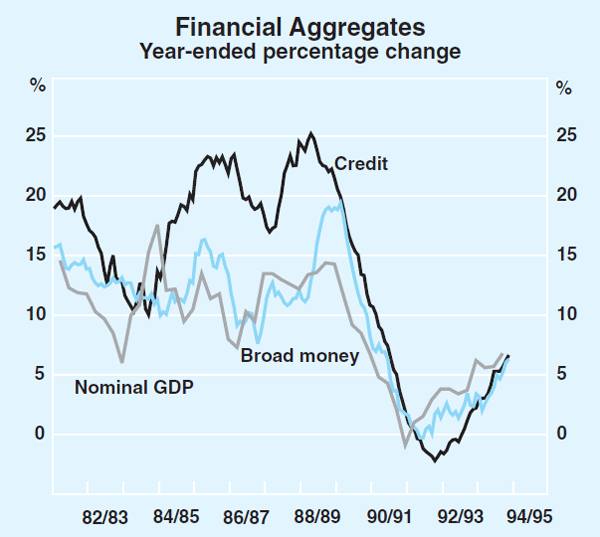
With the strengthening in demand for credit, financial intermediaries increased their funding through deposit raisings, and growth in the broad monetary aggregates also picked up in the June quarter. This has been reinforced by some shift in intermediaries' funding in the last six months away from offshore raisings toward greater reliance on domestic deposits. With this pick-up, the broad financial aggregates are now expanding at rates comparable with nominal income and spending, after having lagged behind during the earlier years of the recovery. Currency, which tends to have a fairly stable relationship with nominal GDP, continues to grow at around 6–7 per cent.
Foreign trade and payments
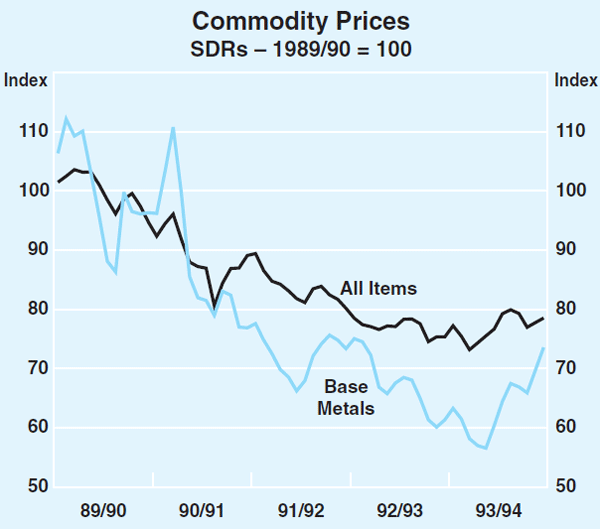
The Bank's Commodity Price Index fell by 2.9 per cent (in SDR terms) in April as new contract prices for iron ore and coal (which had been negotiated earlier) came into effect. By the end of June, however, the Index had retraced around two thirds of this fall, to be some 7 per cent above its trough in September 1993.
In response to expectations of improved demand in the industrial world, base metal prices rose strongly through the June quarter. The Bank's Base Metals Index rose by 10 per cent between March and June and by 20 per cent over the past year. Copper prices have shown the strongest growth in recent months, rising by around 22 per cent since March, reflecting a sustained fall in stock levels. Nickel (11 per cent) and lead (15 per cent) prices have also risen strongly; increases in aluminium and zinc prices were more modest.
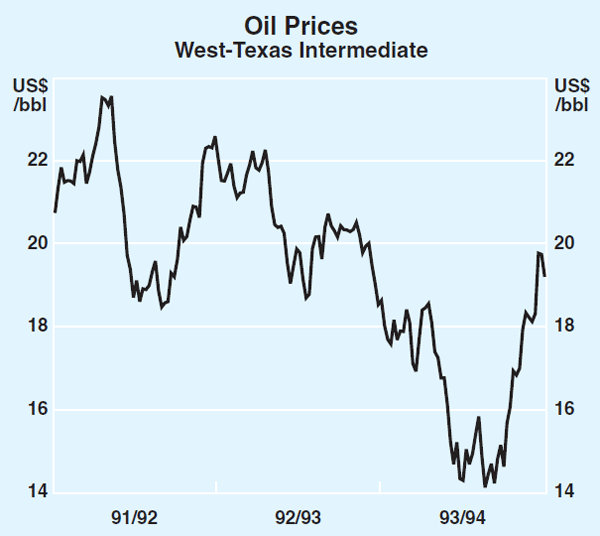
Oil prices rose strongly through the June quarter. Since March, the price for benchmark West Texas Intermediate crude has risen by US$6, reaching US$20.76 a barrel on 17 June, its highest level since October 1992. Since then, the price has fallen to around US$19 a barrel. The surge in oil prices in June is thought to reflect OPEC's decision to maintain production at current levels in the face of stronger demand, particularly in the US, and concerns over a possible US/Korean conflict.
| Weight (%) |
Change in 1992/93 (SDRs, %) |
Change in 1993/94 (SDRs, %) |
Change since trough (SDRs, %) |
Trough | |
|---|---|---|---|---|---|
| Rural | |||||
| Wool | 15.0 | −22.5 | 3.1 | 66.0 | Sep 1993 |
| Beef and veal | 8.5 | −5.1 | 4.9 | n.a. | n.a. |
| Wheat | 7.9 | −5.3 | −0.7 | 28.2 | Feb 1991 |
| Sugar | 4.3 | 3.3 | 9.0 | 46.2 | Feb 1992 |
| Cotton | 2.3 | −11.6 | 18.7 | 64.5 | Oct 1992 |
| Rice | 0.7 | −12.4 | 32.3 | 85.1 | Jun 1993 |
| Barley | 0.7 | −8.0 | 1.3 | 26.9 | Sep 1993 |
| Total rural | 39.4 | −11.3 | 7.0 | 15.0 | Sep 1993 |
| Non-Rural | |||||
| Coking coal | 13.3 | 4.9 | −2.5 | n.a. | n.a. |
| Steaming coal | 8.6 | −0.8 | −5.1 | n.a. | n.a. |
| Iron ore | 7.4 | −8.9 | −9.9 | n.a. | n.a. |
| Gold | 13.6 | −4.9 | 11.1 | 15.1 | Aug 1992 |
| Crude oil | 4.3 | −4.7 | −17.6 | 27.9 | Dec 1993 |
| Base metals | 13.5 | −7.1 | −5.2 | 30.3 | Nov 1993 |
| of which: | |||||
| – aluminium | 7.3 | −5.2 | 1.2 | 31.2 | Nov 1993 |
| – lead | 1.1 | −10.0 | −9.2 | 39.5 | Sep 1993 |
| – zinc | 1.5 | −6.9 | −15.0 | 10.5 | Sep 1993 |
| – copper | 2.6 | −5.2 | −12.9 | 42.1 | Oct 1993 |
| – nickel | 1.0 | −20.2 | −14.6 | 44.1 | Sep 1993 |
| Total non-rural | 60.6 | −6.6 | −3.3 | 3.3 | Sep 1993 |
| All Items | −8.0 | 0.1 | 7.2 | Sep 1993 | |
Rural commodity prices also continue to recover. The strongest gains (in SDRs) have been in wool, where prices rose by 16 per cent between March and June and are now almost 50 per cent higher than a year ago. A recovery in western European and Japanese demand, along with a falling clip and stock pile, underpins this strength. Wheat prices have shown only modest gains while sugar and cotton prices continue to rise; beef prices, however, have been falling and are now 20 per cent lower than in June last year.
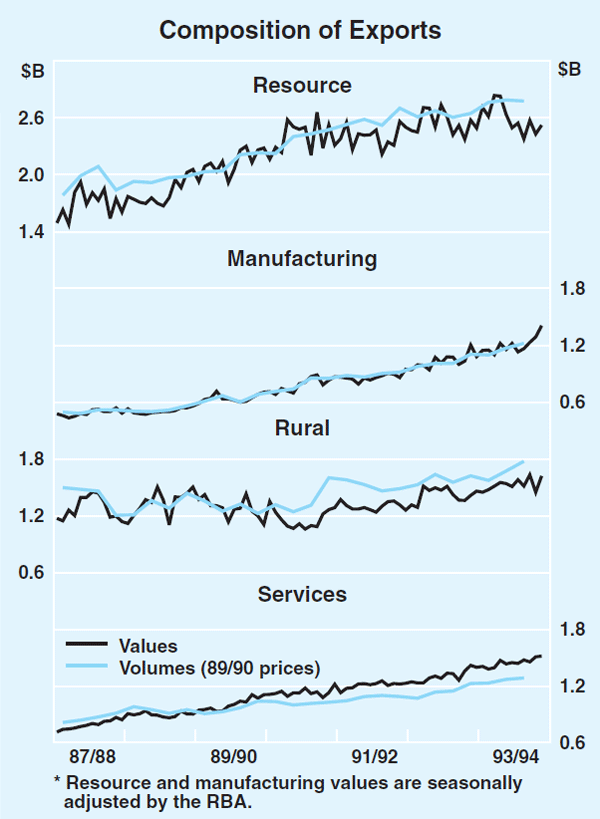
Exports grew by 2.2 per cent in volume terms in the March quarter. Manufactured exports continued their very rapid expansion, rising by 4 per cent in the quarter and up by over 20 per cent during the past year. Rural exports increased by 6 per cent, driven largely by wheat, barley and sugar exports. Growth in service exports was more modest while resource export volumes fell, reflecting lower coal and aluminium exports.
Growth appears to have continued in recent months. Over the three months to May, export values rose by 3.1 per cent. Non-rural exports rose by 3.4 per cent, mainly because of another strong rise in manufactured exports. Resource exports appear to have stabilised, while rural exports rose by 2.2 per cent. Higher spending on tourism boosted growth in service exports to almost 3 per cent in the past three months.
With the recovery in domestic demand well established, imports are also growing. In volume terms, merchandise imports rose by 1 per cent in the March quarter and by 9½ per cent in the year to March, with growth concentrated in capital and intermediate goods. Capital goods volumes rose by 15 per cent over the year, with computer imports accounting for around two thirds of that growth. Service imports grew by almost 8½ per cent in the March quarter, driven mainly by higher expenditure on overseas travel by Australians, which had been subdued over the preceding three years.
These movements also have continued into the June quarter, with the value of imports for the three months to May up about 6 per cent over the preceding period. Growth has been broadly based. Capital and intermediate imports rose further, growing by around 7 per cent. Most components of imported capital goods have recorded rises and the biggest components – computers and machinery equipment – are well above their levels of a year ago. Consumption goods imports have also picked up strongly, after being weak for the preceding year or so, rising by 9 per cent in the three months to May. In aggregate, service imports only rose by 1 per cent, but this masks a strong rebound in travel imports.
The merchandise trade deficit expanded slightly to average $256 million per month in the three months to May, compared with an average of $68 million in the previous three months. This, together with a rise in the net income deficit, resulted in the current account deficit averaging $1.6 billion in the three months to May, up from $1.3 billion in the previous three months. If recent increases in world interest rates are sustained, interest costs on most foreign borrowings will move up over the year ahead, causing the net income and current account deficits to widen.
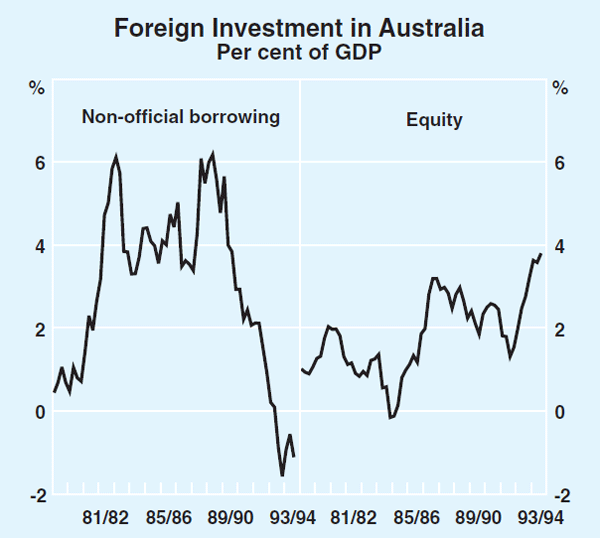
The trend towards greater equity inflow in the capital account of the balance of payments has continued. Net equity inflow in the March quarter was $5.0 billion, in contrast to a net debt outflow of $1.5 billion; in gross terms, equity inflows were at an historical high relative to GDP. Portfolio investment made up the bulk of the increase, as current and prospective strength in corporate earnings attracted foreign investors to the Australian equity market. Gross foreign borrowing by the non-official sector remained weak, rising modestly in the March quarter after an extended period of decline.
There is some evidence of an increase in investment abroad by Australian companies, although the extent of the rise to date has been modest and investment abroad remains well below its levels of the late 1980s. Lending by companies to overseas affiliates grew very strongly (by $3.4 billion), and lending abroad by Australian banks also was relatively strong.
Australia's net foreign liabilities fell by $1.9 billion over the March quarter, to $232 billion. This was equivalent to 54.7 per cent of GDP. Valuation effects, which reduced the stock of net liabilities by $5.7 billion, more than explained this fall. The stock of net debt fell by $3.5 billion to $163.7 billion, equivalent to 38.6 per cent of GDP.
Financial Markets
Bond yields continued to rise around the world in the June quarter. The rise had begun in the previous quarter, when the tightening of monetary policy by the US Federal Reserve in early February focused market attention on the likelihood that faster growth in the US (and elsewhere) would be followed by upward pressure on inflation and higher interest rates. The upward momentum in yields was maintained in the June quarter by signs of continuing strength in the US economy, and the gathering signs of turnarounds in the German and Japanese economies, particularly the former. Stronger world economic activity raised market concerns about inflation and capital shortages, especially given large ongoing demands for funds by governments in most countries to finance their budget deficits. Those countries with histories of high inflation during periods of economic expansion have tended to experience the biggest rise in bond yields since early 1994.
In the United States, the bond market deteriorated in April and early May, with 10-year yields reaching around 7.5 per cent in the second week of May. The market settled, however, in response to the tightening in monetary policy on 17 May: on that occasion, the Fed raised money market interest rates by 0.5 of a percentage point, following three increases of 0.25 of a percentage point, and announced that the accommodative stance of policy had been substantially removed. Yields fell quite sharply in late May, before drifting higher again in June. Over the quarter, yields recorded a net rise of 0.6 of a percentage point to 7.3 per cent.
In Japan and Germany, increases in yields had been less than in the US in the March quarter. Subsequently, with signs of strengthening economic activity in these countries, long-term yields increased in line with US yields in the June quarter. In other English speaking countries which are well advanced in their economic upswing – the United Kingdom and Canada – long-term bond yields rose by about 1.25 percentage points.
In Australia bond yields rose by 1.7 percentage points in the June quarter. Yields on Australian 10-year bonds were around 8 per cent at the start of the quarter, up from a low of 6.4 per cent at end January. They showed a small net rise during April, but bearish sentiment became more pronounced in May and June. In May, nervousness ahead of the Commonwealth Government's Budget contributed to higher bond yields. Continuing bullish data on the real economy, including stronger-than-expected national accounts data, together with rising commodity prices, heightened the market's concerns in June, when yields rose further; at the end of June, yields on 10-year bonds were 9.6 per cent, their highest level for more than two years.
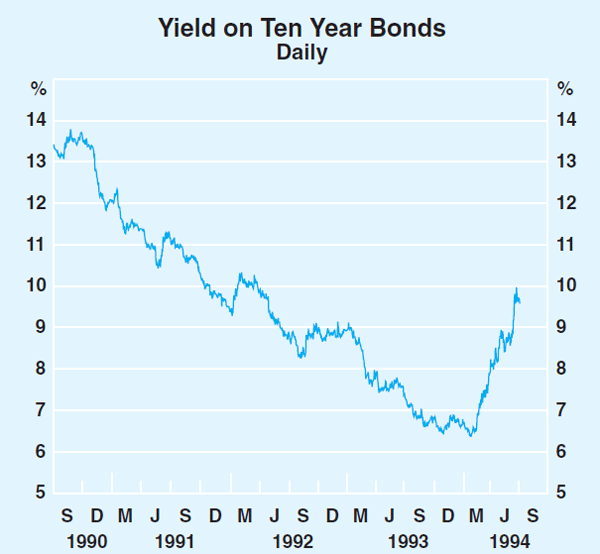
The higher-than-average rise in bond yields in Australia appears to reflect judgments by the market that the already fast-growing Australian economy could be pushed even faster by rising commodity prices, generating inflationary pressures which, in the eyes of the market, the authorities would be slow to respond to. While the stronger outlook for Australia and the world economy suggests that bond yields should be higher today than they were, say, a year ago, the authorities in Australia have indicated that they do not share the judgment about the outlook for inflation which is implicit in the rise in Australian bond yields. At the same time, they have stated repeatedly that they are committed to maintaining price stability, and will raise interest rates when this is judged necessary to keep the economy on a sustainable growth path.
The Bank was a net buyer of bonds to the value of about $500 million during the quarter. These purchases were designed primarily to meet the Bank's portfolio management needs, but were made during periods of market pressure and so helped to calm markets.
The following table shows the net movements in bond yields around the world since their most recent lows.
| Change in June quarter |
Change since 3 February |
Level at 30 June |
|
|---|---|---|---|
| US | 0.6 | 1.6 | 7.3 |
| Germany | 0.8 | 1.4 | 7.1 |
| Japan | 0.5 | 0.8 | 4.3 |
| France | 0.8 | 1.5 | 7.2 |
| New Zealand | 1.0 | 2.1 | 7.7 |
| Canada | 1.3 | 2.8 | 9.3 |
| Australia | 1.7 | 3.2 | 9.6 |
| UK | 1.2 | 2.3 | 8.6 |
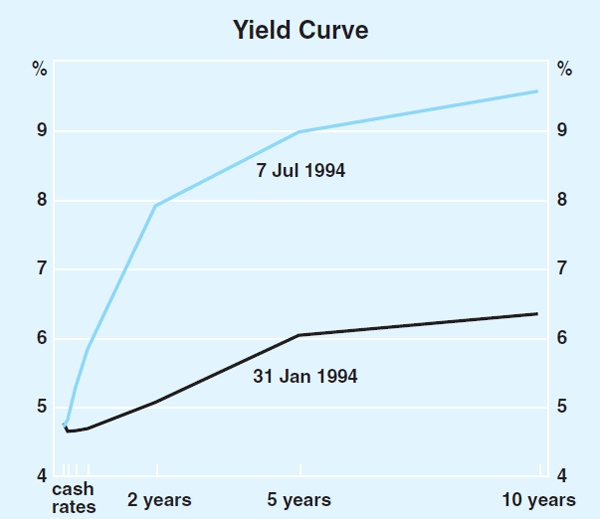
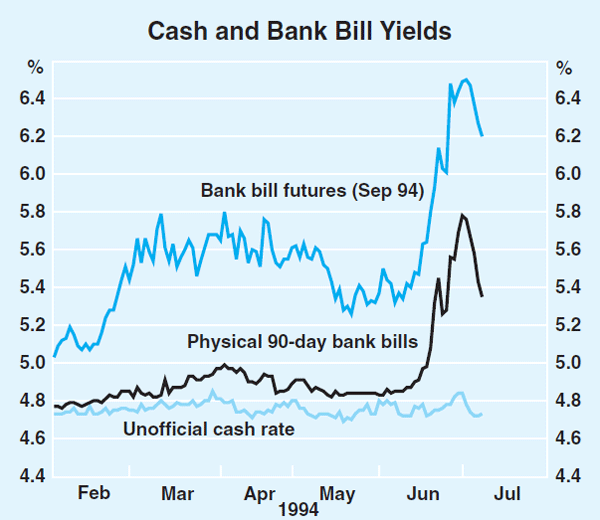
Yields on short-term securities in Australia were fairly steady early in the quarter, but rose sharply towards the end, reflecting market expectations of an early tightening of monetary policy. Yields on 90-day bank bills were 5.8 per cent at the end of June, a significant premium over cash rates of around 4.75 per cent.
The US dollar declined sharply over the June quarter against both the yen and the Deutschemark. After moving up early in the quarter, on the back of expectations of a further tightening in US monetary policy, it weakened as signs of recovery in the Japanese and German economies were seen as lessening the probability of further easings in monetary policy in those countries. This weakening was met by several attempts to co-ordinate intervention, but to little effect. Over the quarter, the US dollar fell by about 4 per cent against the yen, to a new record low, and by 5 per cent against the Deutschemark.
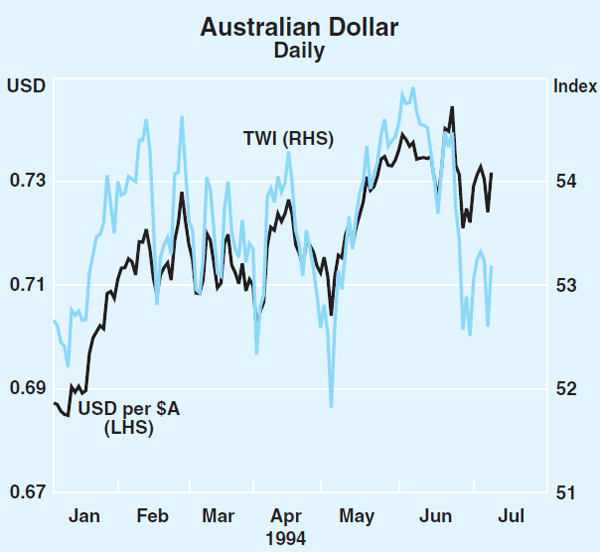
The Australia foreign exchange market, on the other hand, was relatively calm through the June quarter. The Australian dollar showed little net change, with the negative effects of weakness in the bond market and a narrowing of interest rate differentials relative to the US offset by the effects of higher commodity prices. It ended the quarter at US73 cents, or 53 in trade-weighted terms. With the exchange rate relatively steady and market conditions orderly, the Bank had no need to intervene; the Bank last intervened in the foreign exchange market in November 1993.
Higher bond yields made shares relatively less attractive, and share values generally were marked down over the quarter. The fall was fairly small in the US (0.3 per cent), but more substantial in Germany (5 per cent), Canada (7 per cent) and Australia (3 per cent). Share prices in these countries had been stronger earlier in the year and, with the exception of Canada, still ended the quarter well up on levels of a year earlier. In Japan, share prices rose by about 8 per cent over the June quarter; they were also generally stronger in the smaller Asian economies.
Increases in medium and long-term market rates led the banks to lift their interest rates on fixed-rate housing loans, which are funded by medium-term borrowings in the market. The average increase for five-year loan rates was 1.25 percentage points, with most banks now charging between 10.25 and 11.25 per cent. These loans presently account for approximately 10 per cent of all new housing loan approvals. Interest rates on banks' variable rate housing loans did not change, with the predominant rate still at 8.75 per cent; these loans are funded from deposits that are at call on relatively short term.
For business loans, higher market rates had a more substantial impact. Interest rates on medium to long-term business loans rose by 1.5–2 percentage points. These loans account for about one quarter of all business credit. In the case of credit provided through bank bill facilities (about half of total business credit), interest rates rose in line with bill yields. Interest rates on variable-rate business loans did not change; the predominant indicator rate for small to medium-sized business remained 9.25 per cent, with special offers providing discounts of around 1.5 to 2.0 percentage points on that rate.
On the deposit side, apart from the higher rates faced by banks in the money markets, there were some modest rises in interest rates offered by banks on fixed deposits. These increases sought to keep rates competitive with comparable security yields. These changes will take some time to feed through to banks' overall cost of funds.