Bulletin – April 1995 Quarterly Report on the Economy and Financial Markets
- Download 201KB
Introduction
The Australian economy grew at an unsustainably fast pace in 1994. Recent revisions have lessened the apparent strength seen in earlier figures, but growth over the year still looks to have been around 6 per cent in the non-farm sector. The expansion in domestic demand, together with the effects of drought and higher world interest rates, has seen a significant widening of the current account deficit. This, together with other domestic and international factors, helped to unsettle financial markets, and led to a fall in the exchange rate.
Slower growth of demand and output is needed in 1995 to help contain inflationary pressures and reduce cyclical pressures on the current account. Some slowing now appears to be occurring, although its extent is unclear at this time. Recent statistical releases suggest that retail spending, employment and imports are continuing to grow at a solid pace, if somewhat slower than during 1994. Surveys of business and consumer sentiment, on the other hand, reveal distinctly less confidence about the near-term future.
This cooling down of the ebullient expectations which were developing over much of 1994, particularly amongst consumers, is to be welcomed. The ‘pre-emptive’ tightenings of monetary policy in the second half of 1994 undoubtedly have been a factor in this, along with seemingly widespread concerns that interest rates could rise a good deal further. It is not clear, however, whether this change in sentiment will be sustained or, if it is, what impact it will have on spending over the year ahead. Other sources of uncertainty at this time include the Federal Budget (which is to be introduced on 9 May), the drought and the international environment. The latter seems likely to remain relatively supportive during 1995, notwithstanding continued weakness in Japan and on-going instability in world financial markets.
Financial markets have exhibited a generally pessimistic tone towards Australia in the early months of 1995. The exchange rate has fallen, long-term interest rate differentials have widened, and share prices have been weak. These developments reflect a number of domestic and international factors, including concerns about the growing current account deficit, particularly in the wake of Mexico's problems, and uncertainties in the markets about the direction of economic policy in Australia.
Although not yet reflected in underlying inflation measures, pressures on prices and costs are expected to become more apparent during the course of 1995. The extent to which these pressures ease or continue to build will depend a good deal on how quickly growth slows to a more moderate pace. The recent weakness in the Australian dollar, were it to persist for any length of time, would become another source of upward pressure on prices.
No change has been made to cash rates since December. The case for any further adjustment on domestic economic grounds is not clear-cut, given the difficulty at this time of assessing just how quickly growth in spending is likely to slow down. The likelihood of some pick-up in underlying inflationary pressures does mean, however, that monetary policy must remain on guard to see that they do not become entrenched in rising inflationary expectations. Assessing the strength of those pressures, and ensuring an appropriate response to them, is the key focus for monetary policy over the year ahead. Offshore developments, which have the potential to undermine confidence and add to inflationary pressures through major movements in the exchange rate, must also be watched closely.
Economic Activity
Output in the December quarter grew by 0.4 per cent, which was considerably slower than the 1.2 per cent recorded in the September quarter (see Table 1). This comparison, however, probably overstates the actual slowing; over the year to December, growth was estimated at 5 per cent, compared with a (revised) figure of 5.8 per cent for the year ended September. In the non-farm sector, output is estimated to have risen by 6.1 per cent over the year (see Graph 1). Domestic expenditure rose by 1.1 per cent in the quarter, and by around 6½ per cent over the year.
| Sep qtr 1994 |
Dec qtr 1994 |
Year to Dec qtr 1994 |
|
|---|---|---|---|
| Private final demand* | 1.9 | 0.6 | 6.5 |
| GNE | 1.7 | 1.1 | 6.6 |
| Non-farm GDP (A) | 2.0 | 0.6 | 6.1 |
| GDP (A) | 1.2 | 0.4 | 5.0 |
| * Excluding transfers to and from the government sector. | |||
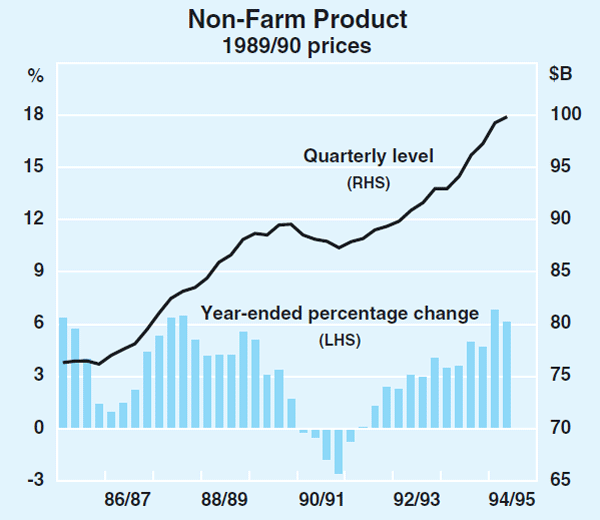
The task for policy is to try to engineer a slowdown in the economy which will be sufficient to relieve pressures on costs and import volumes, while maintaining a downward trend in unemployment. The required rate of growth cannot be quantified with any degree of precision, but it is clearly below that recorded during 1994. The available information for the early months of 1995 shows a slowing, but its extent is not clear at this time. Surveys point to a significant decline in general confidence among businesses and consumers, although much of the harder statistical information suggests that growth in demand, while moderating from the strong rates seen in 1994, nonetheless remains quite robust.
The household sector
The national accounts measure of consumption for the December quarter was much weaker than suggested by the retail trade data for that quarter. Technical factors in the seasonal-adjustment process appear to lie behind this difference. Overall, consumer spending looks to have been on a solid upward trend throughout 1994.
Recent indicators suggest that growth continued in the early months of 1995, although perhaps at a slightly slower pace (see Graph 2). Retail trade grew by 2.8 per cent in January, after a weak December figure, but fell by 1.0 per cent in February. On average, the value of retail trade in January and February was 1.7 per cent higher than the average for the December quarter. These data seem broadly consistent with earlier reports suggesting that Christmas trading had been the best in recent years (although retailers are ambivalent about prospects over the following few months). Solid consumption growth is also evidenced by continued growth in passenger vehicle registrations; in the first two months of 1995, registrations were 2.6 per cent higher than their average level in the December quarter, and almost 10 per cent higher than a year earlier.
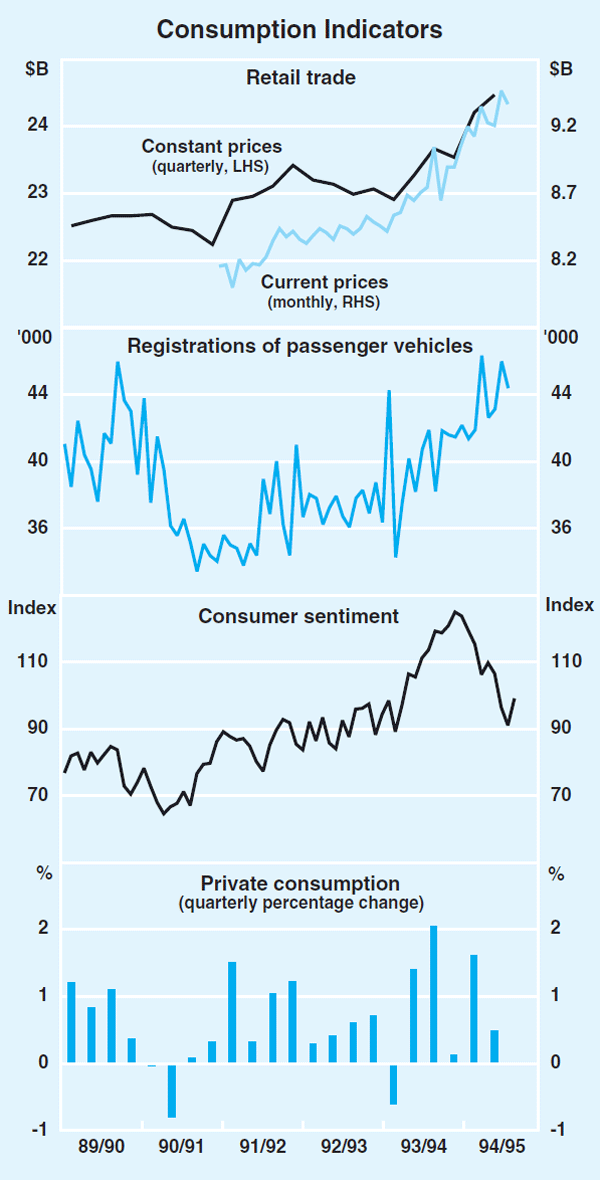
Continued growth in employment and real wages should mean that growth in consumption expenditure over the year ahead will not be constrained by lack of income. One factor that could contribute to a slower growth pattern than in 1994, however, is a deterioration in consumer confidence. From its all-time peak in the middle of last year, the Westpac-Melbourne Institute index of consumer sentiment has returned to its long-term average level. In the past, this index has had relatively little predictive power as far as future movements in private consumption are concerned, once factors such as real household disposable income are taken into account. Nevertheless, it seems clear that perceptions of further possible interest rate increases, together with talk of possible tax increases, may have served to make consumers more cautious. The extent to which, under conditions of solid growth in incomes, this cautiousness is translated into lower spending remains to be seen.
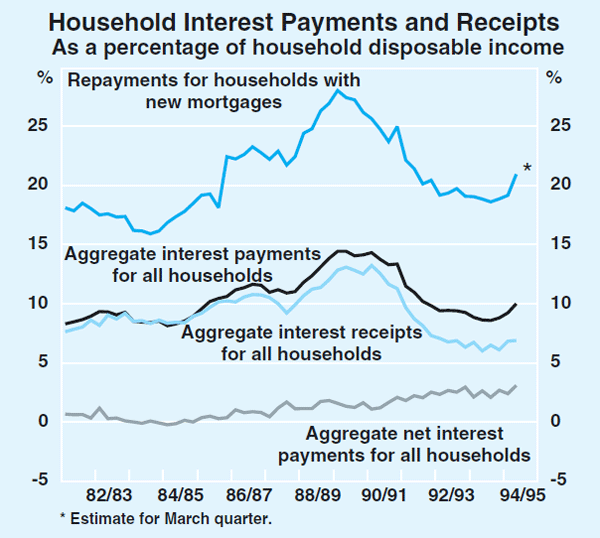
The cash flow of households is likely to slow a little as a result of recent increases in interest rates, with a possible dampening effect on consumption. While the household sector has net financial assets, many of these assets are not interest-bearing (for example, shares and some superannuation fund assets). In fact, the household sector overall is a net payer of interest. Rising interest rates therefore mean that households, in aggregate, have less free disposable income, although significant differences exist within the household sector (e.g. retirees as a group are significant receivers of interest).
The cost of servicing a ‘typical’ new loan at the standard interest rate has risen by about $110 per month since mortgage rates began to rise last year. The servicing cost relative to income for these new loans would now be close to its average for the past decade, but well below its late 1980s highs. (Some home-buyers with low-start loans may have faced rather larger increases in repayments, but these are the minority of borrowers.) The recent pick-up reflects mostly higher interest rates, but an increased appetite for debt secured by mortgages is also making for an upward trend in servicing costs over time apart from interest rates. For the household sector as a whole, of course, average levels of housing debt are smaller than for recent borrowers and interest costs relative to income are a good deal lower. Graph 3 shows estimates of mortgage servicing costs for new home-buyers, and overall interest flows for the household sector (including unincorporated businesses).
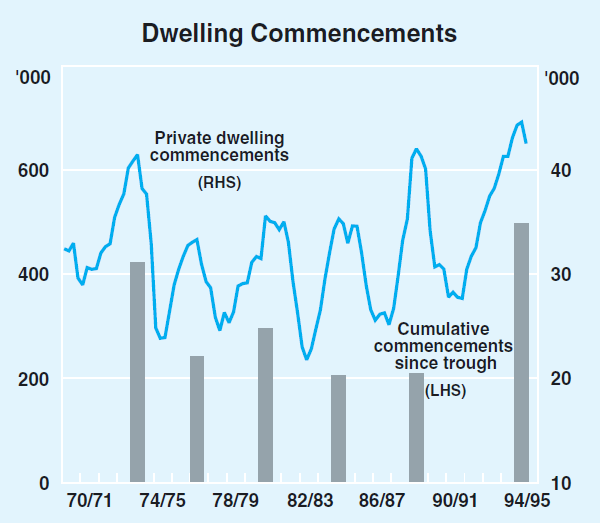
While there are conflicting signs as to the future strength of consumption, the housing sector is clearly slowing. Housing was the first sector to emerge from the downturn of the early 1990s, but recent data indicate that the strong phase of the housing cycle has run its course. For more than two years, the construction of houses has outstripped estimates of underlying demand by a considerable margin. In the three years since the last trough in dwelling commencements, around 500,000 new dwellings have been built (see Graph 4). This is comparable to the total in the long upswing which ended in the mid 1970s, and is rather more than the 200,000–300,000 seen in a ‘typical’ cycle over the past twenty years or so.
A good leading indicator is loan approvals. The value of housing loan approvals for owner-occupation fell by 17.5 per cent in January, offsetting the large rise in December (see Graph 5). Preliminary data suggest that a small fall in approvals occurred in February. Loan approvals are now around 20 per cent lower than the peak levels a year earlier. The slowing has been fairly uniform across the States; in most States, approvals are running 20–30 per cent lower, with the smallest slowing recorded in South Australia (16 per cent). For owner-occupiers, loan approvals for the purchase of established dwellings are falling a little more rapidly than are approvals for the construction of new dwellings. Loan approvals for investors have also peaked, although at this stage a clear downward trend is yet to be seen. Consistent with the fall in loan approvals, growth in the stock of housing credit outstanding has fallen below the very high rates recorded in 1994, although it still grew at an annualised rate of 14 per cent over the three months to February.
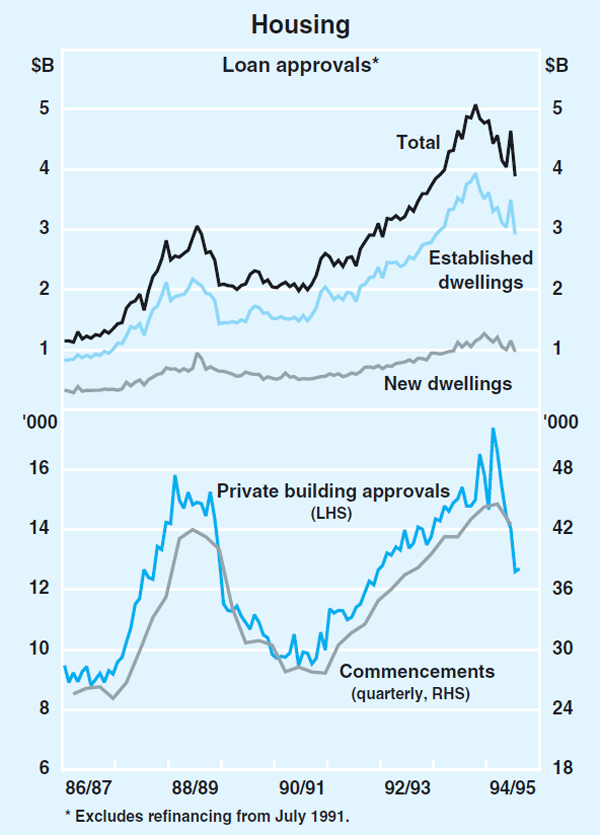
Private-sector dwelling commencements fell by 4.6 per cent in the December quarter, but remained 3.0 per cent higher than a year earlier. Judging from the data for building approvals, commencements are likely to record a much larger fall in the March quarter. Local government approvals were 14 per cent lower in February than a year earlier and 27 per cent below the peak recorded in August 1994. To date, the fall in approvals for houses has exceeded the fall in approvals for medium-density dwellings, although this pattern is unlikely to continue as the surplus of dwellings seems greatest in medium-density housing.
Recent data provide a mixed picture of trends in established house prices. The ABS estimates that house prices fell by 0.4 per cent in the December quarter, driven largely by falls in Sydney and Adelaide. Over the year to the December quarter, house prices were 3.4 per cent higher than a year ago; the comparable rise based on the CBA/HIA measure is 10.2 per cent.
The business sector
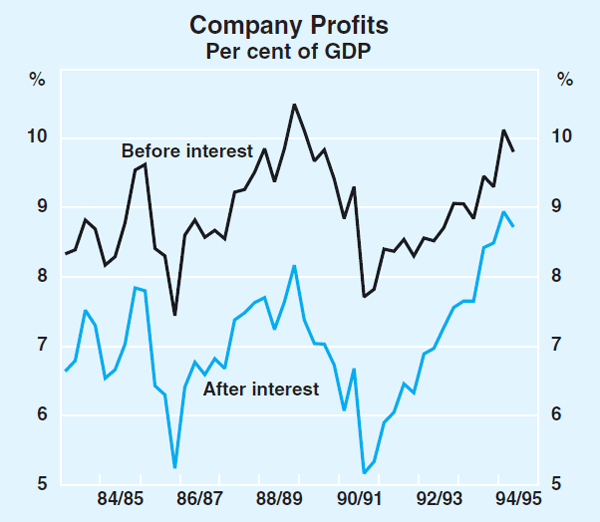
Business conditions remain broadly favourable. Profitability is high and interest burdens are low, providing a strong basis for investment spending. The ABS December quarter company profits survey showed a small fall in profits, but this followed an unusually large rise of 11.6 per cent in the September quarter (see Graph 6). December quarter profits were nearly 20 per cent higher than a year earlier, with strong gains in all industries except the mining and transport and storage industries. Interim profit results announced in the recent reporting season suggest a continuation of the strong profit performance.
Strong profitability has allowed the corporate sector to continue to fund most of its investment from internally generated funds. Equity raisings remain an important source of finance, although they have declined from their high levels in 1993/94 as share prices have weakened. There still appears to be little appetite for increased debt and, as a result, growth in business credit remains weak. It grew by 0.4 per cent in the three months to February and by 3.3 per cent over the past year.
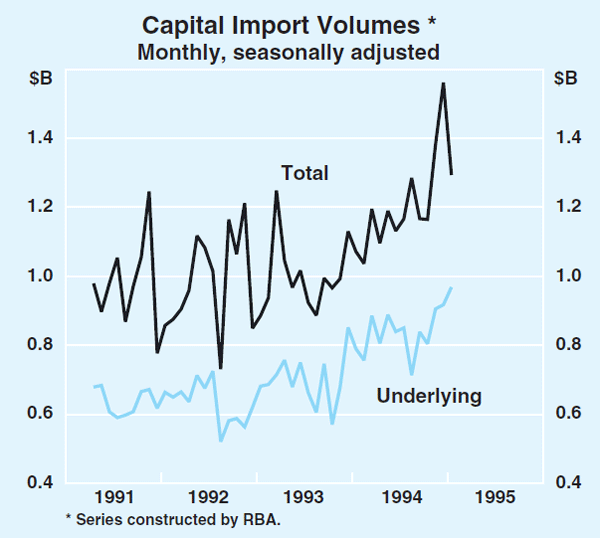
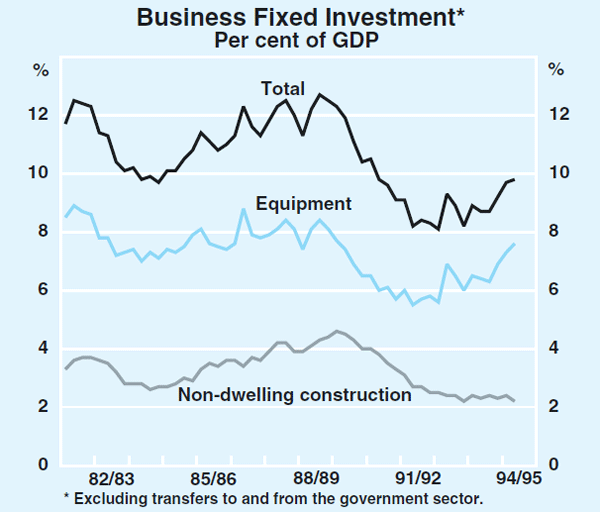
In the December quarter, private investment in plant and equipment rose by around 6 per cent in real terms (abstracting from transfers involving the public sector), to be 32 per cent higher than a year earlier. This figure appears to have been boosted by some large lumpy items but, on any reading, investment has increased rapidly over the past year. Other indicators point to the same conclusion. Domestic production of capital goods has been increasing quickly: sales by manufacturers of industrial machinery and equipment in the December quarter were 8.2 per cent higher than a year earlier. Import volumes for capital goods rose by 7 per cent in the December quarter; in ‘underlying’ terms (i.e. excluding civil aircraft and other lumpy items) they rose by 2 per cent. On either measure, investment imports were 37 per cent higher than in the corresponding period last year (see Graph 7).
Of the recent data on investment, the weakest has been the December quarter capital expenditure survey, which reported both the fifth reading of planned investment for 1994/95 and the first reading of investment plans for 1995/96. The latter was 2 per cent higher than the corresponding estimate for 1994/95, and consisted of a 3.4 per cent increase for equipment investment, partly offset by a small fall in expenditure on buildings.
Investment is one area where business survey data suggest a reasonably positive outlook. In the March quarter ACCI-Westpac survey, a net balance of 25 per cent of manufacturers expected to increase their equipment investment over the year ahead. While this represents a slight fall from recent peaks, it suggests that investment growth will remain strong in 1995, even if not as strong as in 1994. This investment will help to underpin further increases in output and exports.
The public sector
The government's mid-year review of the 1994/95 Commonwealth Budget shows that the estimated budget deficit has widened from $11.7 billion to $12.3 billion. Stronger growth has worked to reduce the deficit, but this has been more than offset by discretionary policy changes and, more significantly, the delayed sale of a number of government assets, including the government's remaining 75 per cent share of Qantas. Excluding asset sales and repayments of State government debt, the deficit is expected to fall from $17.0 billion (4.0 per cent of GDP) in 1993/94 to $14.1 billion (3.1 per cent of GDP) in 1994/95 – $1.8 billion less than was projected at the time of the last Budget. Significantly higher income tax collections, the result of stronger economic and employment growth, account for all this improvement.
The rural sector
Some formerly drought-affected regions of northern, central and eastern Australia have received good rains over recent months, but substantial areas remain drought-declared. The area of NSW that is drought-declared has fallen from 98 per cent to 60 per cent; while in Queensland, the fall has been from 51 per cent to 46 per cent.
The Australian Bureau of Agricultural and Resource Economics (ABARE) estimates that the value of farm production will fall by around 4 per cent in 1994/95, with increased prices more than offset by lower volumes. The outlook for crop production, which accounts for about 27 per cent of total farm output and has suffered severely from the drought, has improved: summer crop production of cotton, coarse grains and oilseeds is forecast to be 2.9 million tonnes, only slightly below the 3.0 million tonnes recorded in 1993/94. The value of farm production is forecast to rise by 10 per cent in 1995/96, largely on the back of projected improvements in seasonal conditions and resultant increases in volumes. Rural commodity prices are expected to increase slightly.
External Developments
Economic conditions abroad are still broadly favourable for Australia, notwithstanding a couple of unfavourable developments in recent months. Commodity prices have reversed some of their earlier rises, prompted in large part by the perception that growth in the US economy was slowing. The Japanese recovery remains weak. At the same time, growth in Europe appears to be strengthening and in non-Japan Asia quite buoyant growth has been sustained. Strong domestic demand in Australia, however, has kept imports rising. With investment surging and domestic saving weak, the current account deficit has remained large over recent months.
The international economy
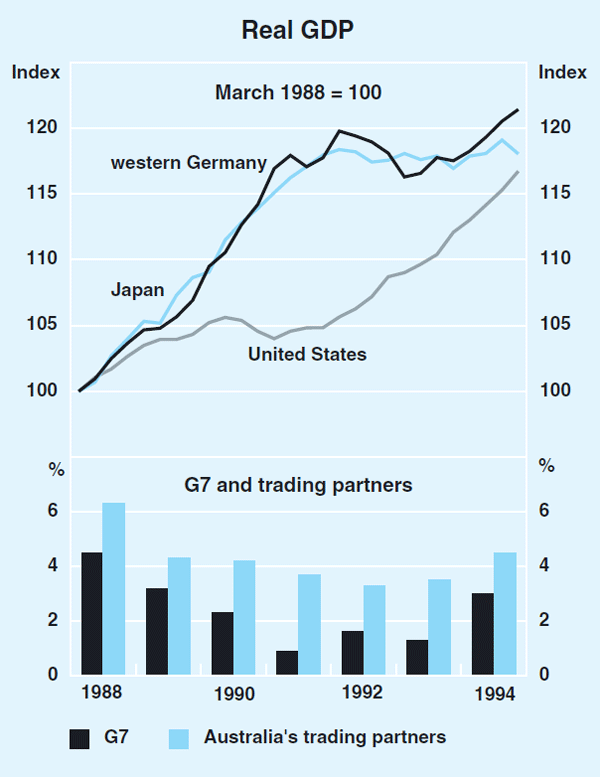
Growth in the G7 economies in the December quarter was estimated to be 0.7 per cent, bringing total growth for 1994 to about 3 per cent. A similar increase is forecast for 1995. Growth in Australia's major trading partners has been considerably stronger than this, at over 4 per cent, because of on-going strong growth in South-East Asia (see Graph 9).
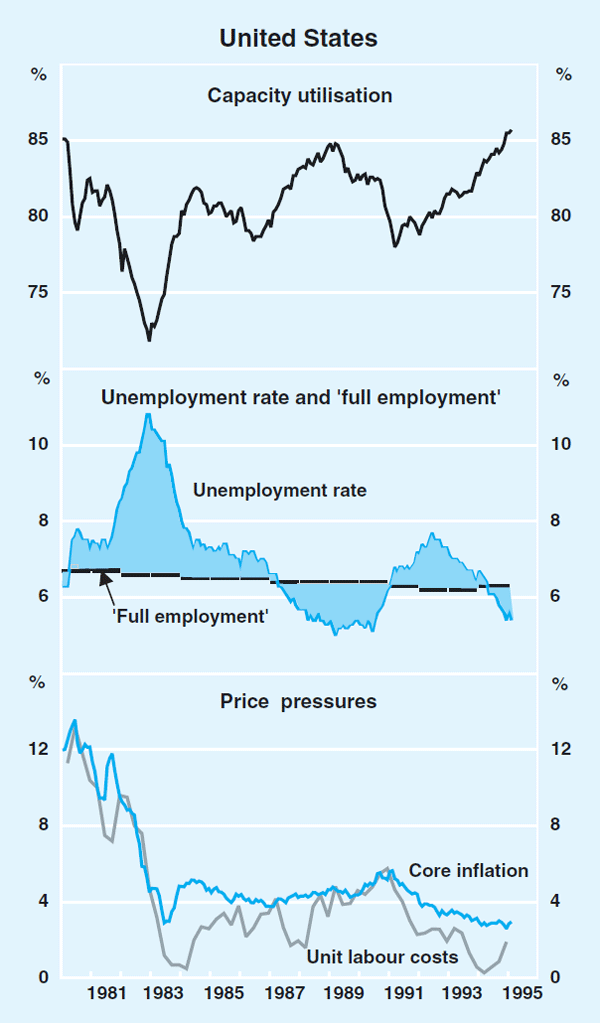
In the United States, annualised growth in GDP in the December quarter was 5 per cent, well above what is generally viewed as the long-term sustainable rate. Capacity utilisation is at its highest point in almost fifteen years and the labour market also continues to tighten – the unemployment rate fell to 5.4 per cent in February (see Graph 10). Despite these developments, there are no clear signs at this stage of any acceleration in the inflation rate. Consumer price inflation remains fairly steady, at around 3 per cent, helped by the absence of strong wage pressures and improvements in productivity, which have restrained the growth in unit labour costs.
Signs of a slowing in the pace of growth include recent falls in housing starts, weakening orders for durable goods and soft retail sales data. On the other hand, industrial production rose by 2.1 per cent in the three months to February, to be 6 per cent higher than a year earlier and employment growth has continued to be quite strong.
Past cyclical experience suggests that a more significant slowing is needed soon if underlying inflation is to be constrained. To this end, the Federal Reserve tightened monetary policy a notch further on 1 February, lifting the Federal funds rate by 0.5 of a percentage point to 6 per cent.
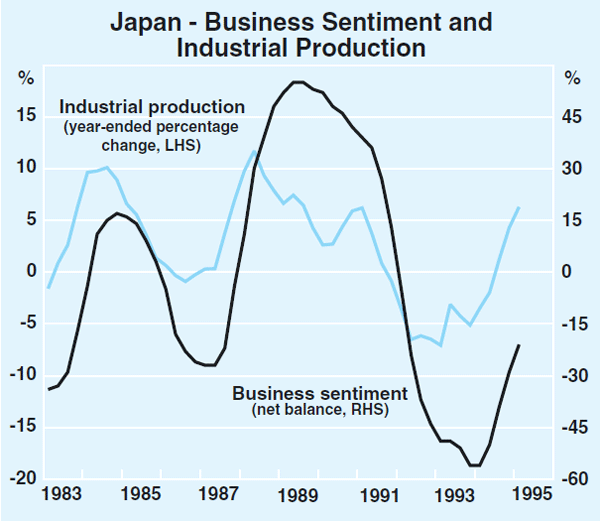
In Japan, the recovery has yet to show any strength. Real GDP fell by 0.9 per cent in the December quarter, reversing the strong growth recorded in the September quarter; a sharp fall in housing investment, combined with weak private consumption and net export demand, were responsible for the fall. The industrial sector appears to be faring better, with industrial production rising by 1.1 per cent in the three months to February, to be 7 per cent higher than a year earlier. The Bank of Japan's February Tankan survey indicated that business sentiment is continuing to improve from its cyclical low in November 1993, but still remains weak (see Graph 11).
The continuing strength of the yen and the disruption associated with the Kobe earthquake will work against any quick pick-up in growth. With the yen rising sharply, and share prices falling further, the Bank of Japan lowered overnight call rates by 0.5 of a percentage point at the end of March and in early April.
Estimates of the earthquake damage have ranged widely, with some as high as US$80 to US$100 billion, or about 2 per cent of Japan's annual GDP. Economic activity, particularly shipping, was significantly disrupted as a result of the earthquake. Disruptions to productive capacity and to normal consumer behaviour in the quake-affected region could continue for some months, slowing the growth of the Japanese economy. In the slightly longer term, the process of rebuilding can be expected to be expansionary. Medium-term prospects for Japanese fixed investment spending – a major element missing from the recovery so far – could therefore be improved slightly as a result of the quake.
South-East Asian economies continue to grow at a robust pace. Consumer price inflation accelerated in most countries in 1994, although early data for 1995 suggest that some of these pressures may be easing (for further details see Table 2). Rapid growth has been supported by strong export performances, particularly in trade with the US. In China, recent industrial production data suggest that the pace of economic growth is slowing, albeit from a high level. Inflation in China remains high.
| 1993 | 1994 | Latest | ||
|---|---|---|---|---|
| GDP Growth | ||||
| South Korea | 5.8 | 8.4 | 9.3 | (Dec qtr 1994) |
| Taiwan | 6.3 | 6.5 | 7.0 | (Dec qtr 1994) |
| Singapore | 10.1 | 10.1 | 8.3 | (Dec qtr 1994) |
| Malaysia | 8.3 | 8.7 | n.a. | – |
| China | 13.4 | 11.8 | n.a. | – |
| Consumer Prices | ||||
| South Korea | 4.8 | 6.3 | 4.7 | (March) |
| Taiwan | 2.9 | 4.1 | 4.3 | (Jan/Feb) |
| Singapore | 2.4 | 3.6 | 3.4 | (Jan) |
| Malaysia | 3.6 | 3.7 | 3.0 | (Jan/Feb) |
| Thailand | 3.3 | 5.0 | 4.8 | (Jan/Feb) |
| China | 19.6 | 24.7 | 22.5 | (Jan) |
In continental Europe, the recovery is proceeding more strongly, particularly in western Germany, where growth continues to be driven by net exports and construction spending. Real GDP increased by 0.7 per cent in the December quarter to be 3.3 per cent higher than a year earlier. The unemployment rate fell to 8.1 per cent in February and the number of job vacancies rose to its highest level since the end of 1992. While consumer price inflation is currently running at around 2½ per cent, recent wage outcomes could have an adverse impact down the track: wage negotiations in a number of key industries have produced wage outcomes for 1995 in the vicinity of 4 per cent, although the effective cost increase to employers in the engineering industry will be closer to 6 per cent, given the shortening in the working week that is involved. At present, however, the strengthening deutschemark is helping to contain price pressures, and the Bundesbank eased monetary policy slightly in late March.
In the United Kingdom, GDP grew by 4 per cent over the past year, increasing the risk that inflation – currently about 2½ per cent in underlying terms – could rise over the year ahead. Monetary policy was tightened on 2 February, with a lift in short-term interest rates of 0.5 of a percentage point. Monetary policy was also tightened in Sweden, Ireland and Italy during the quarter, while Austria, the Netherlands, Belgium and Switzerland followed the Bundesbank easing.
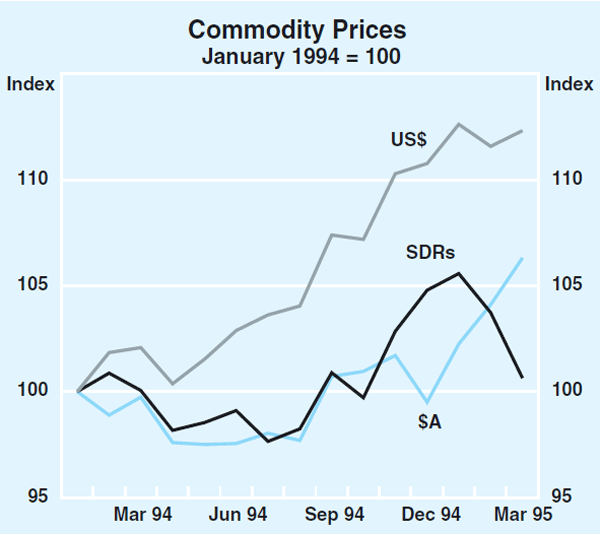
The picture on commodity prices is mixed. When measured in US dollars or Australian dollars, they continued to rise in the March quarter, although part of the rise reflected the weakness of those two currencies (see Graph 12). When measured in SDRs, they fell in February and March, but part of that fall was attributable to the exceptional strength of the yen and deutschemark. Over the long run, the best measure of commodity prices is that based on SDRs because it is an average of different exchange rates. In a short period of two or three months, however, and particularly when there is a major divergence between the US dollar and the SDR, the measure based on the US dollar is likely to be more meaningful, given that it is the currency in which most contracts are denominated.
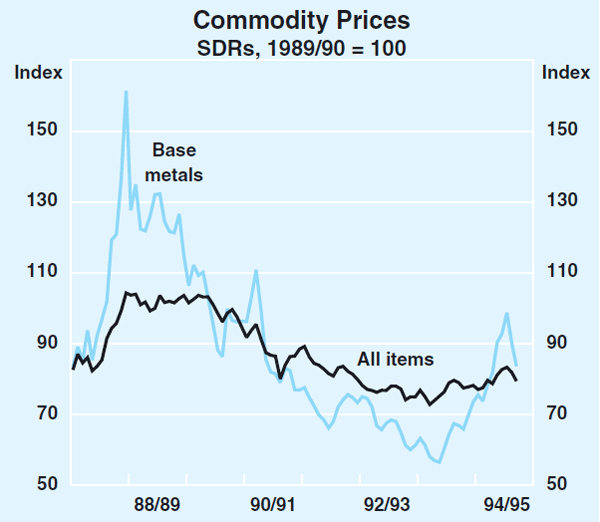
Within this overall picture, considerable diversity existed among groups of commodities (see Graph 13). Metal prices fell noticeably in the second half of January and have shown only a small recovery since. The fall in metal prices coincided with the release of data which suggested a slowing in the US economy. On the other hand, wool prices have remained firm in the March quarter, with the Eastern Market Indicator averaging 833 cents per kg in March, a rise of 8.3 per cent through the quarter and nearly 50 per cent higher than a year ago. Negotiations with overseas customers for bulk commodities have been taking place. In the case of iron ore, Australian producers have achieved an increase of around 7 per cent with the Japanese steel mills for the 1995 contract year beginning 1 April. Coal negotiations with Japan are still underway; European customers have agreed recently to a price increase of around 12 per cent.
Australia's terms of trade rose by 2.4 per cent in the December quarter and by 3.9 per cent over the year to December. This rise is likely to have been halted in the March quarter, given the recent decline in commodity prices. In the medium term, assuming reasonable world growth, underlying demand for commodities should remain firm. This would lend support to Australia's terms of trade, which remain historically low at this time.
The balance of payments
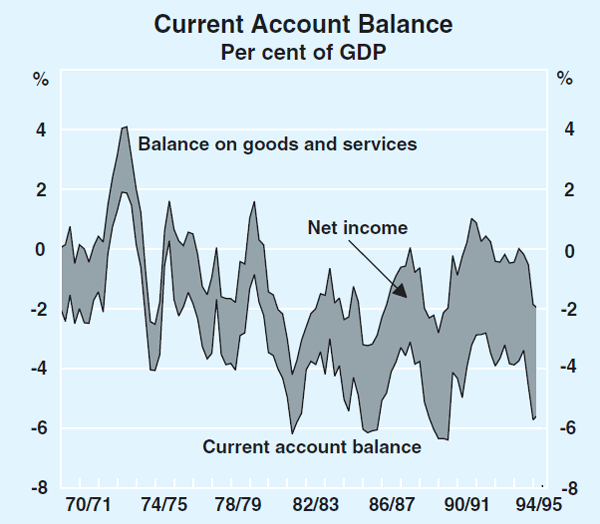
The current account deficit has continued to widen in recent months. In the three months to February, it averaged $2.3 billion, up from $2.1 billion in the previous three months and almost double the level of a year earlier. The widening of the deficit reflects a deterioration in the goods and services balance, and strong growth in the net income deficit (see Graph 14).
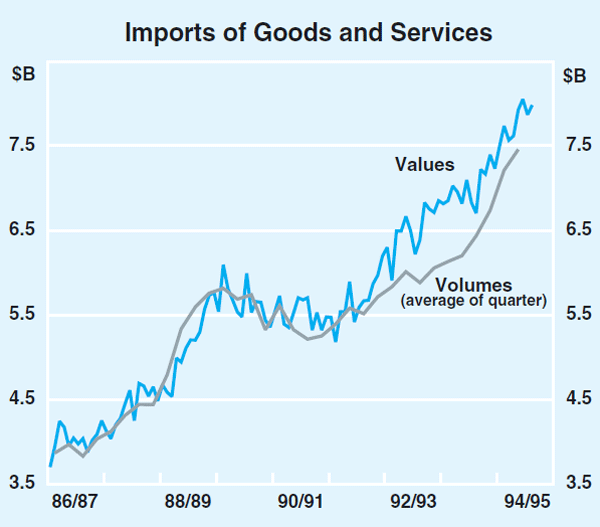
On the back of robust domestic demand, import volumes grew by 3.4 per cent over the December quarter, to be 20.3 per cent higher than a year ago. Imports of capital goods have been the fastest growing component, reflecting the strong growth in investment in plant and equipment. Strong demand for imports has continued into 1995, with the value of imports rising by 4.1 per cent in the three months to February (see Graph 15).
By comparison, export volumes were much weaker in the December quarter, rising by 0.4 per cent over the quarter and by 4.5 per cent over the year to December. Rises in the December quarter included resource-based exports (3.3 per cent), manufactures (1.8 per cent) and service exports (2.7 per cent), but rural exports fell by 7 per cent, largely as a result of the drought; cereal exports were hardest hit, falling by 36 per cent in the quarter. While data for the first two months of 1995 point to a modest pick-up, the drought will continue to restrain overall growth in exports for some months to come.
Some of the widening of the current account over recent months can be attributed to once-off factors but, at a more fundamental level, large on-going current account deficits reflect the strong growth of the Australian economy and the widening gap between domestic savings and investment. In a structural sense, only limited progress has been made in closing this gap over the past decade. As noted earlier, Australia needs strong investment growth to underpin sustainable non-inflationary growth, so the solution to reducing the current account deficit has to be found on the savings side.
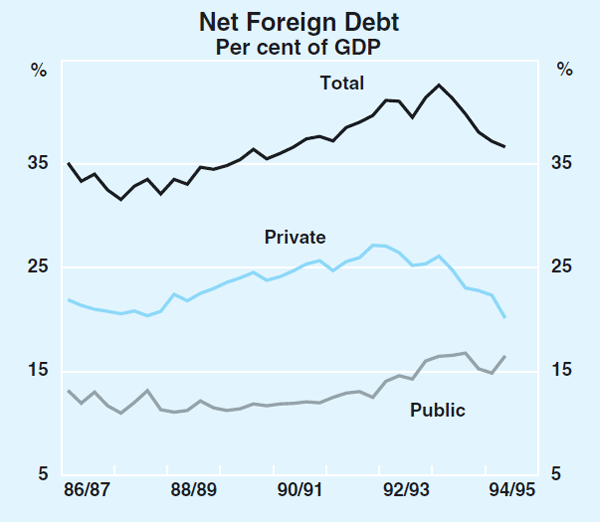
The flow-through of the large monthly current account numbers to Australia's net foreign debt and liability positions so far has been muted, mainly because of the valuation effects flowing from the appreciation of the Australian dollar last year. The stock of net foreign debt rose slightly to $162.3 billion in December, or 36.7 per cent of GDP, the first rise since the September quarter 1993. This rise masks divergent trends in the public and private sectors (see Graph 16). The private sector has continued to run-down debt owed abroad. On the other hand, the public sector's net foreign debt position has increased quite sharply, due largely to increased purchases of government securities by non-residents. In the December quarter, Australia's net foreign liabilities fell by $5.1 billion to $241.2 billion (54.5 per cent of GDP).
Inflation Trends and Prospects
Recent price data
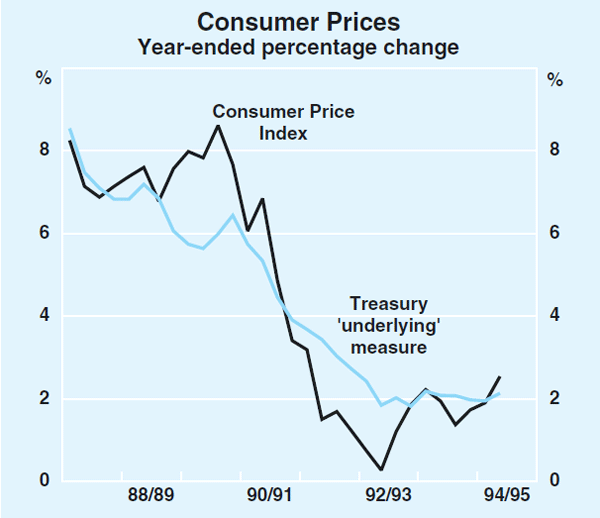
Over the year to December, the Treasury's measure of underlying inflation was 2.1 per cent (see Graph 17). This extended the period in which underlying inflation has been around 2 per cent to around three and a half years. The ‘headline’ inflation rate, as given by the Consumer Price Index (CPI), increased to 2.5 per cent over the year to December, from 1.9 per cent in September. The latter increase reflects mostly the partial impact of higher mortgage interest costs resulting from the tightening of monetary policy in the second half of 1994.
Data on prices released since the December quarter CPI do not indicate any widespread acceleration in price increases, but they continue to suggest emerging pressures in a couple of areas. In the manufacturing industry, input and output prices rose strongly in the three months to January. The price of inputs used in manufacturing (excluding petrol) rose at an annual rate of 3.9 per cent, mainly driven by a sizeable increase in the price of home-produced materials.
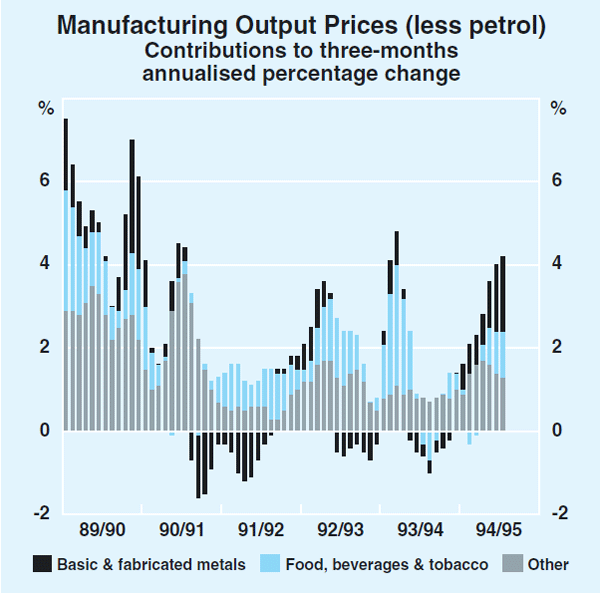
Manufacturing output prices (excluding petrol) increased by 0.6 per cent in January, their largest monthly increase in over four years; they rose at an annual rate of 4.3 per cent in the three months to January (see Graph 18). Prices for food and base metals (which make up about 40 per cent of the index) accounted for the bulk of this acceleration; increases in ‘other’ manufacturing output prices have not picked up appreciably. Food prices, however, are likely to rise further. Live-animal prices, in particular, could rise once herd rebuilding gets underway; ABARE predicts that beef prices could increase by as much as 20 per cent this year, given a return to more normal seasonal conditions; lamb prices are estimated to increase by around 40 per cent in 1995. Oil prices, which have crept higher in the first few months of 1995, are forecast to remain fairly steady.
The prices of construction materials have continued to rise in recent months, in spite of the downturn in housing activity. In the three months to January, the price of materials used in housing increased at an annual rate of 3.7 per cent and the price of materials used in other building increased at an annual rate of 3.2 per cent. A number of price measures is presented in Table 3.
Dec 1992 |
Dec 1993 |
Dec 1994 |
Latest three months (annualised) |
||
|---|---|---|---|---|---|
| Consumer Prices | |||||
| Consumer Price Index | 0.3 | 1.9 | 2.5 | 3.3 | Dec 1994 |
| Treasury underlying measure | 1.9 | 2.1 | 2.1 | 2.1 | Dec 1994 |
| Private consumption deflator | 1.6 | 2.1 | 1.2 | 0.4 | Dec 1994 |
| Producer Prices | |||||
| Manufacturing input prices (excl. petroleum) |
6.2 | 1.7 | 1.7 | 3.9 | Jan 1995 |
| of which: | |||||
| domestic | 6.0 | 0.4 | 3.4 | 4.4 | Jan 1995 |
| imported | 6.2 | 3.7 | −0.6 | 2.8 | Jan 1995 |
| Manufacturing output prices (excl. petroleum) |
2.1 | 1.8 | 2.1 | 4.3 | Jan 1995 |
| House-building materials prices | 1.6 | 5.4 | 3.4 | 3.7 | Jan 1995 |
| Other building materials prices | −0.1 | 1.4 | 2.8 | 3.2 | Jan 1995 |
| Import Prices | |||||
| Import price index | 9.9 | 3.6 | −5.6 | −6.0 | Jan 1995 |
| Imported items in CPI | 0.4 | 3.5 | 2.2 | 5.6 | Dec 1994 |
| Nominal Labour Costs | |||||
| Average weekly earnings | 0.6 | 3.5 | 3.8 | 3.2 | Nov 1994 |
| Ordinary-time earnings | 1.4 | 3.0 | 4.1 | 5.9 | Nov 1994 |
Since its recent December peak, the TWI has depreciated by 11 per cent (see the section on Financial Markets for more details), putting upward pressure on wholesale import prices. The Import Price Index increased by 0.6 per cent in January, winding back part of the sizeable fall in import prices recorded in the second half of 1994 when the exchange rate was higher. The data for February and March are likely to show further increases.
The pass-through of exchange rate movements to prices of goods ‘on the shelves’ takes time – a couple of years or more, depending on the stage of the economic cycle. In 1992/93, for example, when the Australian dollar depreciated by about 10 per cent and the economy was weak, there was little apparent effect on final prices. In different circumstances, with the economy now growing more strongly, the pass-through effects of any sustained depreciation are likely to be more pronounced.
Indicators of capacity utilisation overall are a good deal higher than a year ago, although they seem to have stabilised for the moment. In the ACCI-Westpac survey of the manufacturing sector, where both growth and investment have been stronger than in most other industries, capacity utilisation fell slightly in the March quarter, although it remains quite high compared with historical trends. A slowing of output growth, together with continuing investment, will be needed to prevent utilisation rates moving well into the range which would increase inflation.
Wages and the labour market
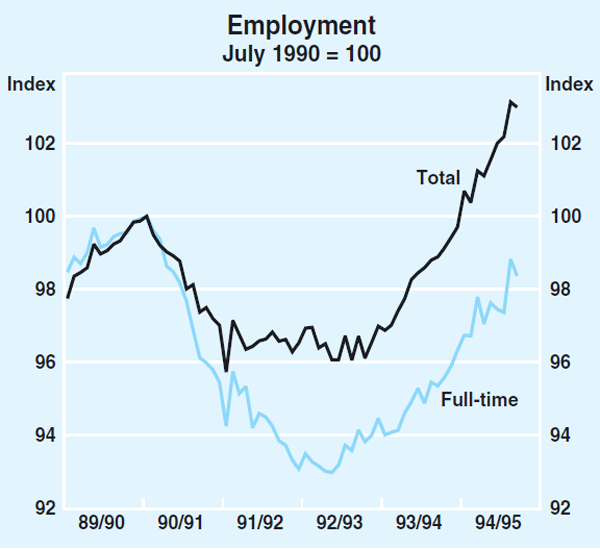
Employment growth remains strong. Total employment rose by 78,700 in the March quarter, slightly higher than the 60,300 jobs created in the December quarter. The large increase in full-time employment in the quarter (up by 56,900) followed several months of apparent weakness in the second half of 1994 (see Graph 19). The latest industry breakdown shows that the increase in employment between November 1994 and February 1995 was mixed; total employment growth was strongest in manufacturing, while on-going restructuring in government-related areas most likely accounts for the fall in employment recorded for utilities, public administration and defence. Increases in full-time employment were broadly based, but in many industries the expansion in full-time employment was accompanied by a decline in part-time employment.
The strong growth in employment over the past year has reduced the rate of unemployment more rapidly than had been expected a year ago. It was 8.7 per cent in March, down from 8.9 per cent in December and 10.3 per cent a year ago. Expanded employment opportunities have seen the labour force participation rate begin to rise, to 63.4 per cent in March, compared with 62.8 per cent a year earlier. Rises in female participation, to date, have been stronger than those for males, which appear consistent with previous cycles.
Long-term unemployment fell by around 33,000 in the three months to February, and has fallen by around 100,000 since its peak in November 1993. Despite remaining at historically high levels, long-term unemployment as a proportion of total unemployment is also starting to fall. This suggests that current employment gains are accruing more than proportionately to the long-term unemployed. It is not yet clear whether this fall in long-term unemployment is ‘definitional’ rather than substantial: many Working Nation labour-market programs provide for a period of employment, with participants in these programs recorded in the statistics as departures from the category of long-term unemployed.
The gradual tightening of the labour market appears to be having an impact on labour costs, with recent data suggesting some pick-up in the rate of increase in wages. Average weekly ordinary-time earnings (AWOTE) of full-time adults increased by 1.5 per cent (nsa) in the three months to November, bringing the increase over the year to 4.1 per cent, compared with the 3 per cent rate which had prevailed for most of the previous year. Average weekly earnings of all employees, which includes the effects of both overtime and the earnings of part-time, casual and junior employees, rose by 0.8 per cent in the three months to November (nsa), to be 3.8 per cent higher than a year earlier. In contrast to the situation over most of the past four years, private-sector earnings rose more rapidly than public-sector earnings, increasing by an estimated 4¾ per cent over the year to November (see Graph 20).
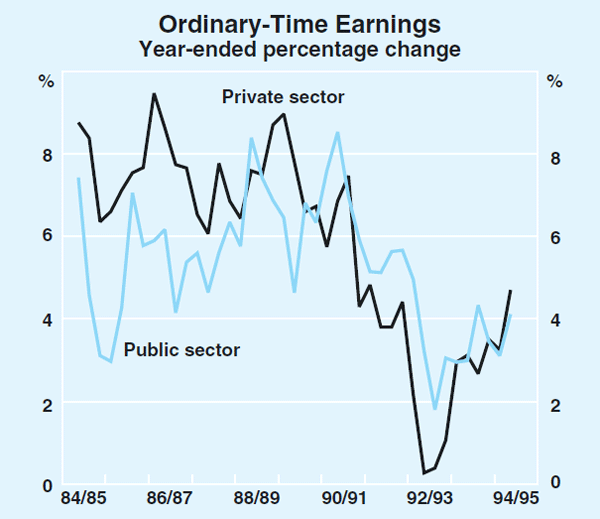
Data on the average annualised wage increases resulting from enterprise bargaining at the Federal level are also consistent with some pick-up in labour cost growth during 1994. Wage outcomes in the private sector increased from 3–4 per cent in 1993, to somewhere in the 4–5 per cent range in 1994. Salaries for managers and executives appear to have outpaced average earnings growth in 1994, as in most years over the past decade. The Cullen Egan Dell Quarterly Salary Review, for example, put growth of salaries for senior executives at 5¾ per cent over the year to December 1994.
Future trends in wage and salary costs will depend in part on labour market conditions. Data on job vacancies, often thought to be a leading indicator of employment, have been distinctly softer in recent months. The ABS series fell by 17.0 per cent in the three months to February, with the fall being concentrated in the private sector. The DEET measure of skilled vacancies fell by 9.0 per cent in the March quarter. The ANZ Bank's measure of job vacancies also fell in February and March. In each case, vacancies remain well above the levels of a year ago. The high levels of vacancies are consistent with continued employment growth, but suggest that the pace at which demand for labour is expanding might be somewhat slower than it has been over the past year. Overtime hours worked also fell by 5.3 per cent in the three months to February, following a fall of 3.2 per cent in the previous period.
Inflation expectations
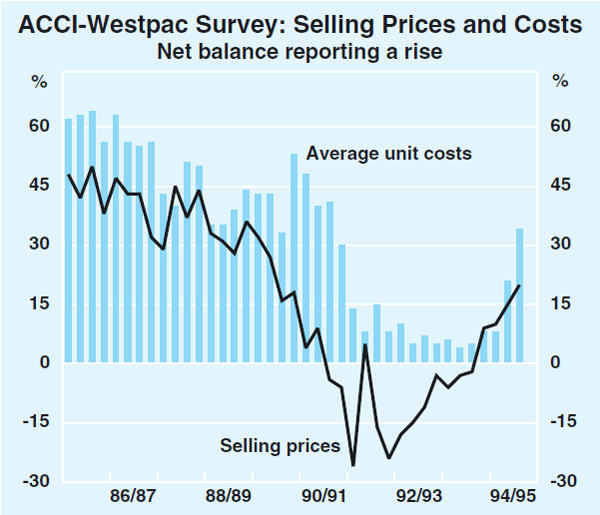
There is further evidence of inflationary pressure in survey and expectations data. According to the ACCI-Westpac survey, the net balance of manufacturing firms reporting an increase in unit labour costs rose strongly again in the March quarter (see Graph 21). Moreover, many firms expect costs to increase further in the June quarter. In terms of selling prices, a net balance of 20 per cent recorded an increase in selling prices in the March quarter. A net balance of 32 per cent predict a rise in the June quarter; the increases are expected to be highest in the paper, chemicals, petroleum and coal products industries. A majority of firms – 55 per cent – still reported no change in selling prices, although this is well down on the 69 per cent reporting no change in December.
Forecasts published in March by Consensus Economics Inc. for CPI inflation in 1995 were 4.2 per cent, more than half a percentage point higher than the expectations held six months ago. The average forecast for CPI inflation in 1996 is 4.1 per cent. These increases mostly reflect expectations about the impact of higher mortgage interest costs on the CPI. The present pick-up in underlying inflation is expected to be more moderate.
Consumers' expectations about inflation, as gauged by the Melbourne Institute measure, have changed little. The median expectation in the sample fell to 4.6 per cent in March from 5.3 per cent in February and 5.1 per cent in January. This measure of inflation expectations has generally fluctuated between 4 and 5 per cent for the last two and a half years.
Outlook
During 1995, both the underlying and headline inflation rates will increase. The underlying rate of inflation is expected to move upwards – and could rise above 3 per cent – during 1995, as a result of stronger demand conditions, increasing wage and salary costs, and higher raw material input prices. The recent depreciation of the Australian dollar, if it were to be sustained, would also add, over time, to underlying inflation.
The impact of rising interest rates in the second half of 1994 will amplify the increase in the headline CPI, taking it into the 3–4 per cent range in the year to the March quarter. By reflecting in higher inflation the effects of actions designed to reduce inflationary pressures, the headline CPI disqualifies itself as a reliable guide to inflationary pressures in the economy.
Prospective developments on inflation owe more to the inherent dynamics of the business cycle than they do to any loss of resolve on the part of the authorities to maintain low inflation. This cyclical variation in inflation, as well as the fairly wide margin of uncertainty around forecasts of inflation, are among the reasons why the Bank has eschewed a narrow, hard-edged inflation target, preferring instead to focus on keeping the average rate of underlying inflation to 2 to 3 per cent over a run of years. Monetary policy will continue to be directed towards maintaining that outcome.
Financial Markets
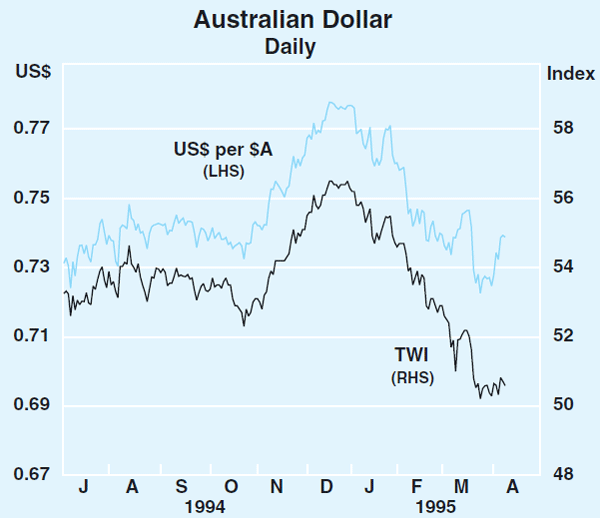
Views in international financial markets about the prospects for the Australian dollar and Australian assets took a turn for the worse in the March quarter. This was particularly the case in the foreign exchange market, with the Australian dollar falling throughout the March quarter against a weakening US dollar, resulting in a more marked fall in trade-weighted terms. These developments reflected a combination of domestic and international factors. The former included the deterioration in prospects for the current account, and uncertainties about possible adjustments of fiscal and monetary policies. Concerns of these kinds were heightened by the crisis in Mexico which caused international investors to become more cautious about countries relying heavily on foreign capital, as well as raising additional doubts about the outlook for the US economy and causing a levelling out in commodity prices. Both sets of factors – domestic and international – will continue to exert strong influences over movements in local exchange rates and interest rates.
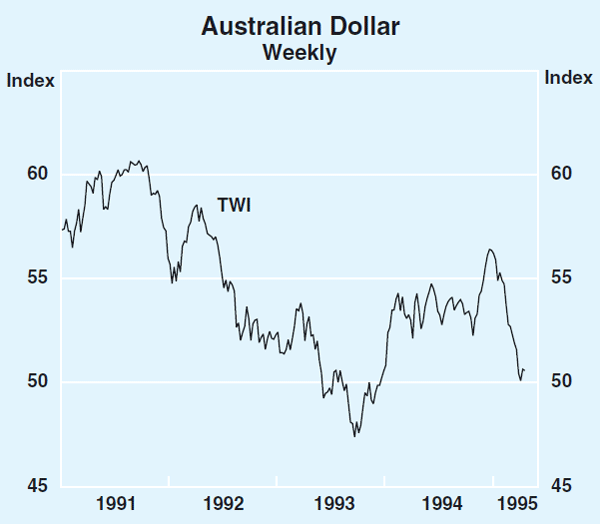
By early April, the Australian dollar had fallen by 11 per cent in trade-weighted terms from its peak in late December, and by 5 per cent against the weaker US dollar (see Graph 22). In trade-weighted terms, the currency was 7 per cent above the historical low recorded in September 1993 (see Graph 23).
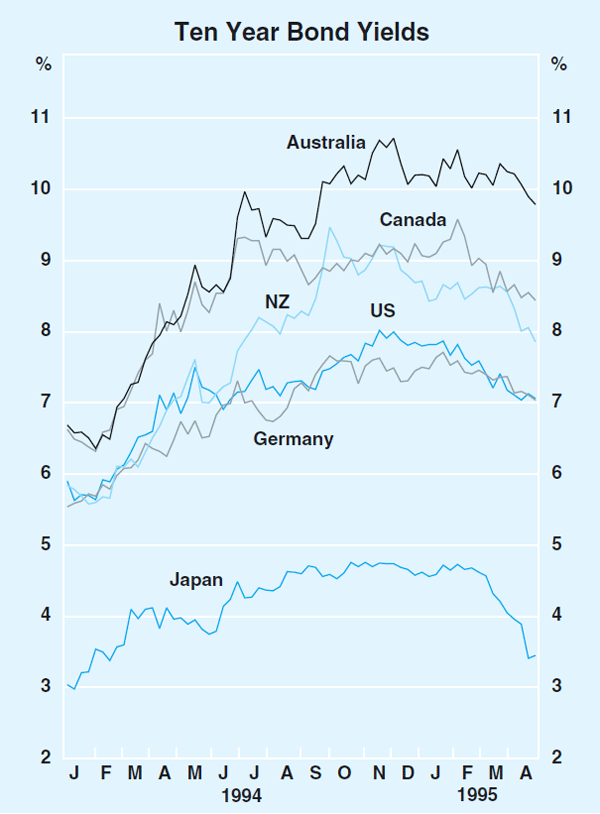
Similar forces operated to dampen sentiment in the bond market. The yield on 10-year bonds generally traded in the range of 10.0 per cent to 10.5 per cent during the quarter, before dipping under 10 per cent on the back of weaker-than-expected national accounts data. There was little net change over the quarter in contrast to the rallies in many overseas bond markets (see Graph 24). Ten-year bond yields in the US fell by 0.7 of a percentage point to 7.1 per cent in early April, while in Japan and Germany they fell by 1.1 per cent and 0.6 per cent respectively. The spread between Australian 10-year bonds and their US counterparts increased by about 0.5 of a percentage point, to over 2.5 percentage points.
Australian share prices fell marginally over the quarter. In the past, the Australian share market has tended to follow the US market, but in the latest quarter it did not do so; US share prices rose strongly over the quarter (8 per cent) to reach new record highs. A stronger tone was, however, evident in Australian markets in the first week of April.
The implications of these developments need to be assessed in the international context in which they occurred. In the case of the exchange rate, part of the fall in trade-weighted terms could be explained by the weakness of the US dollar on world markets. The Australian dollar tends to be viewed as part of a ‘dollar bloc’ of currencies and more often than not moves in the same direction as the US dollar. The latter fell by 11 per cent against the deutschemark and 13 per cent against the yen over the quarter. Some of this fall was attributable to the growing view that the US economy was slowing and that the rise in official interest rates had run its course following the tightening in early February.
Other factors also appear to have influenced the decline in the US dollar, including a flight into deutschemarks from other European currencies, reflecting concerns about the economic and political situation in some of these countries. This prompted a re-alignment in the European Exchange Rate Mechanism, with Spain devaluing by 7 per cent and Portugal by 3.5 per cent. The British pound and the Italian lira, which had withdrawn from the ERM a couple of years ago, fell to new lows against the deutschemark. The fall in the US dollar exchange rate against the yen partly reflected increased caution on the part of Japanese investors, which reduced their appetite for non-yen investments. This tendency was reinforced by balance sheet adjustments ahead of the end of the Japanese fiscal year on 31 March.
While part of the fall in the Australian dollar in TWI terms reflects these various influences on the US dollar, part also clearly reflected concerns specific to Australia. Other currencies which often move in tandem with the Australian dollar – namely, the New Zealand dollar and the Canadian dollar – were stronger during the quarter; in both cases, they were underpinned by further rises in official interest rates. In the case of the bond market, yields fell not only in the three major countries, but also in all others except Italy, Spain and Sweden. Of more direct relevance to Australia, yields in Canada and New Zealand fell sharply to 8.5 per cent and 7.9 per cent respectively by early April.
Monetary and credit growth
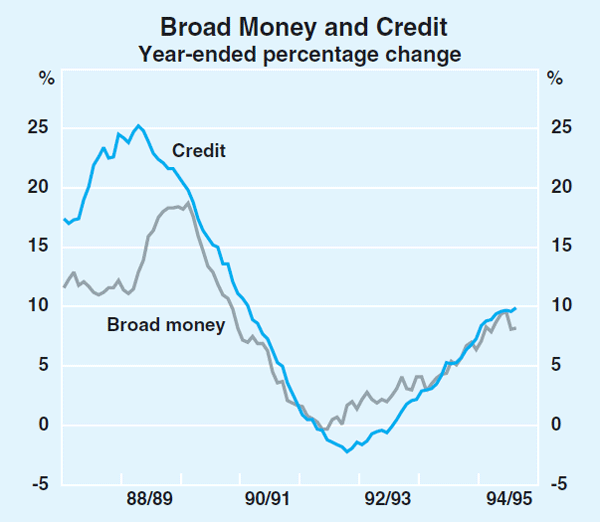
Growth of credit outstanding to the private sector has been slightly lower over recent months than it was through much of 1994 (see Table 4). Total credit grew at an annual rate of around 7 per cent over the three months to February, compared with 9½ per cent over the previous three months. Growth over the year to February was around 10 per cent.
| 6 months to: | 3 months to: | ||||
|---|---|---|---|---|---|
| Aug 1994 | Feb 1995 | Nov 1994 | Feb 1995 | ||
| Credit | 11.5 | 8.3 | 9.4 | 7.2 | |
| – housing | 25.6 | 15.7 | 17.2 | 14.2 | |
| – personal | 7.2 | 8.4 | 6.1 | 10.7 | |
| – business | 3.5 | 3.1 | 4.7 | 1.5 | |
| Broad Money | 10.1 | 6.4 | 8.7 | 4.2 | |
| * Growth rates for all series are adjusted for series breaks. | |||||
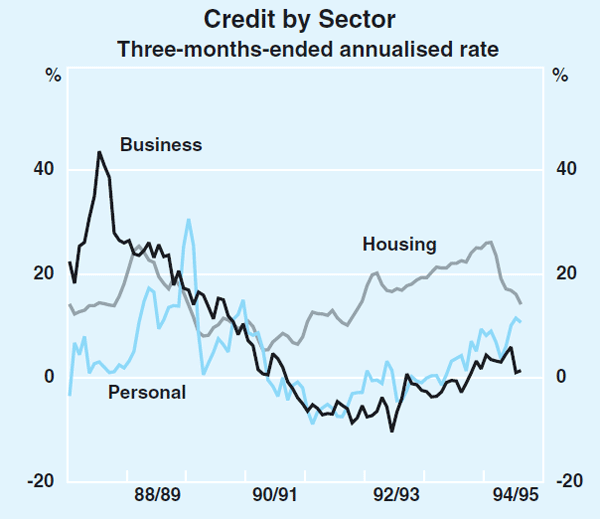
This growth in total credit masks divergent trends in its components (see Graph 25). Growth in housing credit has slowed from annual rates of around 25 per cent in mid 1994 to 14 per cent over the latest three months; this is consistent with the reduction in new lending approvals for housing. Growth in personal credit, on the other hand, has tended to pick up and was running at an annual rate of around 11 per cent over the three months to February, compared with 6 per cent over the three months to November. This is consistent with both robust consumer demand and a longer-term trend to higher levels of household indebtedness.
On the other hand, growth in business credit remains weak. The annualised rate of growth in business credit was less than 2 per cent over the three months to February. Broader measures of credit to business, which include borrowings from abroad, show even weaker growth. This is taken to reflect a preference among companies for funding their investment and other requirements from internal sources. Strong profit growth in recent years, combined with the balance-sheet restructuring begun in the early 1990s, has meant that many firms have sufficient internal funds to meet their expansion plans. Business analysts forecast that balance-sheet restructuring has not yet run its course, with strong profits expected to allow many firms to reduce further their debt levels in 1995/96. In this event, therefore, any continued weakness in business credit statistics would not necessarily infer a deterioration in business conditions.
A similar phenomenon appears to lie behind the slightly lower growth of broad money compared with credit over the past year (see Graph 26). The build-up in capital positions of intermediaries, particularly banks, helped by strong profit performances, has meant that growth in credit to the private sector extended by intermediaries has been funded to an increasing extent by shareholders' funds, rather than deposits. As a consequence, the broad monetary aggregates, which are made up predominantly of the deposit liabilities of intermediaries have, on average, grown somewhat more slowly than has credit. Monetary growth has followed the same broad pattern as credit, however: it has eased in recent months after a period of strong growth in the earlier part of 1994. Growth in M1 has slowed quite sharply from very high rates seen over several years. This reflects two factors: one is the increases in cash rates, which flowed through to deposit rates and increased the opportunity cost of holding currency and non-interest-bearing current accounts, while the other has more to do with an apparent end to a series of reclassifications of deposit accounts (which had acted to boost the M1 figures).
