Bulletin – August 1995 Australia's Export Performance in Asia[*]
- Download 49KB
Introduction
The rapid growth over the past decade of merchandise exports to Asia is one measure of Australia's increasing engagement with that region.[1] Despite this growth, however, Australia's market share has not changed substantially. This has been a disappointment to those who had expected our increasing Asian focus to be matched by an increase in our share of Asian trade.
It is argued in this article that Australia's export performance in Asia has been stronger than that implied by usual notions of total market share, for two reasons. First, the rapid growth of intra-regional trade among the countries in Asia conceals the fact that Australia has increased its share of the Asian market for imported goods relative to other countries from outside the region. Second, compositional differences between Australia's exports and Asia's imports which have held down Australia's total market share, conceal solid increases in market shares for both resource-based and manufactured goods.
Market Shares in Non-Japan Asia
The Effect of Intra-Regional Trade
The growth of trade in the countries of east and south-east Asia particularly has been extremely rapid over the past twenty years. These economies typically have a high trade orientation and exports have tended to drive growth. Higher incomes have, in turn, induced more imports so that both exports and imports have increased markedly as shares of national income.
A notable feature has also been the rapid expansion over the past 15 years of intra-Asian trade, not unlike the rapid expansion of intra-European trade in the 1960s and 1970s. As with Europe, geographical proximity, rising incomes and the growing sophistication of production capacity within the region (reinforced by foreign direct investment) combined to create burgeoning trade opportunities. As a consequence, the share of total Asian imports supplied by countries outside the region has declined. Between 1983 and 1994, the share of non-Japan Asia's imports sourced from within the region rose from 26 per cent to 39 per cent (Table 1). Most of this rise was at the expense of other developing countries; the share of imports purchased from the industrial countries fell slightly. Australia's share has remained fairly steady at around 2½ per cent since the early 1980s.
| 1983 | 1984 | 1985 | 1986 | 1987 | 1988 | 1989 | 1990 | 1991 | 1992 | 1993 | 1994 | |
|---|---|---|---|---|---|---|---|---|---|---|---|---|
| Industrial countries |
101.2 | 109.5 | 113.8 | 127.6 | 155.0 | 197.1 | 215.9 | 238.2 | 266.7 | 296.7 | 337.6 | 401.4 |
| % of total | (55.8) | (56.2) | (54.6) | (58.7) | (57.8) | (57.3) | (56.6) | (55.6) | (55.0) | (52.7) | (53.6) | (54.6) |
| Japan | 39.9 | 44.4 | 46.2 | 52.0 | 61.6 | 77.0 | 82.4 | 89.3 | 105.3 | 117.1 | 136.2 | 155.4 |
| (22.0) | (22.8) | (22.2) | (23.9) | (23.0) | (22.4) | (21.6) | (20.8) | (21.7) | (20.8) | (21.6) | (21.2) | |
| Europe | 26.2 | 27.5 | 31.4 | 38.3 | 47.0 | 53.7 | 59.5 | 69.9 | 73.2 | 83.2 | 96.8 | 118.3 |
| (14.4) | (14.1) | (15.1) | (17.6) | (17.5) | (15.6) | (15.6) | (16.3) | (15.1) | (14.8) | (15.4) | (16.1) | |
| United States |
26.8 | 28.3 | 26.9 | 27.5 | 33.8 | 48.4 | 55.3 | 58.1 | 64.5 | 70.1 | 78.1 | 98.6 |
| (14.7) | (14.5) | (12.9) | (12.7) | (12.6) | (14.1) | (14.5) | (13.5) | (13.3) | (12.5) | (12.4) | (13.4) | |
| Australia | 4.2 | 5.1 | 5.3 | 5.2 | 6.3 | 8.7 | 9.9 | 11.1 | 13.1 | 14.8 | 15.1 | 17.6 |
| (2.3) | (2.6) | (2.5) | (2.4) | (2.4) | (2.5) | (2.6) | (2.6) | (2.7) | (2.6) | (2.4) | (2.4) | |
| Canada | 3.0 | 3.1 | 3.0 | 3.2 | 4.1 | 6.3 | 5.5 | 5.9 | 6.8 | 6.4 | 5.5 | 5.8 |
| (1.6) | (1.6) | (1.5) | (1.5) | (1.5) | (1.8) | (1.4) | (1.4) | (1.4) | (1.1) | (0.9) | (0.8) | |
| New Zealand | 0.7 | 0.7 | 0.7 | 0.8 | 1.0 | 1.4 | 1.4 | 1.5 | 1.7 | 1.9 | 2.1 | 2.3 |
| (0.4) | (0.4) | (0.3) | (0.4) | (0.4) | (0.4) | (0.4) | (0.3) | (0.3) | (0.3) | (0.3) | (0.3) | |
| Other* | 0.6 | 0.4 | 0.3 | 0.5 | 1.2 | 1.7 | 2.0 | 2.6 | 2.3 | 3.3 | 3.9 | 3.4 |
| (0.3) | (0.2) | (0.1) | (0.2) | (0.5) | (0.5) | (0.5) | (0.6) | (0.5) | (0.6) | (0.6) | (0.5) | |
| Developing countries |
80.3 | 85.3 | 94.5 | 89.9 | 113.1 | 146.6 | 165.9 | 190.5 | 218.5 | 265.9 | 292.1 | 333.5 |
| % of total | (44.2) | (43.8) | (45.4) | (41.3) | (42.2) | (42.7) | (43.4) | (44.4) | (45.0) | (47.3) | (46.4) | (45.4) |
| Non-Japan Asia |
47.1 | 54.2 | 57.4 | 59.1 | 80.2 | 108.8 | 126.5 | 149.8 | 184.5 | 220.1 | 239.7 | 284.5 |
| (25.9) | (27.8) | (27.6) | (27.2) | (29.9) | (31.6) | (33.1) | (34.9) | (38.0) | (39.3) | (38.1) | (38.7) | |
| Middle East | 19.6 | 17.1 | 21.1 | 14.5 | 14.5 | 15.4 | 17.0 | 19.1 | 18.5 | 23.1 | 24.8 | 24.8 |
| (10.8) | (8.8) | (10.1) | (6.7) | (5.4) | (4.5) | (4.4) | (4.5) | (3.8) | (4.1) | (3.9) | (3.4) | |
| Other developing countries |
13.6 | 14.0 | 16.0 | 16.3 | 18.4 | 22.4 | 22.4 | 21.7 | 15.5 | 21.8 | 27.8 | 24.2 |
| (7.5) | (7.2) | (7.7) | (7.5) | (6.9) | (6.5) | (5.9) | (5.1) | (3.2) | (3.9) | (4.4) | (3.3) | |
| Total | 181.6 | 194.9 | 208.3 | 217.5 | 268.1 | 343.7 | 381.8 | 428.8 | 485.2 | 562.5 | 629.8 | 734.8 |
|
* The United Nations classify Israel and South Africa as industrial countries. This may also contain a small discrepancy between the total and the sum of individual countries.
Sources: United Nations, International Trade Statistics Yearbook. |
||||||||||||
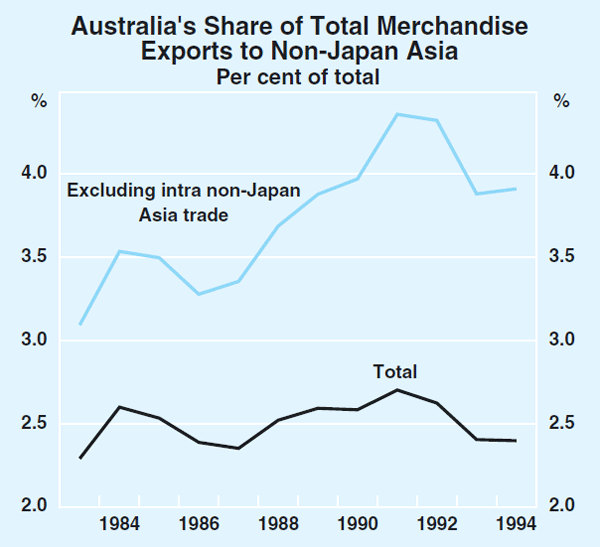
Graph 1 shows Australia's total market share relative to other suppliers from outside the region over the past decade. It shows a gradual increase, from around 3 per cent to around 4 per cent. Most of this improvement occurred in the late 1980s, when economic growth in Australia was quite strong, which suggests it was more than a cyclical phenomenon.

The Share of Specific Markets
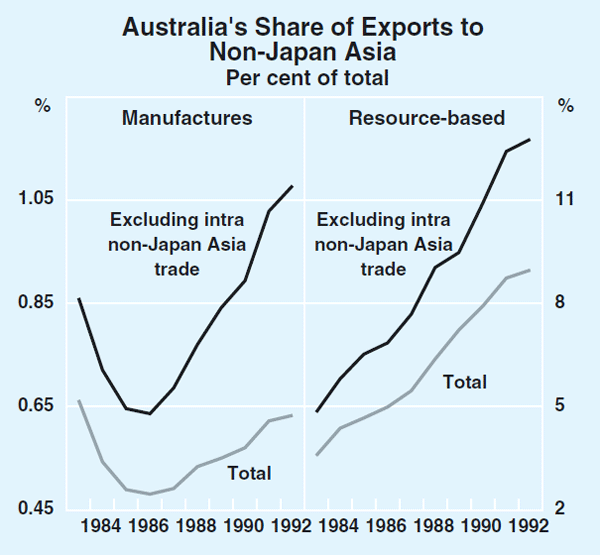
So much for the overall picture: what about trends in the major components? The value of Australian manufactured exports to non-Japan Asia, after very little growth in the early 1980s, grew at an annual rate of 23 per cent (in US$ terms) between 1985 and 1994. Along with Europe, the US and Japan, Australia's market share of Asian imports of manufactures has declined since 1983, as intra-Asian trade rose sharply. When intra-regional trade is excluded, however, Australia's share of the remainder increases, although it remains small (Graph 2). Data are not available beyond 1992 but, given the continued robust growth in Australia's manufactured exports to Asia over recent years, it is likely that Australia's market share has at least held these higher levels.

The performance of resource-based exports is little different whether or not intra-Asian trade is excluded (Graph 2). On either basis, Australia's market share has increased strongly since the early 1980s. Excluding intra-Asian trade, our share has risen from a little less than 5 per cent in 1983 to 13 per cent in 1992. The United States, Europe, Japan and Canada have also made gains; the main losers have been oil-producing nations. (Australia still records an increased share if oil-producing countries are excluded from the analysis.) Since 1992, growth of resource-based exports to the region has slowed, suggesting that market share may have levelled out or fallen a little in recent years.
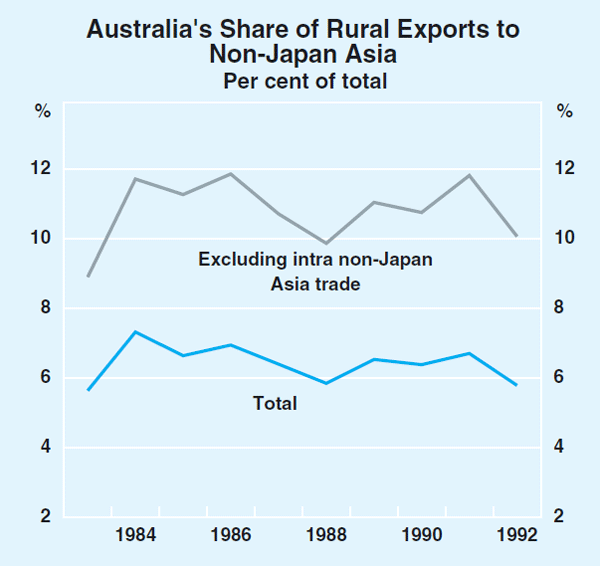
In contrast to manufacturers and resource-based exports, Australia's share of rural exports has shown little change over this period (Graph 3). For the past decade it has averaged about 6½ per cent, or around 11 per cent when intra-regional trade is excluded. Over the past decade, industrial countries have accounted for half of the rural commodities imported into non-Japan Asia. The US has contributed over one-third of these, with Europe making up a further 10 per cent. New Zealand's share has risen since the mid 1980s to 2½ per cent, while Canada's share has remained at around 4½ per cent. Australia's rural exports to non-Japan Asia have grown quite solidly over the past couple of years, suggesting its market share has probably changed little since 1992.

Conclusions
Asia's demand for imports in categories where Australia's market share is substantial (namely rural and resource commodities) is growing more slowly than its demand for manufactures, where Australia's share – while rising quickly – remains quite small. This has meant that Australia's share in Asia's total imports (excluding intra-Asia trade) has increased only modestly since 1986. Nevertheless, our market share for manufactures and resource-based commodities has increased strongly since the mid 1980s, and rural exports have maintained their market share.
Footnotes
This article was prepared principally by Mark Rider, of the Bank's Economic Analysis Department. [*]
This article focuses on non-Japan Asia, which includes countries from east and south-east Asia, along with countries further west, such as India and Pakistan. While the main interest is in trade with the rapidly-growing east and south-east Asian nations, the United Nations data used to calculate market shares do not distinguish between these and other Asian countries. [1]