Bulletin – October 1995 Quarterly Report on the Economy and Financial Markets
- Download 1.39MB
Introduction
The world economy has provided a reasonably stable international environment for Australia, with moderate growth in most countries except Japan, and generally low inflation. Monetary policy has eased in a number of major countries where low wage and price pressures have created opportunities for lower interest rates. This international climate has led to a more positive sentiment in global financial markets over recent months, reflected in part in the return of the yen to more sustainable levels. The same sentiment has flowed on to financial markets in Australia, with bond yields falling and the Australian dollar reversing its depreciation in the first half of 1995. Firm commodity prices and a sharper than expected fall in the current account deficit have also helped the Australian dollar.
Indicators of growth in the domestic economy are mixed but, on balance, suggest that the economy is running at a sustainable rate. Employment growth has moderated, in part reflecting the slowing in activity from the unsustainable pace of 1994. Most consumption indicators remain strong and business investment intentions point to continuing growth in capital expenditure, although not at the rapid pace of the last couple of years.
Both housing and inventories are undergoing adjustments which are likely to see them detract from growth in the present half year. As the pace of the recovery slowed over the past year, inventories built up: as these are reduced, output (particularly in manufacturing) will be restrained. This inventory adjustment appears to be now underway, with manufacturing output relatively weak recently and import volumes falling. The slowdown in manufacturing has been reflected in surveys of manufacturing firms. Combined with the cyclical weakness of housing, it has dampened business sentiment to some extent. These adjustments are complicating the interpretation of economic trends but underlying conditions remain positive, with profits generally at a good level and the rural sector poised to bounce back as the drought eases. Commodity prices are significantly above their trough and the macro policy settings – both monetary and fiscal – are conducive to continuing moderate expansion.
Despite the moderation in the pace of growth, inflationary pressures have increased, in part as a consequence of the surge in growth in 1994. After more than three years of underlying inflation of around 2 per cent, the rate rose to 2.5 per cent over the year to the June quarter; the headline rate was 4.5 per cent. Underlying inflation is expected to increase further over the year ahead, with the annual rate likely to exceed 3 per cent. This prospect has been foreshadowed and is not inconsistent with the Bank's inflation objective, provided that inflation returns to the 2–3 per cent range within a reasonable period of time.
Several developments should be helpful in that regard. First, the current slower rates of growth in activity and employment are more conducive to price stability than those recorded in 1994. Secondly, the earlier threat posed by the falling exchange rate has now been reversed, with the exchange rate currently some 5 per cent above the level assumed in the Budget forecasts. Thirdly, evidence from surveys and from the bond market reinforce the view that medium-term inflation expectations remain fairly steady. On the other hand, increases in wages have been on the high side. Most enterprise bargains are now incorporating annualised increases of around 5 per cent, with some (including executive salaries) running considerably higher. The Statistician's measure of the rate of increase in full-time workers' earnings has been running close to 5 per cent, with the private-sector component closer to 6 per cent. A stronger exchange rate, and some squeezing of profit margins, would help to cushion final prices temporarily from higher labour costs, but on-going wage increases over 5 per cent would not be consistent with holding inflation to between 2 and 3 per cent.
Against this background, current monetary policy settings are consistent with projected trends in economic growth and inflation, but a close watch is being kept on both activity and cost indicators.
The International Economy
Economic growth in each of the three major economies slowed by varying degrees in the first half of 1995 (see Graph 1). This has generated policy adjustments in each, with cuts in official rates in the United States, Germany and Japan; the Japanese government has also applied additional budgetary stimulus. Market developments have generally been favourable for economic activity, including in Japan, where the weaker yen, higher share prices and low bond yields should help to encourage a gradual recovery. Inflation is well under control in all the major countries.
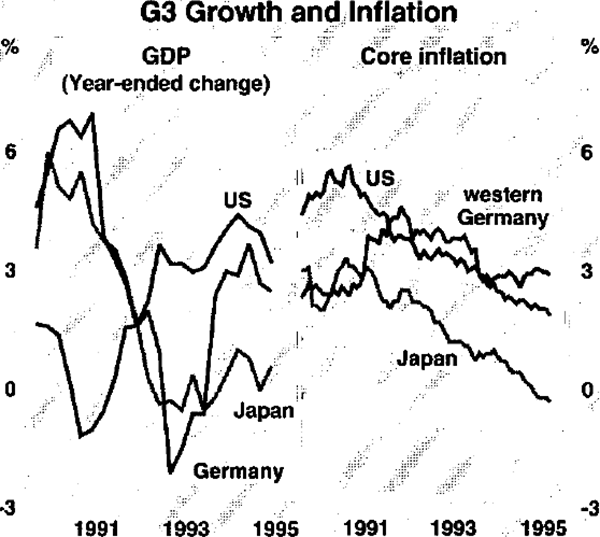
In the United States, the unwinding of the inventory cycle slowed growth in the first half of 1995, but recent indicators suggest a return to moderate growth in GDP of 2 per cent or a little more. Industrial production and housing starts increased at average rates of 0.7 per cent and 3.8 per cent, respectively, in July and August, while in the three months to September, employment rose by an average of 137,000 per month and the unemployment rate averaged 5.6 per cent. These developments, coupled with continuing high levels of consumer and business confidence, and strong corporate profitability, have led to a small upward revision in forecasts for growth for 1996, to 2.6 per cent, compared with 2.9 per cent in 1995.
Despite the improved outlook for activity, there are no signs of any significant increase in inflation. Core producer and consumer prices rose by 2.0 and 2.9 per cent, respectively, in the year to August. Wages are rising at about the same pace as consumer prices.
Developments in Japan over the past few months should encourage a gradual recovery. GDP increased in the June quarter to be Subsequent indicators suggest that the recovery in activity remains weak: industrial production fell in each of the four months to July before rising in August; it remains 2.6 per cent below its recent peak in March. The unemployment rate remains at 3.2 per cent – an historical high for Japan – and the Bank of Japan's August Tankan survey showed no improvement in business sentiment. A government plan to deal with difficulties in the financial system was released on 27 September, but these difficulties could take years to resolve fully. The problems were highlighted in August, with the Bank of Japan announcing that the Kobe-based Hyogo bank would be dissolved, along with two credit unions.
In response to the continuing weakness of the economy, the Bank of Japan eased monetary policy and the authorities announced another package of budgetary stimulus. The fiscal package announced on 20 September included spending proposals totalling US$137 billion (3.3 per cent of GDP), a little over half of which is thought to be new spending which should boost activity. This and previous packages are estimated to produce a general government deficit in Japan of between 4½ and 5 per cent of GDP in 1995. The substantial reversal of the earlier appreciation of the yen in the September quarter, together with the rise in equity prices, are additional favourable influences for Japanese growth over the next year.
In Europe, economies generally have been growing at a moderate pace, with economic activity in the European Union countries rising at an average rate of around half of a per cent in the June quarter. Despite this, little progress is being made in reducing unemployment rates. Wage and price pressures generally remain subdued. In Germany, inflation has fallen to its lowest level in seven years, with consumer prices rising by 1.7 per cent in the year to September. While German growth picked up in the June quarter – with GDP increasing by 1.1 per cent and by 2.5 per cent over the year – the rate of expansion has slowed from rates in the first half of 1994. This slowdown is evident elsewhere in Europe, with a number of countries experiencing a decline in growth in the June quarter. In France and the United Kingdom, GDP increased by 0.3 and 0.5 per cent respectively over the quarter. This compares with average quarterly growth rates in the previous year of around 1 per cent for both countries.
The softer economy and falling inflation saw the Bundesbank cut the discount and Lombard rates by ½ of a percentage point in August and gradually lower the repurchase rate. Following the Bundesbank's lead, interest rates were cut also in France, Belgium, the Netherlands, Denmark, Austria, Ireland and Portugal.
Growth in the Asian economies remains buoyant, although the pace of growth in South Korea, Taiwan and China slowed slightly in the June quarter. In a number of countries, growth has been running above estimates of the sustainable rate and generating concerns about possible inflation pressures. To date, however, consumer price inflation in most East-Asian countries has been below rates recorded for 1994, with Thailand and Indonesia being the major exceptions. Slowing growth in China has reduced the inflation rate, which has fallen from around 25 per cent in 1994 to around 15 per cent over the twelve months to August. In New Zealand, underlying inflation – at an annual rate of 2.2 per cent – marginally exceeded the Reserve Bank of New Zealand's (RBNZ) 0–2 per cent inflation target in the June quarter. The RBNZ forecasts that underlying inflation will return to the target band in the September quarter.
Overall, growth in Australia's major trading partners is currently running at around 4 per cent. The major uncertainty continues to be the timing of the Japanese recovery, although – given policy adjustments and market developments – the prospects there look better than for some time.
The relatively benign outlook for the world economy, combined with large falls in stocks of aluminium, nickel and copper, has seen a significant increase in base metal prices from their trough in May; on average, prices are currently around 7 per cent higher than at the end of May and 52 per cent higher than at their trough in November 1993 (see Graph 2). Contract prices for bulk commodities such as coal and iron ore which, for Australian exporters, were set earlier in the year in terms of US dollars, have risen in effective terms as a result of the US dollar's appreciation. In contrast, wool prices fell sharply over the quarter, reflecting weaker and more erratic demand conditions; the Eastern Market Indicator averaged 680 cents per kg in September, a fall of 18 per cent from the recent peak in March. Cotton and sugar prices also fell over the quarter but wheat prices continued to rise.
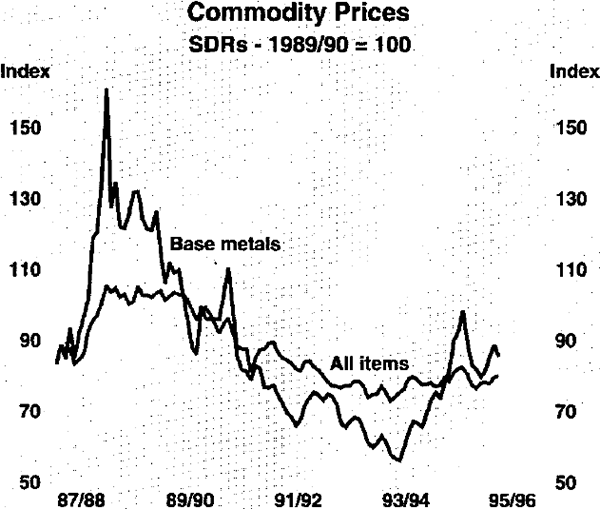
As a result of these diverse developments, the Bank's Commodity Price Index in SDR terms increased by 2.4 per cent over the three months to the end of September. With strong appreciations of both the US dollar and A$ against the SDR in the quarter, the index measured in those currencies has fallen over the past three months. Overall, the outlook for commodity prices remains positive, but recent events suggest that price movements will continue to be sensitive to changes in sentiment about the world economy, as well as to particular developments in individual sectors.
Australia's terms of trade rose by 1.3 per cent in the June quarter and by 5.9 per cent over the year to the June quarter.
Domestic Activity
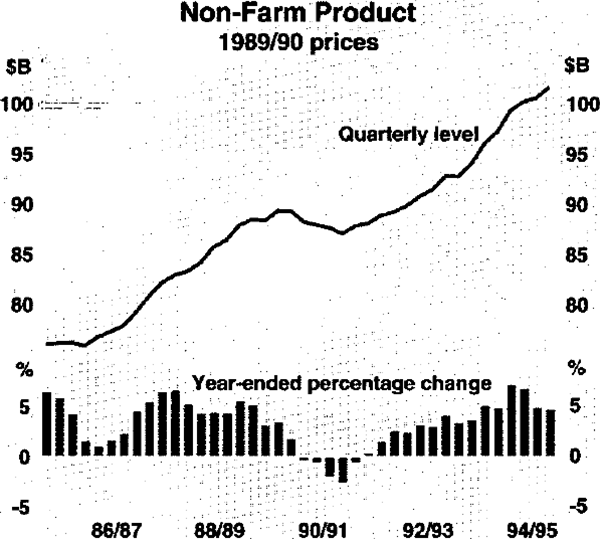
GDP rose by 1.0 per cent in the June quarter and by 3.7 per cent over the year to June; non-farm GDP was 4.6 per cent higher than a year earlier (see Graph 3). Consumer spending and business outlays on equipment remained quite firm. On the other hand, housing investment continued to decline and recorded activity in the non-residential construction sector was surprisingly weak, given approvals and other data. Stocks increased substantially in the June quarter, which served to hold up production in the face of weaker demand. Other indicators of activity – notably import volumes and employment – are now also consistent with the evidence of slower growth in the economy.
The household sector
Private consumption has continued to increase strongly, rising by 1.1 per cent in real terms in the June quarter, and by 5.1 per cent over the year. Recent partial indicators suggest further growth into the September quarter (see Graph 4). In particular, the value of retail trade rose strongly in July and August, to an average level 3.1 per cent higher than the average for the June quarter. In contrast, passenger vehicle registrations fell in July and August to an average level 8 per cent below the average for the June quarter. This large fall reflects, in part, the changes in sales tax on motor vehicles announced in the May budget which brought forward registrations to early in the June quarter.
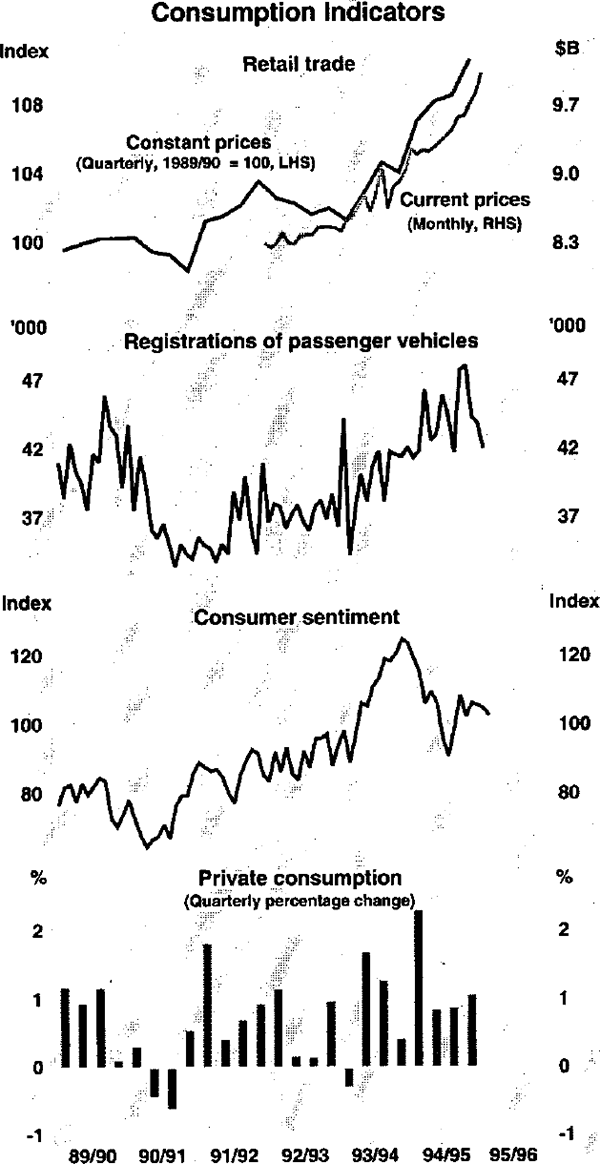
Consumer spending continues to grow more quickly than real household disposable income, with the saving rate falling further in the June quarter. This rate is now around 3 per cent of household disposable income, about 5 percentage points below its average level during the 1980s. The saving rate has been depressed by the effects of sustained drought on parts of the farm sector. It is also prone to upward revisions. Nonetheless, the recorded trends in consumption and saving are consistent with a greater appetite for gearing displayed by the household sector and $B the recent fast growth in credit for personal purposes.
Over the twelve months to August, personal credit outstanding increased by 11.2 per cent. Both the number of loans and, until recently, 8.3 the average size of loans have been rising quickly. These movements are most evident in loans for motor vehicles which account for a substantial share of personal credit. Notwithstanding recent trends, the interest 42 burden on personal credit remains well below the debt service ratio evident in the late 1980s, 37 reflecting lower nominal interest rates and steady growth in nominal income.
Consumer sentiment, as measured by the Westpac-Melbourne Institute Index, recorded a small fall in the September quarter but remains at a level consistent with further growth in consumer spending. Sustained growth in employment and steadiness in interest rates have been positive factors for consumer confidence.
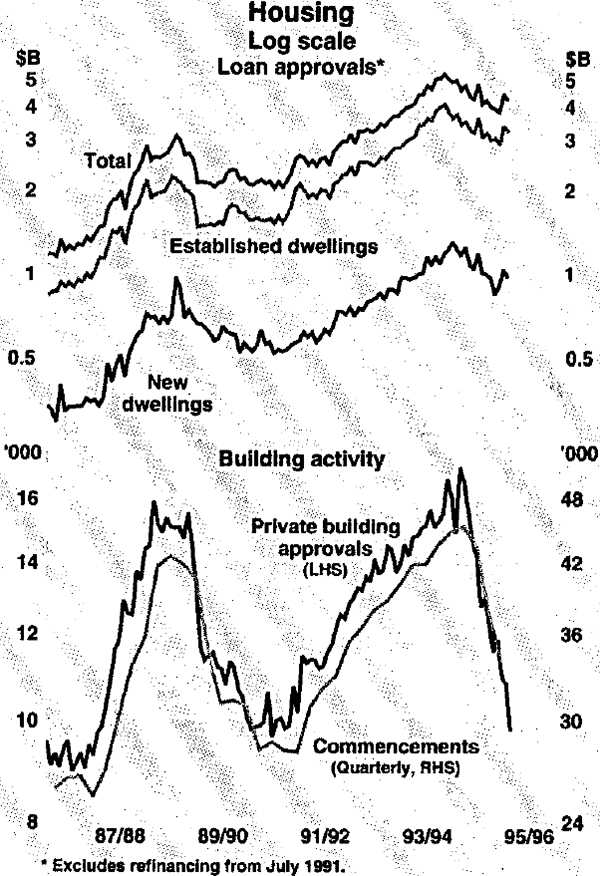
Activity in the housing sector has contracted. Dwelling investment fell by 6.3 per cent in the June quarter, with over half of this fall attributable to a decrease in work done on alterations and additions. Dwelling commencements fell by 10.0 per cent in the June quarter and, with further falls in building approvals in recent months, commencements will almost certainly show a further fall in the September quarter (see Graph 5). Dwelling investment is expected to follow a similar pattern in the September quarter and remain subdued until the excess stock of properties from over-building in the boom is worked off (see article entitled ‘Trends in the Housing Sector’ in the September Bulletin for more details). In the meanwhile, the stock of outstanding mortgage debt continues to grow, rising by 13.8 per cent over the year to August.
Business conditions
With the exception of the construction and manufacturing sectors, most sectors have continued to experience quite solid growth over recent quarters (see Graph 6). Manufacturing and construction both experienced rapid growth earlier in the recovery, but are now undergoing a slowdown. In manufacturing, this slowdown follows three years of solid expansion. In the construction sector, forward-looking indicators point to higher levels of non-residential activity over the year ahead.
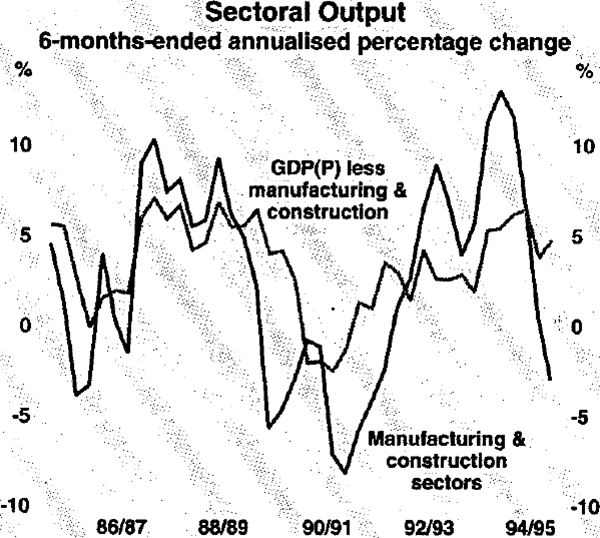
The current weakness in manufacturing output is being reflected in manufacturers' responses to surveys. The latest ACCI-Westpac survey of manufacturers suggests that manufacturing activity was again subdued in the September quarter. Despite this, business sentiment has improved and expectations of future activity are brighter. The net balance of firms expecting deteriorating business conditions in the next six months fell from 25 per cent in the June quarter, to 1 per cent in the September quarter. A similar picture emerges from the Australian Chamber of Manufactures/Telstra Survey. This improvement in sentiment, however, masks a wide divergence of results: large firms are generally more optimistic about their outlook than small firms, and firms producing mainly for the housing industry remain quite pessimistic.
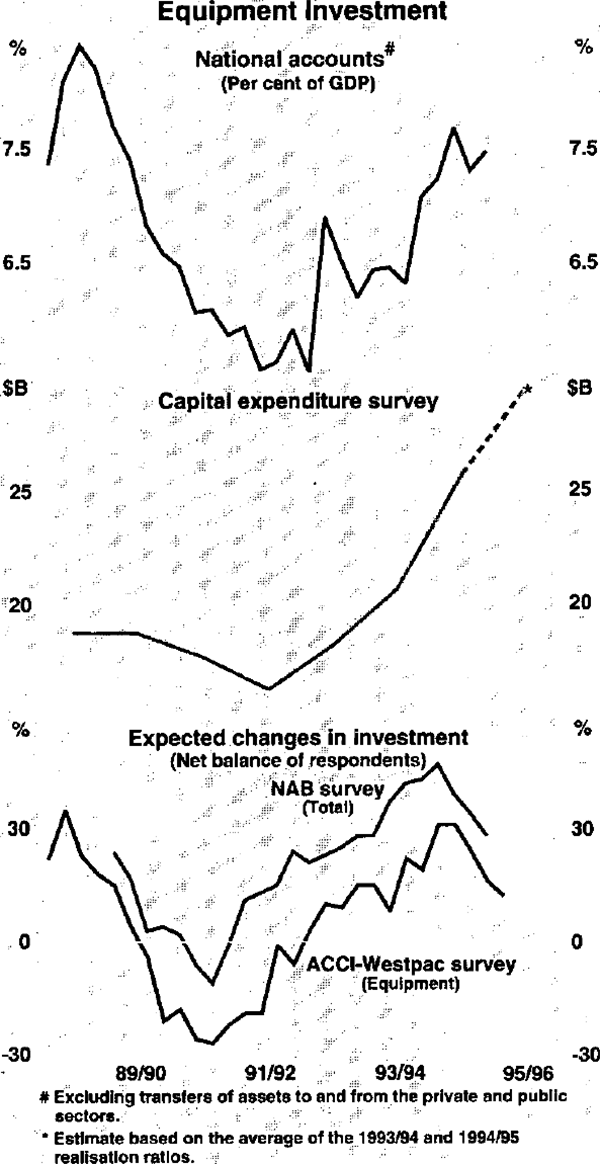
In underlying terms, investment in business equipment rose by 3.6 per cent in the June quarter and at an average annual rate of around 17 per cent over the past three years. As a result, the share of investment in equipment relative to GDP has risen from 5.5 per cent to 7.5 per cent. The Statistician's latest capital expenditure survey suggests that the rising share of investment in equipment relative to GDP will continue; the third reading for investment plans for the current financial year is 12 per cent higher than the corresponding estimate a year ago. While business surveys suggest that expectations for investment have been scaled down during the last year, they remain at relatively high levels (see Graph 7).
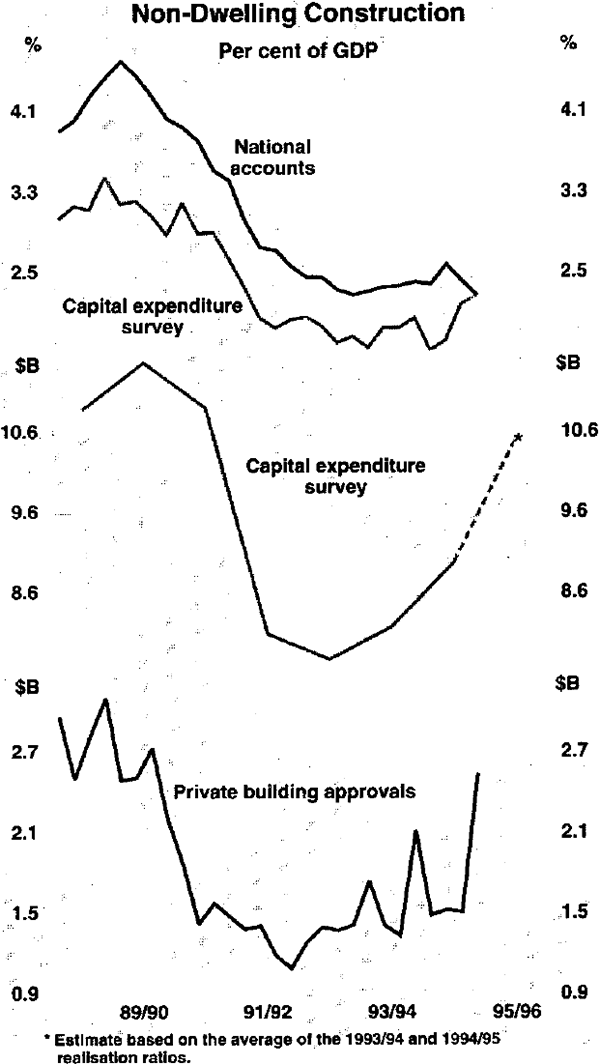
The national accounts report a fall (in underlying terms) in non-dwelling construction of 5.6 per cent in the June quarter, after a fall of 5.3 per cent in the March quarter. The latest fall is somewhat at odds with other indicators of activity in the non-residential construction sector (see Graph 8). The value of approvals for private non-residential construction in the June quarter was 57 per cent higher than its average level in 1994. (Excluding the approval in April of the Sydney Casino, amounting to $550 million, the rise is 23 per cent.) Plans for non-dwelling construction – as recorded in the Statistician's latest capital expenditure survey – also suggest that the prospects for non-dwelling construction remain good; the third reading for investment plans for 1995/96 is 8 per cent higher than the corresponding estimate made a year earlier. On the basis of approvals data and the expenditure survey, the national accounts measure of non-residential construction activity seems likely to show an early recovery.
Internal funds remain the primary source of financing for the on-going high levels of investment. The gross operating surplus of private companies rose by 1.7 per cent in the June quarter and the profit share remained above the average level of the 1980s. High levels of internal funding have been augmented by substantial equity raisings, while business credit has continued to increase modestly.
The build-up of stocks evident in the March quarter accelerated in the June quarter, when non-farm stocks contributed half of a percentage point to growth in GDP (see Graph 9). The accumulation in stocks was concentrated in the wholesale industry, and possibly reflected an over-estimate by firms of the extent to which demand would be brought forward to avoid the latest sales tax increases.
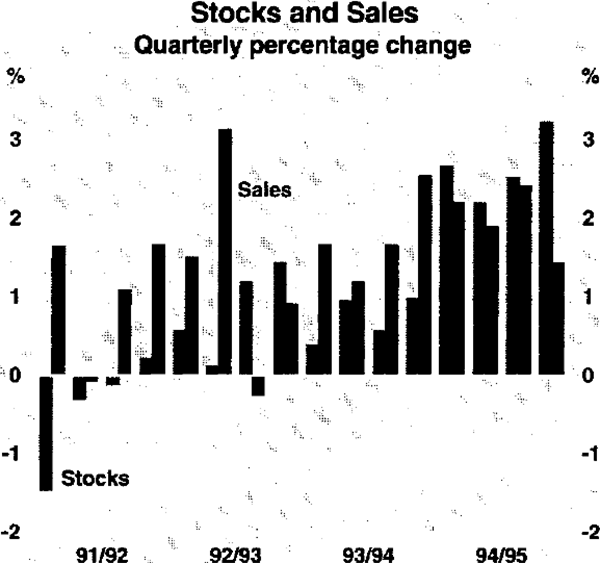
Most business surveys suggest that the recent increase in stocks has been partly unintended, raising prospects of a substantial slowing in the rate of stock accumulation. This could see continuing weakness in manufacturing output, although slower stock accumulation is also likely to be reflected in lower import volumes. A further inventory-induced contraction of the manufacturing sector might trim economic growth in the short run, but improvements in inventory management techniques over recent years and the diminution in the relative significance of stock holding have reduced the chance of a major slowing from this source.
The labour market
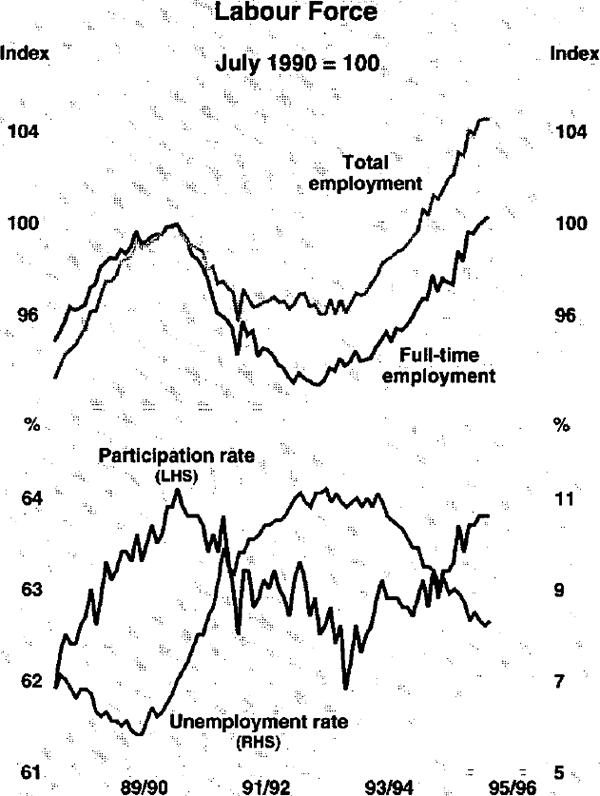
Labour market conditions have now begun to adjust to the slowing in economic growth. In the three months to August, employment rose at an annual rate of 2.8 per cent, compared with 4.6 per cent in the previous six months. Full-time employment continues to underpin recent employment strength (up by 0.7 per cent in the three months to August), and is now above its pre-recession peak (see Graph 10). Part-time employment has shown little growth since January.
Over the last year, employment growth has been concentrated in the services industries, while it has been weakest in the manufacturing, mining and utilities industries. The levels of hiring intentions reported in the NAB and ACCI-Westpac surveys suggest that growth in manufacturing employment is likely to remain weak in coming months. The growth in employment in the construction industry over the last year, by contrast, suggests that the pick-up in non-residential construction activity is offsetting the employment effects of the slowdown in housing activity.
The ABS measure of job vacancies fell by 1.9 per cent in the three months to August, but remains around the level recorded between 1984/85 and 1987/88, which was a period of moderately strong growth in employment. The average number of hours of overtime per employee has fallen sharply in recent quarters, falling by 6 per cent between May and August and by 14.6 per cent over the year to August. The fall in overtime has been concentrated in construction and manufacturing.
The unemployment rate has been relatively stable in recent months, at around 8¼ per cent of the labour force. This is about 1¼ percentage points lower than a year ago. Relatively rapid progress has been made in reducing long-term unemployment, with the long-term unemployment rate falling by 0.9 of a percentage point during the past year, to 2.6 per cent of the labour force. The unemployment rate is forecast to fall more slowly over the year ahead as employment growth slows and the participation rate rises further.
The rural sector
The drought is breaking, with widespread rains over the past nine months bringing much needed relief to many farmers. Nevertheless, at the end of September, around two-thirds of NSW remained drought declared (down from virtually all of the state at the end of 1994). In Queensland, the drought-declared area has fallen from around one-half to one-third of the state. Heavy rains in late September have helped to alleviate the situation in NSW, although to what extent is still unclear.
Current forecasts by ABARE envisage a sharp rebound in agricultural production in 1995/96, given ‘normal seasonal conditions’, although this implies a somewhat weaker recovery than typically follows a major drought. In 1983/84, for example, favourable rains resulted in very high crop yields and farm GDP rose by nearly 50 per cent. On this occasion, ABARE expects a rise of 16 per cent, which would contribute about half of a percentage point to GDP. Winter grain production for 1995/96 is forecast to be 84 per cent higher than in 1994/95. On the other hand, wool production will continue to be restrained by the ongoing rationalisation within the wool industry, and herd rebuilding is likely to see a further fall in livestock slaughtering. Stronger prices should provide additional benefits to wheat farmers, though some other rural producers may have to contend with less robust prices for their output.
Public finance
Estimates based on the Commonwealth Budget and the round of State Budgets suggest that the public sector will still be in underlying deficit in 1995/96, but by a smaller amount than in 1994/95. Several States are undertaking significant capital expenditures and these will partly offset the effects of the Commonwealth's fiscal consolidation.
The public sector borrowing requirement (PSBR) is estimated at 2½ per cent of GDP in 1994/95, the same as in 1993/94. A surplus equivalent to about half a per cent of GDP is forecast in 1995/96 but, excluding the effect of asset sales, the ‘underlying’ PSBR is put at a little over 2 per cent of GDP this year, down from around 3 per cent in 1994/95, and 3¾ per cent in 1993/94.
Balance of payments
The current account deficit reached nearly 6 per cent of GDP in 1994/95. The deficit, both in dollar terms and as a share of GDP, is expected to fall over the coming year. Slower import growth – reflecting a moderation in growth of domestic demand – and a stronger export performance – reflecting the recovery in the rural sector and continuing growth in Australia's export markets – are both playing a part in reducing the deficit. For the first two months of the September quarter, the deficit averaged $1.8 billion, compared with an average of $2.7 billion per month in the June quarter. Monthly figures are volatile and the first two month's figures probably overstate the improvement, but it appears that the cyclical peak in the deficit has now passed.
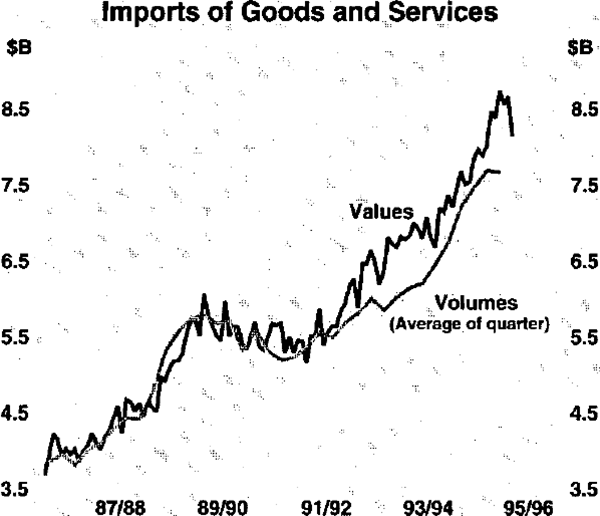
The volume of imports fell marginally (by 0.3 per cent) in the June quarter, after five quarters of strong growth. The volume of services, consumption and intermediate imports declined in the quarter but, reflecting the underlying strength of investment in plant and equipment, capital import volumes continued to grow. Despite the fall in import volumes overall, their value continued to increase strongly, reflecting the effects on import prices of the earlier large depreciation of the exchange rate.
More recent data point to a decline in the value of imports (see Graph 11). Over the three months to August, the value of imports fell by 7.0 per cent. Part of this decline is a result of the recent appreciation of the exchange rate which has reduced import prices, but it is also likely that a slowdown in domestic demand and an inventory adjustment have led to a decline in the volume of imports. The recent decline in import values has been widespread, with each of the major categories recording falls.
While the prospects for export growth are reasonably good, merchandise export volumes fell in the June quarter, partly reflecting a mainly drought-induced fall in the volume of rural exports. Overall, rural exports in the quarter were about 17 per cent lower than a year earlier. The volume of resource exports also fell in the June quarter, but manufacturing exports were broadly unchanged at a level more than 10 per cent higher than a year earlier. Despite lower export volumes, the value of exports picked up as a result of the price effects of the depreciation of the currency. This valuation effect is likely to have been partly reversed by the recent appreciation of A$.
The services deficit narrowed in the June quarter and moved into a small surplus in July and August. Underpinning the improvement in the June quarter was a fall of more than 6 per cent in the volume of imported services and a 4.3 per cent rise in the volume of service exports; the latter reflected strong receipts from travel and other transportation services.
The net income deficit widened further in the June quarter, increasing by $900 million to $5.3 billion. Higher income payments over the past year were largely attributable to higher equity-related income payments, reflecting the strong growth in corporate profitability (see Graph 12). With equity now comprising over 30 per cent of total net foreign liabilities, equity-related income payments represent a significant part of the net income deficit. Higher world interest rates (and a larger stock of net foreign liabilities) also have contributed to the widening of the deficit.
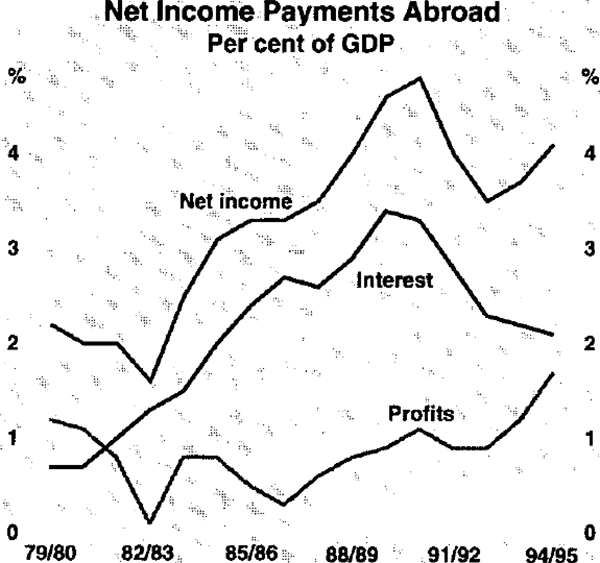
Australia's stock of net foreign liabilities increased to nearly $260 billion (57 per cent of GDP) in the June quarter, an increase of over $12 billion from the March quarter. The increase comprised capital transactions of $7.5 billion, roughly the same size as the current account deficit in the quarter, and valuation effects of about $4.7 billion reflecting higher equity prices and the weaker A$. The stock of net foreign debt rose to $180 billion (40 per cent of GDP), as a result of an increase in both public and private-sector borrowing and large valuation effects resulting from the depreciation of the currency over the quarter.
Inflation Trends and Prospects
Recent developments in inflation
In underlying terms, consumer prices rose by 1.0 per cent in the June quarter, taking the 12-month-ended underlying inflation rate to 2.5 per cent. Over the previous three years, underlying inflation recorded year-ended rates of around 2 per cent (see Graph 13). The June quarter outcome was affected by the increase in the wholesale sales tax rate on some cars introduced in the May Budget. Adjusted for this factor, the underlying rate is estimated around 0.8 per cent in the quarter and 2.3 per cent over the year to June.
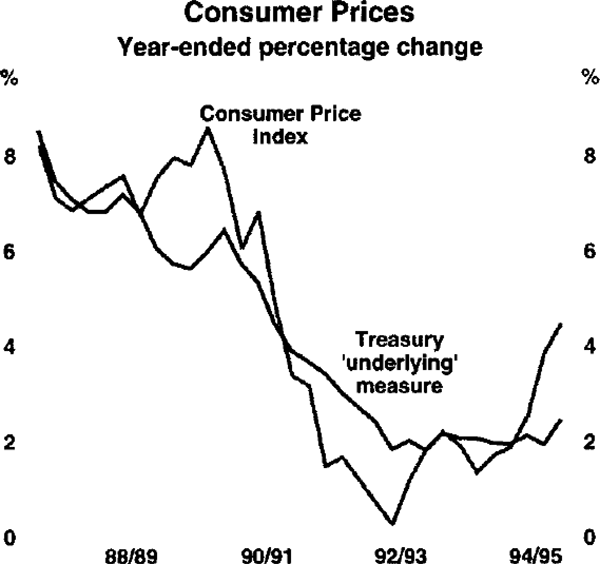
The headline consumer price index rose by 1.3 per cent in the June quarter and by 4.5 per cent over the year to June. This was a lower quarterly outcome than in the March quarter but, as in March, the largest contribution to the increase came from higher interest costs, mainly increases in mortgage rates flowing from last year's rises in official interest rates. The increase in June also reflected a large rise in prices of cigarettes and tobacco, as a result of increases in both Commonwealth and State tobacco taxes.
Broader national accounts-based measures of inflation also picked up in the June quarter (see Table 1). The main implicit price deflators increased by around 2 to 2½ per cent over the year to the June quarter, about ½ of a percentage point higher than increases recorded over the year to the March quarter. There has been some compositional shift towards cheaper goods and goods whose prices have risen more slowly over the last year, with the fixed-weight deflators generally showing larger increases – at around 3 per cent – than the implicit deflators.
| June 1993 | June 1994 | Latest | ||
|---|---|---|---|---|
| Consumer prices | ||||
| Consumer Price Index | 1.9 | 1.7 | 4.5 | June 1995 |
| Treasury underlying measure | 1.8 | 2.0 | 2.5 | June 1995 |
| National accounts deflators | ||||
| GDP deflator | 1.4 | 1.1 | 2.3 | June 1995 |
| Private final demand deflator | 2.3 | 1.3 | 2.1 | June 1995 |
| Private consumption deflator | 2.0 | 1.5 | 2.4 | June 1995 |
| Manufacturing prices | ||||
| Raw material inputs | 0.7 | 3.3 | 7.3 | July 1995 |
| Domestically-produced goods | ||||
| Intermediate | 1.3 | 1.6 | 6.6 | July 1995 |
| Final | 2.6 | 1.2 | 2.6 | July 1995 |
| Imported goods | ||||
| Intermediate | 8.5 | −3.0 | 14.4 | July 1995 |
| Final | 12.8 | −3.2 | 4.0 | July 1995 |
| Construction prices | ||||
| House-building materials | 4.2 | 3.7 | 2.3 | July 1995 |
| Other building materials | 1.3 | 1.9 | 3.0 | July 1995 |
| Import prices | ||||
| Import price index | 11.3 | −3.6 | 6.4 | July 1995 |
| Imported items in the CPI | 3.0 | 2.4 | 1.8 | June 1995 |
Recent developments in wholesale prices
Price inflation for both inputs and outputs of the manufacturing industry continues to run at higher rates than the broader inflation measures. During the last six months, price increases have been largest for raw materials and imported intermediate goods, largely reflecting the weaker exchange rate, the effects of drought, and developments in world commodity prices (see Graph 14). Recent monthly figures provide some tentative evidence that wholesale price pressures may be levelling off, helped by the recent appreciation of the exchange rate.

The prices of raw materials used in manufacturing increased by 2.3 per cent over the three months to July, taking the increase over the year to 7.3 per cent. Price increases have been largest for agricultural goods, and metal ores and concentrates.
Movements in prices of intermediate manufactured goods tend to be driven by conditions on world markets, particularly the metals market. In the three months to July, the price of intermediate goods manufactured domestically increased by 1.5 per cent, to be 6.6 per cent above the level of a year earlier. Prices of imported intermediate goods increased more quickly, largely reflecting the depreciation of the Australian dollar in the second half of 1994/95. Over the three months to July, prices of imported intermediate goods rose by 6.8 per cent, to be 14.4 per cent higher than a year earlier. Prices of imported final goods rose by 3.7 per cent in the three months to July, and by 4 per cent over the year to July. The recent appreciation of the exchange rate should reduce these imported goods prices in coming months.
The prices of final manufactured products produced domestically are considerably less volatile than prices at earlier stages of the production chain. This reflects variation in margins and the fact that the variability in the cost of other inputs (for example, labour costs) is generally less than the variability in the cost of physical inputs. In the three months to July, final manufactured goods prices increased by 0.6 per cent, taking the year-ended increase to 2.6 per cent, up from year-ended increases of around 1 per cent six months ago.
In the construction sector, price pressures have eased. In September 1994, at the peak in the housing cycle, prices of materials used in house building were rising at annual rates around 4½ per cent. In the latest three-month period, they rose at an annual rate of around 3 per cent. There has been a similar, although less marked, slowing in price increases for materials used in non-residential building.
Wages and unit labour costs
Recent information corroborates earlier evidence that pressures in the labour market have increased over the last year. Wages, as measured by average weekly ordinary time earnings (OTE) of adults working full time, rose by 4.8 per cent over the year to May, up from 4.4 per cent over the year to February. This pick-up continues to be driven by private-sector wage outcomes. Year-ended growth in private-sector OTE is running at 5.8 per cent – its highest level since 1990/91 – compared with 3.8 per cent for public-sector OTE (see Graph 15). Over the year to May, OTE grew strongly in manufacturing and transport and storage – industries in which wage campaigns have been under way – and in wholesale trade and communications services – industries in which output growth has been relatively strong.
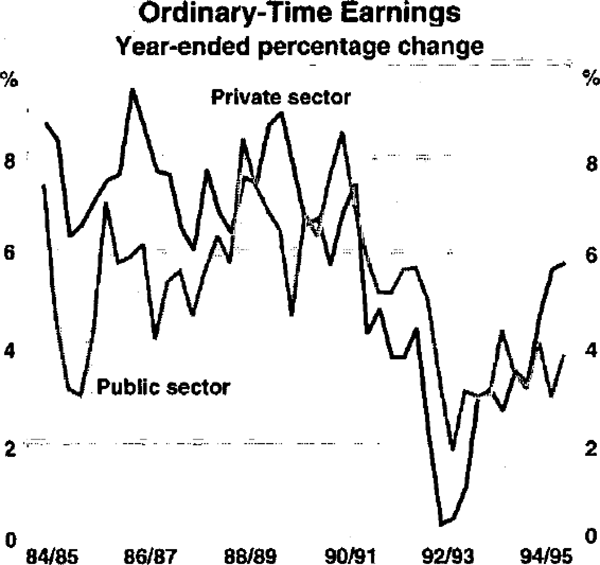
Average weekly earnings of all employees (AWE) continue to rise more slowly than OTE; over the year to May, AWE grew by 3.1 per cent. In part, slower growth in AWE relative to OTE reflects compositional shifts within the labour force, with over two-thirds of the difference explained by a shift towards the employment of part-time, casual and junior employees over the last year.
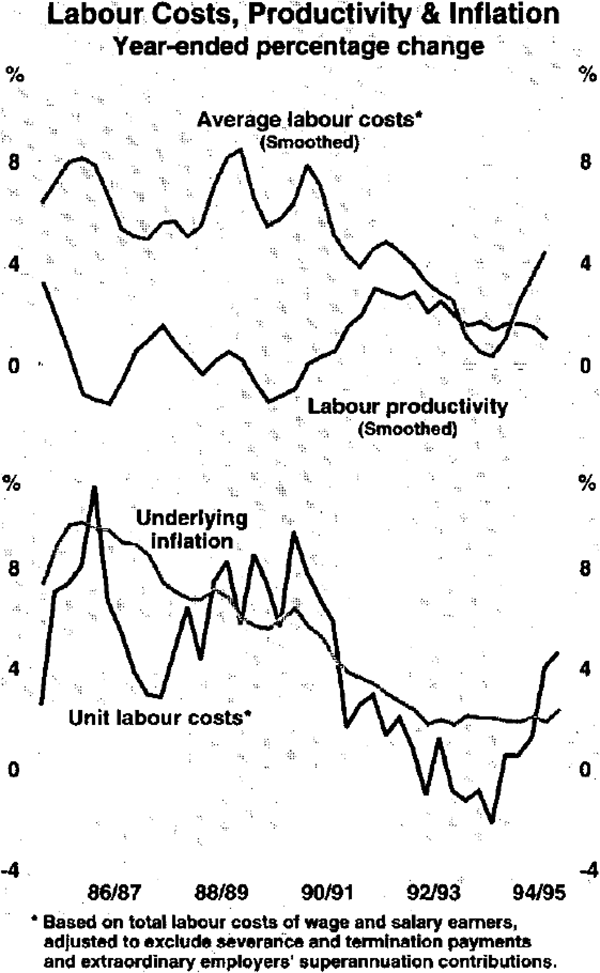
The divergence between the survey-based measures of wages growth and measures based on the national accounts continues, mainly reflecting one-off factors in the national accounts measure, such as redundancy payments and extraordinary superannuation payments. These pushed up the level of earnings in 1993/94, thereby causing an understatement of the rate of increase in 1994/95. While published national accounts data indicate growth in average earnings of 1.9 per cent over the year to June, adjusting for the one-off factors suggests that earnings per employee increased at an annual rate of close to 4 per cent in underlying terms. As with the survey-based measure of earnings, this represents a significant rise from corresponding rates of growth a year ago.
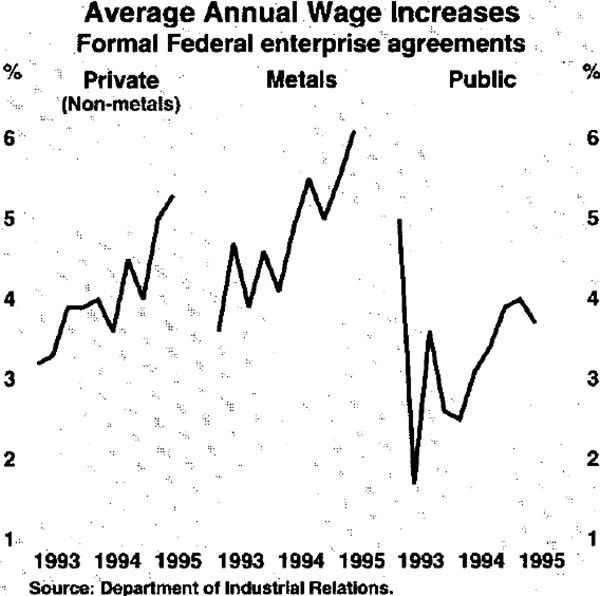
In addition to the somewhat divergent measures, other uncertainties are complicating the task of monitoring current wage developments. The spread of new enterprise agreements through the workforce is difficult to judge, partly because a significant number of agreements is unregistered or informal. The proportion of the labour force covered by safety net arrangements is also unclear. Be that as it may, anecdotal evidence from recent enterprise bargains suggests a step-up in wage increases in the first half of 1995. Information on formal Federal enterprise agreements collected by the Department of Industrial Relations suggests that recent enterprise bargains in the private non-metals sector are providing wage increases of around 5 per cent a year, compared with a range of between 4 and 4½per cent in late 1994 (see Graph 16). This step-up is broadly consistent with data collected by the Australian Centre for Industrial Relations Research and Teaching. Data from the ACTU's labour information network suggest the pick-up has been more marked, but this series is based on a considerably smaller number of agreements. Executive salaries continue to grow at a faster rate than wages in general; the latest Cullen Egan Dell measure of executive remuneration shows that base salaries of senior managers rose by 5.9 per cent over the year to June.
There has been little growth in aggregate labour productivity over the last year. In part, this slowdown, compared with the relatively rapid growth during the previous three years, reflects the catch-up in employment in the first half of 1995 to the rapid growth in output that occurred in 1994.
The combination of faster wages growth and slower productivity growth has meant that unit labour costs increased quite quickly in the first half of 1995 (see Graph 17). Over the year to the June quarter, underlying unit labour costs rose by over 4 per cent; this is up from around 1 per cent over the year to December 1994.
Capacity utilisation, margins and inflation expectations
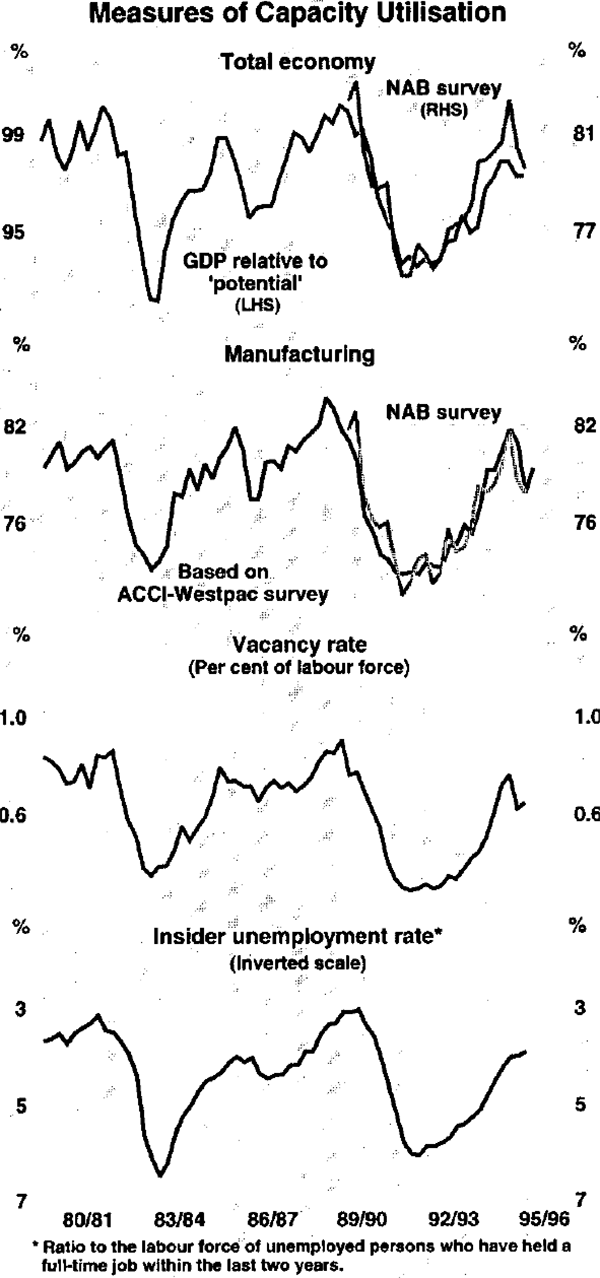
Most measures of capacity utilisation already have been wound back a little from their peak levels of late 1994, and they remain well below levels recorded at the peak in the late 1980s (see Graph 18). Given that investment is expected to continue to grow relatively strongly, with more moderate growth in economic activity, capacity constraints are not expected to intensify over the next year and may ease somewhat further.
In recent quarters, the combination of rising costs and a slowdown in demand growth has led producers in the manufacturing and retail sectors to reduce their margins. In coming quarters, cost pressures from the labour market are likely to remain but they might partly be offset by lower price increases for other inputs, particularly imported inputs.
Respondents to the latest ACCI-Westpac survey reported that cost pressures in manufacturing intensified in the September quarter, but are expected to ease in the December quarter (see Graph 19). To some extent this reflects the strengthening exchange rate and the levelling out of commodity prices in the first half of 1995. The expectation of cost pressures easing, combined with a more optimistic outlook for the economy overall, has led manufacturing firms to scale up their profit outlook.
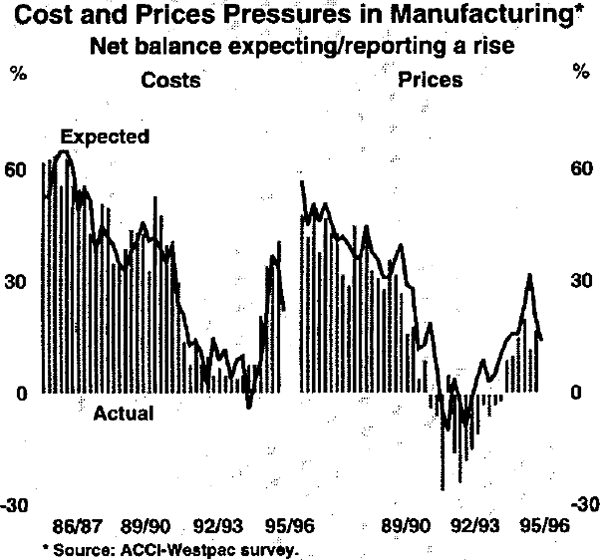
The net proportion of firms reporting price increases also rose between the June and September quarters but, again, expectations are that a much smaller proportion of firms will raise their prices in the December quarter. The majority of firms (55 per cent) are still reporting no change in their selling prices.
Longer-term forecasts for ‘headline’ CPI inflation reported by Consensus Economics in September have increased marginally from a couple of months ago for both 1995 and 1996, to 4.5 per cent and 4.2 per cent respectively. Private-sector forecasters in the financial markets also have raised their forecasts for underlying inflation. Most are now expecting underlying inflation to be between 3 and 4 per cent over the year to June 1996. By contrast, consumers' inflation expectations, as measured by the Melbourne Institute Survey, have been steady. In September, the median expectation for inflation over the next year dropped to 4.3 per cent, placing it well within the 4–5 per cent range in which this series has fluctuated over recent years. Longer-term forecasts of other non-financial market participants have also remained stable; in the recent National Australia Bank survey, over 70 per cent of firms indicated in the June quarter that they expect inflation to remain below 4 per cent over the remainder of the 1990s.
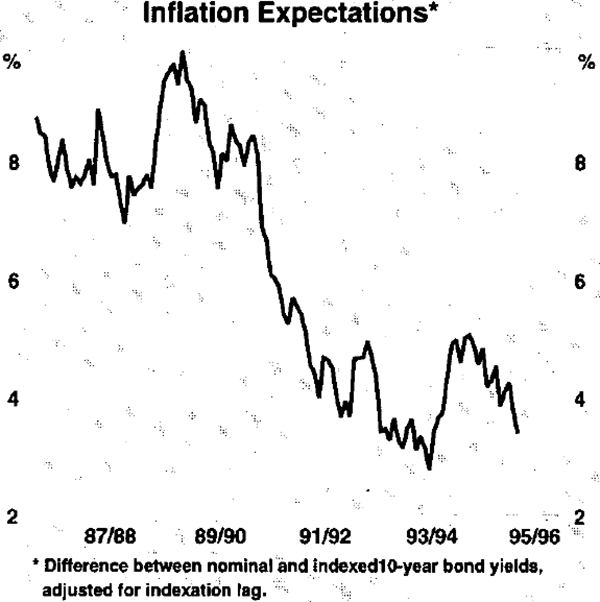
On the whole, the strong economic upswing over recent years has not led to a deterioration in the measured inflation expectations of business or consumers. The main instance of serious deterioration in inflationary expectations was that observed in financial markets in 1994, when bond yields rose sharply and the yield curve moved up. In that period, financial markets in Australia (and elsewhere) were not confident that policies would be adopted that would contain inflation. Policy adjustments and continuing good results on inflation have seen that trend substantially reversed. The slope of the yield curve in Australia has moved progressively flatter in 1995, suggesting that the earlier deterioration of inflationary expectations in financial markets was overdone (see Graph 20).

Another measure of financial markets' expectations about inflation is the gap between the nominal yields on standard Commonwealth Government Securities and the real yield on indexed securities issued by the Commonwealth. This measure of price expectations rose sharply in the first half of 1994, and remained at about 5 per cent during the second half of 1994. Since then, it has fallen noticeably, and inflation is currently expected to average about 3½ per cent over the next ten years (see Graph 21). A continuation of low-inflation expectations should prove helpful in ensuring that the cyclical pick-up in inflation does not become entrenched into a permanently higher rate of inflation.
Over the coming year, the indirect tax increases announced in the Budget will affect the inflation rate, but will then drop out of the figures. Another important factor shaping inflation outcomes is the exchange rate. While exchange rate fluctuations are often partly absorbed in the margins of importers and retailers, a sustained appreciation and strong competition between firms should moderate price pressures at the consumer level. While this will be helpful in containing inflation expectations and actual inflation, wage outcomes are also extremely important. With the unemployment rate falling and underlying inflation increasing, wage pressures may intensify. On the other hand, slower growth and a commitment by the Accord partners to achieve wage outcomes consistent with 2–3 per cent inflation, may see an easing in wage pressures. A close watch is being kept on how these various forces work out.
Financial Markets Developments
International bond and equity markets
Sentiment in world financial markets has been generally positive over the past few months. Long-term interest rates in the three largest economies have been noticeably lower, on average, in the September quarter than they were early in 1995 or in the second half of 1994 (see Graph 22). The big rise in bond yields during the first half of 1994 has now been reversed in some countries, and greatly reduced in others. The markets' earlier concerns over the pace of growth and prospective inflationary pressures have, for the time being at least, given way to a recognition that economic growth is on a more sustainable path, and that inflationary pressures, if anything, might be easing, rather than intensifying. Recent data in the major countries have supported this assessment.
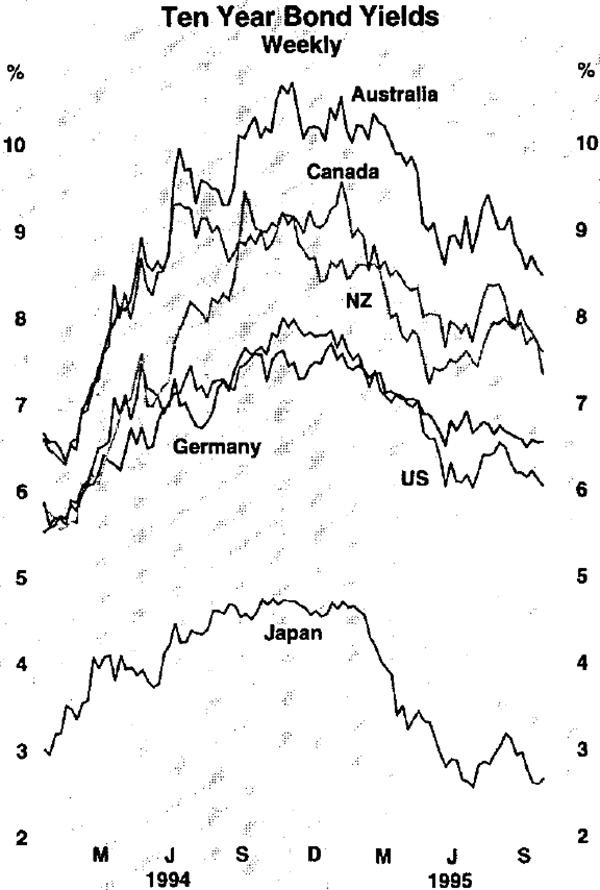
These same trends have prompted an easing in monetary policy by major central banks. The Federal Reserve lowered the federal funds rate by a quarter of a percentage point in July. German short-term rates also have been lowered (and those in a number of European countries with them), as revised price data show inflation below 2 per cent, and wholesale price inflation looks to be slowing, helped by a strong mark. Japanese monetary policy too was eased again, with overnight interest rates falling to an historically low 0.4 per cent.
These developments have contributed to higher equity prices in most countries over recent months. The Japanese share market was buoyed by the fall in the yen and lower official interest rates. From its lows in early July, the Nikkei Index had, by late September, risen by 25 per cent. The German share market also responded to lower official interest rates, rising by 5 per cent. In the US, the Dow Jones Index was up 5 per cent over the quarter, to new records; it ended the quarter about 25 per cent above its level at the start of 1995.
Foreign exchange markets
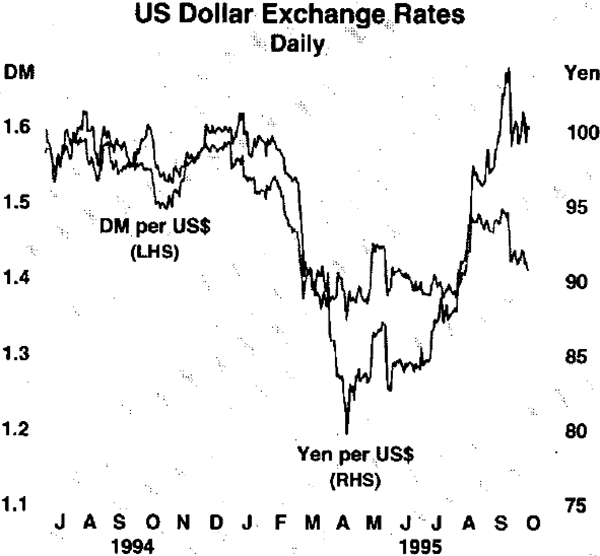
In foreign exchange markets, the main focus has been on the exchange rate between the Japanese yen and the US dollar. The yen reached an all-time high, both against the US dollar and in trade-weighted terms, in April 1995 (see Graph 23).This added to the already considerable deflationary pressures on the Japanese economy. It was clearly unhelpful from the point of view of supporting economic recovery in Japan, and was out of line with any notion of fundamental values. Since early July, the yen has weakened quite noticeably, falling by around 15 per cent against the US dollar, and is now back to its levels at the beginning of 1995.
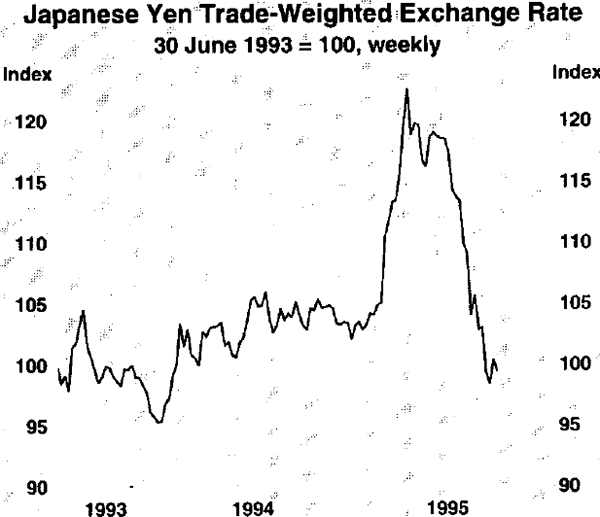
Several factors were behind the retracement in the yen. The Japanese authorities have taken initiatives to boost growth, with changes in monetary policy and some relaxation of the regulations on overseas investments by Japanese financial institutions, the aim of which was to encourage capital outflow. This, together with the general perception that the yen had overshot, provided a fertile environment for intervention by major central banks to reinforce the tendency for the US dollar to rise. The Bank of Japan was very active through the quarter, and coordinated intervention involving the US and German central banks, backed up by clear statements of the authorities' intentions, was undertaken in mid August. The large Japanese fiscal package announced in mid September was widely anticipated, and helped to weaken the yen before its actual announcement, although some of this fall was subsequently reversed.
There has also been some recovery of the US dollar against the German mark: the net rise over the September quarter was 3 per cent, to 1.427 (see Graph 24). At the same time, exchange rates among European currencies continued to be unsettled. After depreciating against the mark over the first half of 1995, European currencies generally appreciated for much of the quarter. Factors weighing on these currencies earlier in the year, including political uncertainty, rising inflation and fiscal imbalances, receded somewhat. But, sentiment turned against these currencies late in the quarter when a number of official comments from Germany served to focus attention on the practical problems with the European Monetary Union, causing the mark to strengthen again. The Swiss franc was also a beneficiary of this uncertainty, appreciating by 3 per cent against the mark since the end of June.
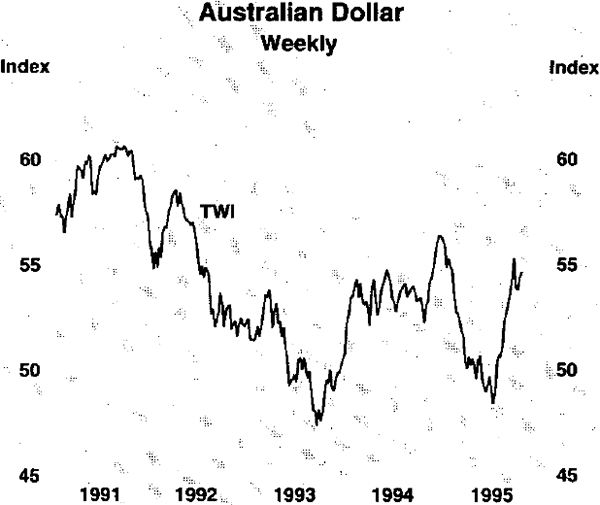
As is often the case, the firming trend in the US dollar saw a lift in the Australian dollar, against the US currency itself, and even more so against other currencies. With the US economy showing more strength after its mid-year pause, the prices of a number of commodities have risen over recent months. In addition, the favourable interest rate differentials between Australian and Japanese securities, coupled with the deregulatory measures in Japan, resulted in heavy purchases of Australian securities by Japanese investors, assisting both the Australian dollar and domestic bond yields. Most importantly, and in contrast to the previous quarter, data on Australia's balance of payments showed a marked reduction in the current account deficit. From a low of US71 cents and 48.4 on the trade-weighted index (TWI) in late June, the Australian dollar rose to around US76 cents and 55.4 in mid September (see Graph 25) .The TWI declined a little with the US dollar in late September, as that currency settled back after the Japanese fiscal package was announced on 20 September, but still ended the quarter at 53.8, some 11 per cent higher than its level a quarter earlier. The rise in the Australian dollar during the quarter reversed much of the weakness in the first half of the year. The exchange rate nonetheless remains below its longer-run average (since the mid 1980s, the TWI has averaged about 57).
The Bank did not undertake any exchange rate intervention during the September quarter and, in fact, has not intervened on either side of the market for almost two years. It did, however, make some purchases of foreign exchange from the market to fund the foreign exchange needs of the Commonwealth government. In the past couple of years, most of the government's foreign exchange needs had been met from the proceeds of its own foreign currency swap program. In 1995/96, however, the foreign currency proceeds from this program are projected to be small. The Bank, as the government's banker, has therefore resumed the usual practice of acquiring foreign currency from the market as necessary to meet the government's needs. Over the past three months, the Bank has purchased the equivalent ofA$454 million of foreign exchange in the market, to replenish currencies sold to the government.
Domestic financial markets and intermediation
The local share market strengthened fairly consistently over most of the September quarter. Strong performances in overseas markets, particularly the US, and falling bond yields through August and September pushed the All Ordinaries Index to 2,169 by mid September, its highest level for 18 months. With the outlook for commodity prices brighter, demand for resource stocks in particular has been solid, which also helped the market. Later in September, the market came back from its highs but remained 6 per cent above its end-June level.
Australian bond yields have shown a substantial net fall over the September quarter. Reflecting developments in the US market, they initially rose by 20 points in July, to 9.4 per cent. Since then, however, strong demand by Japanese investors and factors specific to Australian economic developments – including favourable balance of payments statistics – have pushed them lower. At end September, 10-year yields stood at 8.6 per cent. Australian bond yields have generally fallen by more than those in other countries in recent months, narrowing the differential between yields. At the start of the quarter, for example, 10-year bond yields in Australia were 300 points above US yields but, by the end, that differential had narrowed to 235 points. Even so, Australian bond yields remain higher than those in many comparable industrial countries.
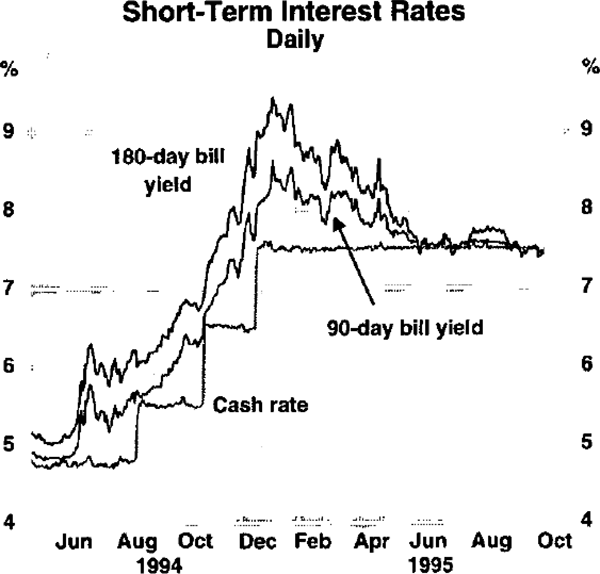
Short-term security yields declined marginally over the quarter (see Graph 26). Yields on 90-day bank bills, for example, fell from 7.6 per cent to 7.5 per cent. In part, this reflected trends in US yields, but more generally it reflected an easing in markets' concerns about domestic developments, particularly following the improvement in the current account. This level of yields is in line with the current cash rates, and suggests that markets are anticipating steadiness in these rates in the period immediately ahead.
Banks' interest rates have remained relatively steady in recent months. On the lending side, banks' predominant interest rates for small business loans and variable-rate housing loans were unchanged at 11.1 per cent and 10.5 per cent, respectively. Interest rates on fixed-rate loans were little changed over the quarter, rising a little but then falling back as they followed movements in market yields. On the deposits side, most rates were unchanged though some fixed-term deposit rates fell a little.
In response to increased competition in the housing loan market, particularly by mortgage originators, there has been an increase in the variety of housing loan products being offered. Most banks now offer ‘honeymoon’ loans – variable-rate loans discounted for the first year. At the end of September, honeymoon offers generally had a discount of between 2 and 3 percentage points, with the predominant discount interest rate being around 8 per cent, down from 8.25 per cent at end June.
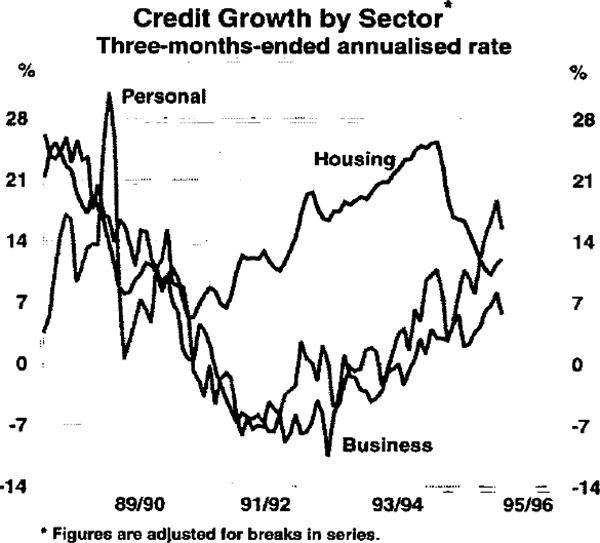
Credit extended to the private sector by domestic deposit-taking intermediaries increased at an annual rate of 9.3 per cent in the six months to August (see Table 2). This is a little faster than in the previous six months. Personal credit continues to be the fastest growing component of total credit. Growth in housing credit, at 12.1 per cent over the three months to August also remains quite strong. While business credit is now growing at a faster rate than earlier in the year, it remains the slowest growing component of total credit (see Graph 27). On the other side of these intermediaries' balance sheets, broad money – which includes currency as well as deposits – grew at an annual rate of 6.3 per cent over the three months to August.
| 6 months to: | 3 months to: | |||
|---|---|---|---|---|
| Feb 1995 | August 1995 | May 1995 | August 1995 | |
| Credit | 8.6 | 9.3 | 9.0 | 9.5 |
| – housing | 16.0 | 11.5 | 10.9 | 12.1 |
| – personal | 7.4 | 15.1 | 14.9 | 15.2 |
| – business | 3.6 | 6.3 | 6.3 | 6.3 |
| Broad money | 7.5 | 6.7 | 7.1 | 6.3 |
| – Currency | 5.1 | 5.1 | 6.1 | 4.1 |
| – Ml | −1.9 | 4.9 | 1.4 | 8.5 |
| – M3 | 6.5 | 6.6 | 7.9 | 5.4 |
| * Figures are adjusted for breaks in series. | ||||
