Bulletin – April 1996 Quarterly Report on the Economy and Financial Markets
- Download 219KB
Introduction
The economy grew at a moderate pace in the December quarter, continuing the uninterrupted run of growth since mid 1991. Strong consumer spending has been a feature of recent growth, partly offset by the contractionary effects of inventory adjustments and the housing cycle.
Any concerns that these short-term cyclical forces might adversely affect confidence and trigger a deeper or more sustained slowing now seem to be fading. Business and consumer sentiment have both improved, and investment surveys and credit data suggest that business investment will pick up in 1996. Consumer spending remained firm early in the March quarter and forward indicators of the labour market point to further strength. Prospects for the US and Japanese economies – the two main external influences on Australia – have also improved, helping to create a more favourable international environment for Australia. Given this conjuncture of domestic and international developments, some acceleration in the economy's growth rate can be expected during 1996/97.
In the meantime, the slower growth now being experienced should provide a helpful environment for price stability. Underlying inflation remains a little above the objective of 2–3 per cent over the course of the cycle. It is expected to peak around 3½ per cent in the year to the March quarter and – assuming the exchange rate remains around current levels – to fall below 3 per cent in the second half of 1996. Headline inflation is expected to fall earlier and further. In addition to favourable exchange rate effects (with the $A now around its 10-year average level in TWI terms), the pressure on many businesses to cut inventories is reducing firms' pricing power. These favourable factors are, however, essentially temporary and sustained low inflation will require slower wages growth across all sectors of the economy, be they private or public, union or non-unionised, wage or salary earners.
The burst of economic growth in 1994 helped to push labour cost increases to their present rate of around 5 per cent – a rate which is unlikely to be consistent with good control of inflation, and with sustained growth in activity and employment. So far, the recent slower economic growth has not produced any clear wage moderation, although there has been no apparent acceleration either. The prospect of a couple more quarters of relatively modest growth, together with the improved short-term outlook for inflation, should help to bring about that necessary moderation. In the post-Accord environment, with market forces exerting greater influence over wage outcomes, the brunt of the task of delivering effective wage restraint falls on employers to a greater extent than in the past. Their task is to strike enterprise bargains which provide for more modest wage increases than many of those which are currently being struck.
If that outcome cannot be achieved in current conditions of a slight lull in economic activity, it is unlikely to be achieved as the economy gathers some pace down the track. In that event, there would be no alternative but to rely upon increases in interest rates to head off potentially damaging outbreaks of inflation.
The International Economy
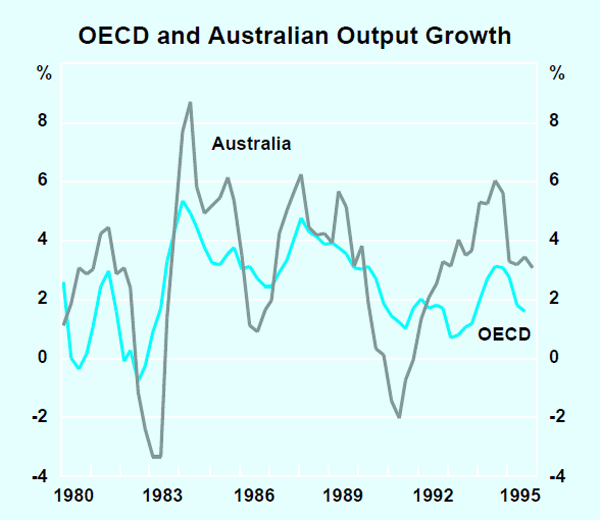
There has been a close linkage over the past 15 years between the Australian business cycle and OECD growth (Graph 1). With both the US and Japan moving into a new, more positive phase after the softness evident for much of 1995, the international climate for Australian growth looks favourable. European economies, however, generally remain weak (Table 1). Inflation remains well controlled in virtually all major economies, at rates of around 3 per cent or less.
| GDP Dec 1995(a) |
Core CPI latest(b) |
|
|---|---|---|
| US | 1.4 | 2.9 |
| Japan | 2.2 | 0.2 |
| Germany | 1.0 | 1.7 |
| Canada | 0.6 | 1.6 |
| France | 0.7 | 1.9 |
| UK | 2.0 | 2.9 |
| Italy | 2.4 | 5.6 |
| Netherlands | 1.6 | 2.3 |
| Sweden | 1.6 | 1.5 |
| Switzerland | −0.2 | 1.2 |
| Belgium | n.a. | 1.6 |
| Australia | 3.1 | 3.2 |
|
(a) GDP data for France, Italy and Sweden are preliminary. Sources: National Governments and OECD Statistics. |
||
North America
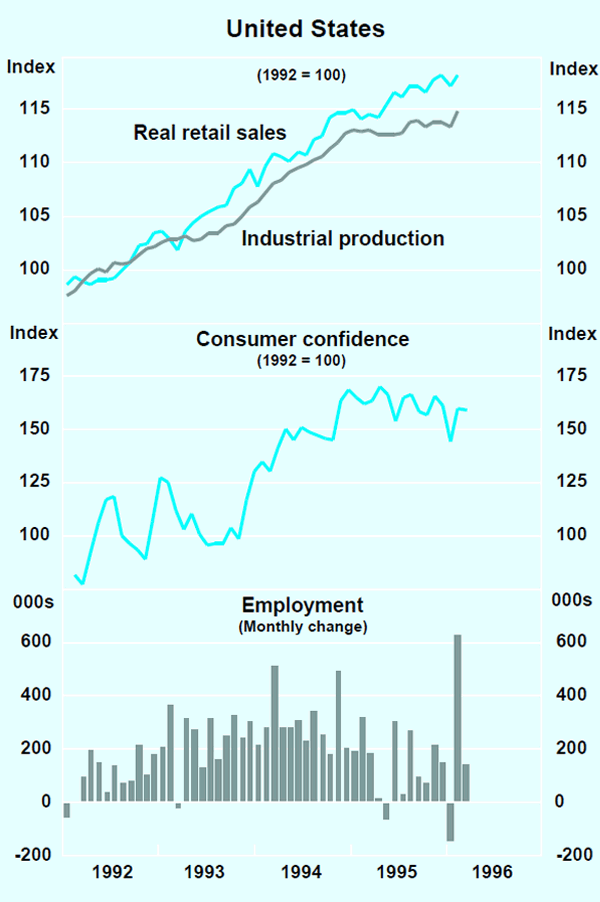
Growth in the United States slowed over the course of 1995. This was not a marked cyclical downturn, but more a reflection of an economy which had already reached full employment, where further expansion was limited largely to the more modest growth of the economy's capacity. Such ‘smooth landings’ are hard to achieve, and in the second half of 1995 there were concerns that the economy was slowing too much, which prompted some easing of monetary policy. In late 1995 and early 1996, interpretation of trends was complicated by blizzards and government shutdowns. With this uncertainty, many observers judged that the economy was still weakening, and anticipated further cuts in interest rates. The announcement of a rise in employment of 705,000 for February brought a sharp re-assessment, particularly in financial markets.
The evidence of a stronger economy is, however, more widespread (Graph 2). Employment in March rose a further 140,000, giving an average monthly rise of 206,000 over the past three months, compared with 142,000 over the previous three months. (February's rise has been revised down to 624,000, and January's fall revised from the original figure of 201,000 to 146,000.) The average levels of retail sales, housing starts and industrial production were higher in January and February than in the December quarter, and consistent with an economy running at close to its potential growth rate of around 2½ per cent. Measures of consumer confidence are comparable with the high levels of the December quarter. Given this outlook, participants in financial markets have come to the view that the phase of interest rate reductions is now over, and rises are more likely in future.
Price and wage pressures remain subdued, with core inflation around 3 per cent and upstream price pressures weak. Labour costs continue to rise at an annual rate of around 3 per cent. Recent collective bargaining settlements point to a continuation of low wage outcomes.
In Canada, the outlook has improved recently, with a pick-up in manufacturing, strong employment growth and rising housing demand. Underpinning the recovery has been stronger US growth and easier monetary conditions. The Bank of Canada has cut official interest rates by 3 per cent over the past year. Inflation remains low.
Asia-Pacific
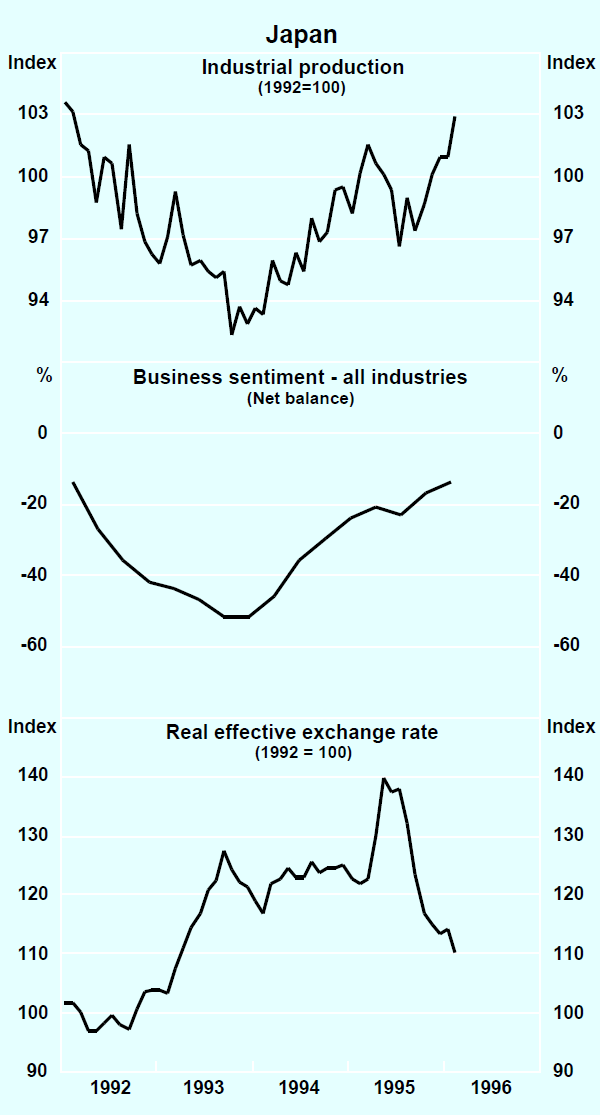
In Japan, real GDP grew by 0.9 per cent in the December quarter and by 2.2 per cent in the year to December. The strong December quarter result was supported by consumer spending, private construction and public spending. Industrial production grew strongly in the December quarter, and these levels were sustained early in the March quarter (Graph 3). After three years of weakness in business investment, the negative phase seems to be coming to an end, although the Bank of Japan's latest Tankan survey pointed to subdued business sentiment, with only a slight improvement expected in business conditions in the near term. The labour market also remains weak, with the unemployment rate of 3.3 per cent near to its historical high.
Elsewhere in Asia, economic activity remains strong, although the pace of expansion has eased in major North-East Asian economies (Table 2).
| Real GDP (Percentage change in year to Dec 1995(a)) |
Consumer prices (Percentage change in 12 months to latest(b)) |
Current account balance(c) (Per cent of GDP 1995) |
|
|---|---|---|---|
| China | 11.4 | 9.3 | 2.3 |
| Hong Kong | 4.2 | 6.6 | −1.4 |
| Indonesia | n.a. | 9.2 | −3.5 |
| Malaysia | 9.2 | 3.4 | −8.8 |
| New Zealand | 2.3 | 2.0 | −4.3 |
| Philippines | 4.5 | 11.8 | −3.3 |
| Singapore | 9.1 | 1.6 | 18.3 |
| South Korea | 6.8 | 4.5 | −2.0 |
| Taiwan | 4.9 | 3.0 | 1.6 |
| Thailand | 8.6 | 7.3 | −8.1 |
|
(a) The latest is the December quarter, except for Hong Kong (September
quarter). For Thailand, the statistic is for 1995. Sources: National Governments and the International Monetary Fund. |
|||
In China, real GDP grew by over 11 per cent in 1995, down slightly from the previous year. Inflation has fallen, with consumer prices rising by 9 per cent over the year to December, compared with nearly 25 per cent in the previous year.
In Taiwan, real GDP rose by slightly less than 5 per cent in the year to the December quarter, its weakest performance since 1990. The economy seems to have weakened further in recent months, reflecting the effect of political tensions between Taiwan and China. Signs of slower growth are also evident in Hong Kong, where GDP rose by 4.2 per cent over the year to September. In Korea, real GDP grew at an annual rate of around 10 per cent in the first three quarters of 1995, but has since slowed; increasing by 6.8 per cent in the year to the December quarter. In line with weaker economic growth, inflation has fallen in most major North-East Asian economies.
Growth remains robust in the ASEAN countries, although in Malaysia and Thailand it has slowed from the unsustainable growth rates of early 1995, partly in response to tighter monetary policy in both countries. Current account deficits in Malaysia and Thailand continue at high levels.
In New Zealand, a marked slowing in the pace of economic activity has occurred, with GDP growth of 2.3 per cent in the year to the December quarter, compared with over 6 per cent a year earlier. The Reserve Bank of New Zealand has forecast GDP to slow further in the March quarter. Underlying inflation over the year to the December quarter was 2 per cent, the top of the Bank's target range.
Europe
In contrast to the continuing robust performance of Asian-Pacific countries, economic activity in continental Europe remains weak, with further deterioration evident in labour markets and consumer confidence in recent months. Official interest rates have been lowered further in a number of countries.
In Germany, real GDP contracted by 0.4 per cent in the December quarter, to a level only 1.0 per cent higher than in the December quarter 1994. Contributing to this has been the combination of a high exchange rate and large wage increases early in 1995. Official forecasts for growth in GDP in 1996 have been lowered to 1.5 per cent, from 2.5 per cent in November. Core inflation was 1.7 per cent in the year to February, down from 2.1 per cent in the year to February 1995.
Economic conditions elsewhere in Europe are mixed. Growth has remained firm in the United Kingdom, despite some recent signs of a slowdown. In France, preliminary data suggest that the economy contracted in the December quarter, but more recent indicators, such as consumer spending, point to some recovery in early 1996.
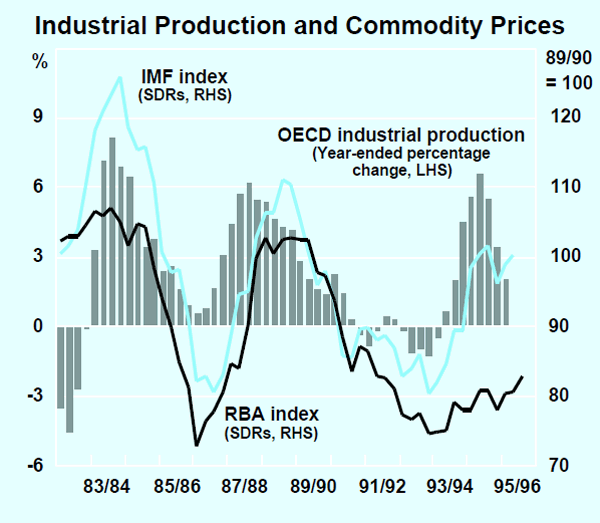
The linkage between OECD industrial production and world commodity prices (see Graph 4) is one of the channels through which the international economic cycle impinges on Australia. While the IMF commodity price index is exhibiting the usual historical linkage, the RBA index (which reflects our specific exports) has not – so far at least – responded much to the recovery in world industrial production in the past couple of years. Stronger growth in the US and Japan appears to lie behind the recent strength in the narrowly-based CRB index; if sustained, this is likely to flow on to a wider range of commodities, including those of particular interest to Australia.
The Australian Economy
Domestic activity
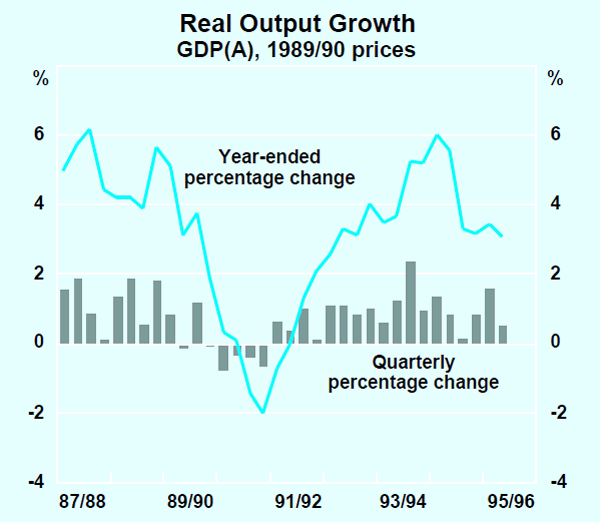
The latest national accounts show that GDP(A) grew by 0.5 per cent in the December quarter, and by 3.1 per cent over the year to the December quarter (Graph 5). This result was boosted by the strength of the farm sector; non-farm GDP grew by 2.6 per cent over the year to December.
| Year to December quarter | December quarter | ||
|---|---|---|---|
| 1994 | 1995 | 1995 | |
| Private consumption | 4.8 | 4.1 | 1.2 |
| Dwelling investment | 8.5 | −15.9 | −5.8 |
| Business investment(a) | 27.1 | 4.6 | 0.8 |
| Government spending(a) | 6.4 | 3.3 | 1.7 |
| Stock-building(b) | 0.4 | −0.4 | −0.9 |
| Exports | 4.6 | 7.6 | 2.0 |
| Imports | 20.3 | 3.3 | 1.4 |
| GDP(A) | 5.5 | 3.1 | 0.5 |
| Non-farm GDP(A) | 6.5 | 2.6 | 0.4 |
| (a) Excluding net second-hand purchases of assets between the private and
public sectors. (b) Contribution to growth in GDP. |
|||
The slowing in growth in the December quarter largely reflects specific short-term cyclical influences, notably inventory adjustment and the downturn in the housing sector. Consumer spending grew strongly, notwithstanding the slowing of employment growth. Business investment showed slight growth, with the continuing strength of spending on construction outweighing a further fall in spending on plant and equipment.
The dominant short-term factors – inventories and housing – will continue to hold back growth in the first half of 1996, but there are underlying factors – both domestic and external – which point to medium-term strength. As these temporary cyclical factors run their course, the underlying strength of the economy should cause growth to quicken in the second half of 1996.
The household sector
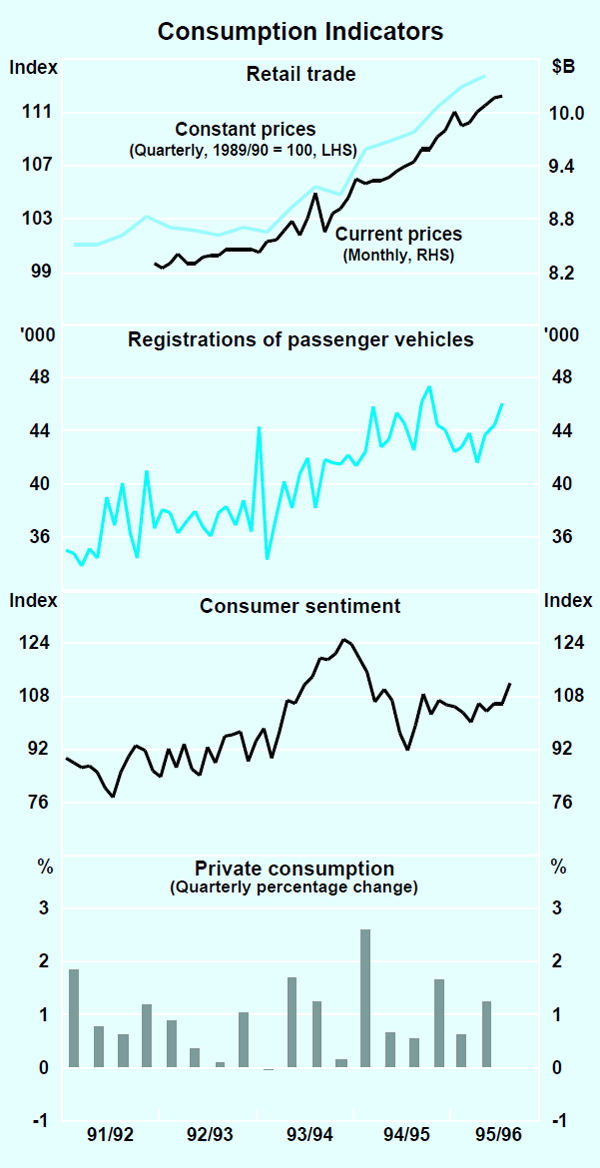
Private consumption rose by 1.2 per cent in the December quarter, well above its longer-term trend. Both retail sales and car registrations continued to grow in the early part of 1996, suggesting continued strength in consumption (Graph 6). Consumer sentiment, as measured by the Westpac-Melbourne Institute Index, rose sharply in March from the already comfortable levels of recent months, providing additional grounds for confidence in continuing good consumption growth.
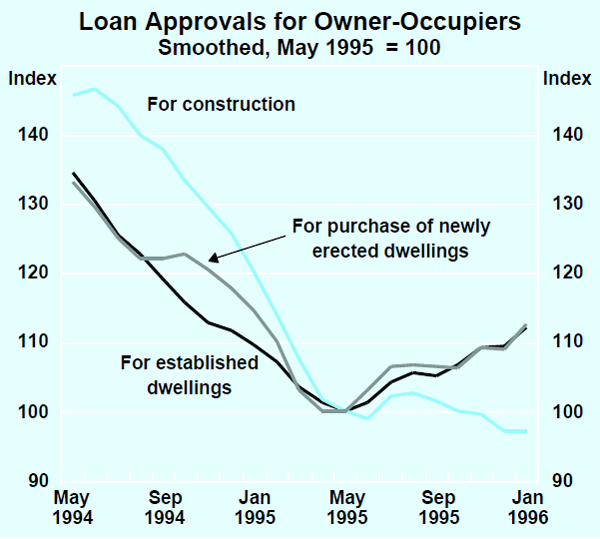
On the basis of historical patterns, the current housing cycle should now be approaching its trough. In that event, while the expansion phase might still be some time off, the significant negative impact of housing over the past year should be drawing to an end. Housing activity fell further in the December quarter, with dwelling investment down by 5.8 per cent. Given recent movements in commencements and building approvals, smaller falls in housing investment can be expected in coming quarters. Loan approval statistics also suggest that activity is approaching the trough of the cycle. The higher loan approvals for the purchase of newly erected dwellings suggest that the considerable over-supply of new dwellings, built during the cyclical upswing, is gradually being wound back – a necessary precursor to any rise in new building activity (Graph 7).
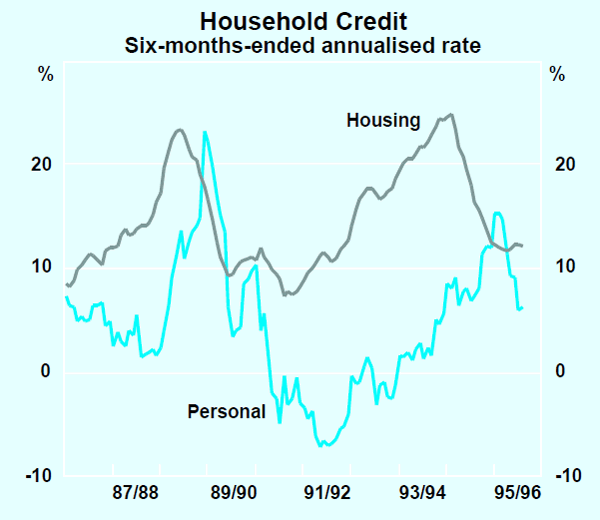
Household finance also seems supportive of household spending. Housing credit increased at an annual rate of about 12 per cent over the past six months (Graph 8). Personal credit (mainly for the purchase of motor vehicles) continues to grow, albeit at less than its recent peak rates. At the same time, the strong share market and high earnings rates of superannuation funds have underpinned substantial increases in the value of households' financial assets. Over recent months, the value of households' financial assets (which represent about a third of total household wealth) has been growing at an annual rate of almost 10 per cent. Housing prices, however, remain broadly flat.
The business sector
Most industries continued to grow during 1995 and the breaking of the drought restored rural output to more normal levels. In the non-farm sector, the strongest growth was in communications, transport and storage, and wholesale trade; exports of manufactures also continued to grow strongly. The slowing evident in economy-wide aggregates has been concentrated in the manufacturing, mining and construction industries. The weakness in manufacturing reflects the earlier cyclical build-up in stocks and the decline in housing activity, which has affected a number of supplier industries. The ACCI-Westpac survey suggests that manufacturing remained weak in the March quarter, with firms reporting a further drop in output and orders.
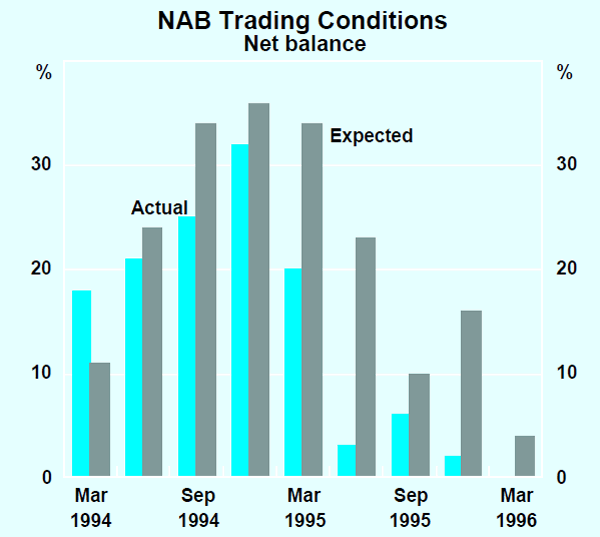
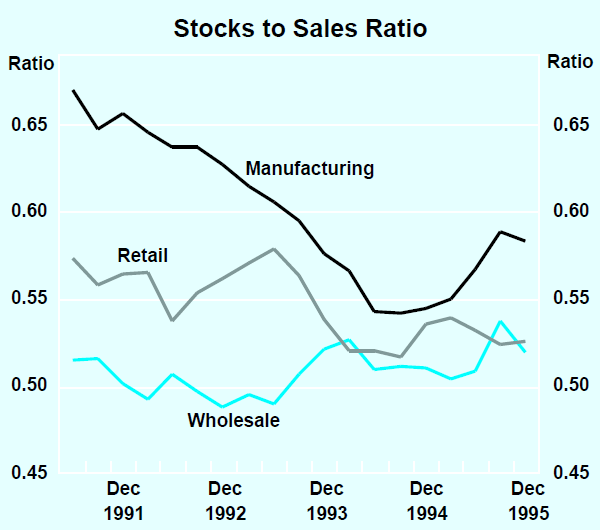
When the economy ‘changed gear’ from the unsustainably high growth of 1994 to the more moderate pace of 1995, manufacturers in particular had difficulty in adapting their production to lower levels of demand. As early as the March quarter 1995, manufacturers had identified some prospective slowing in demand, and their expectations continued to be trimmed back through the year. Actual sales, however, continued to fall short of expected sales as recorded in the NAB survey (Graph 9). Stocks continued to build up until the December quarter, when the inventory adjustment began in earnest, with the ratio of stocks to sales falling in industries in which stocks are concentrated – manufacturing and wholesale (Graph 10). This subtracted about ¾ of a percentage point from overall non-farm growth in the quarter. These ratios remain relatively high, however, especially in manufacturing, suggesting that further adjustment is likely over coming quarters. Certainly, the ACCI-Westpac survey suggests some further drawing down of stocks occurred in the March quarter, although at a slower rate than in the previous quarter.
Slower demand growth and rising labour costs, combined with restricted increases in wholesale prices, have resulted in some reduction in corporate profits. As a proportion of GDP, the gross operating surplus of companies is about 1 percentage point lower than its most recent peak in September 1994 (Graph 11). This is, however, still a healthy level of profits and the profit share remains higher than its longer-term historical average. Some slowing in the rapid growth of profits had to be expected as the early phase of the recovery gave way to the more mature phase of the expansion.
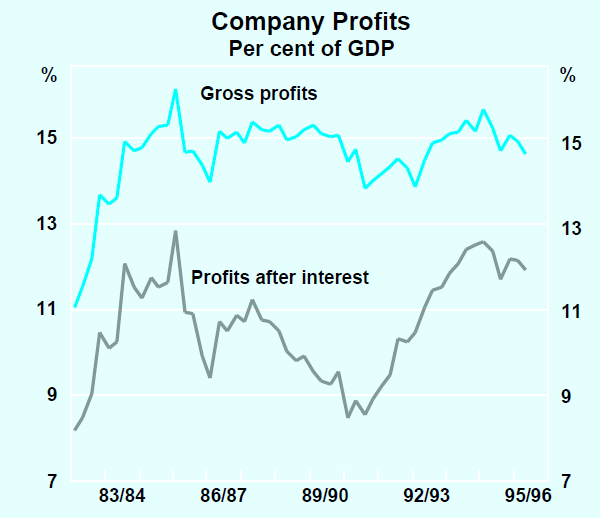
The squeeze on profits shows most clearly in the manufacturing sector (which tends to be the focus of business surveys and, therefore, to figure prominently in public commentary). That said, profits in manufacturing remain in reasonable shape. Looking ahead, profit expectations as revealed in the ACCI-Westpac survey and the Statistician's survey of businesses have become more positive. With interest rates at moderate levels compared with historical norms, company cash flows are much more favourable than in the early 1990s (see profits after interest, Graph 11). In some sectors (eg banking), profits are such as to encourage substantial wage increases.
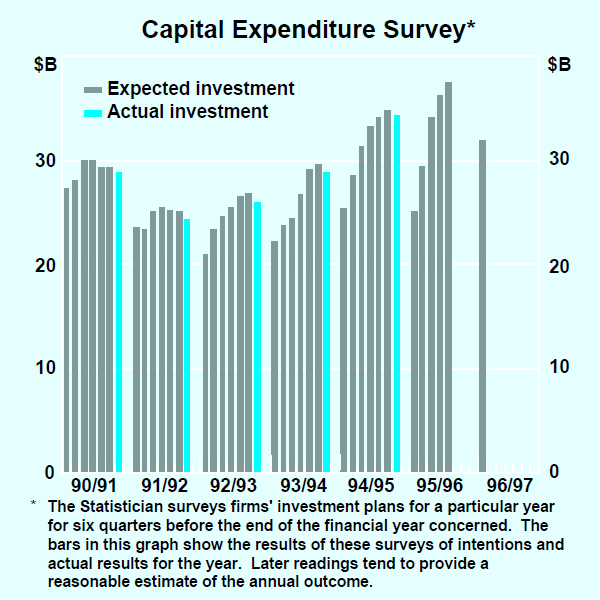
The less-buoyant business climate in 1995 saw growth in business investment slow. Capital spending increased by 0.8 per cent in the December quarter and by 4.6 per cent over the year to December; during the previous year it increased by 27.1 per cent. This pause seems likely to be temporary. Non-dwelling construction recorded good growth in the December quarter and forward-looking indicators of overall business investment are strongly positive: according to the latest ABS Capital Expenditure Survey, a return to strong growth is expected over the coming year (Graph 12). Expectations of capital spending for 1996/97 are 27 per cent higher than the corresponding expectation for 1995/96. If realised, these intentions would imply a sharp rebound in investment from recent levels. The largest planned increases in investment are in the mining industry, although substantial growth is also expected in manufacturing and a number of service industries. With business investment still well below its level at earlier cyclical peaks, relative to GDP, considerable scope remains for further expansion. This will be helped by the recovery in business sentiment. Business confidence improved after the election early in March, with manufacturers expecting a big improvement in the general business situation over the next six months, and higher output and orders in the June quarter. The Statistician's survey of business expectations points to increasing sales across the economy, both in the June quarter and over the year ahead.
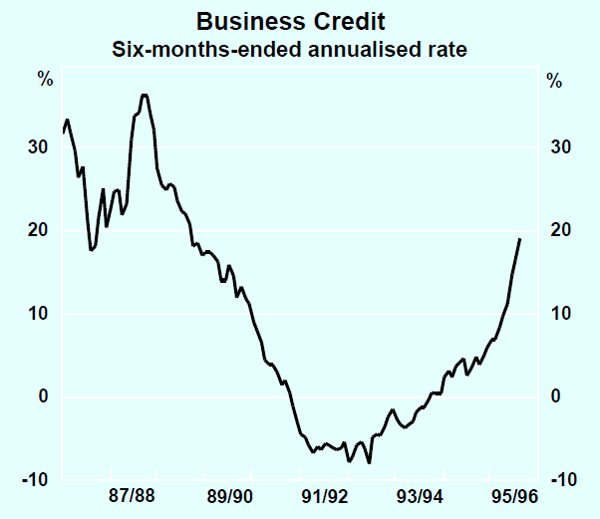
The recent strength in business credit is also consistent with a favourable investment outlook. Over the six months to February, business credit grew at an annualised rate of 18.8 per cent (Graph 13). Allowing for once-off influences (eg the privatisation of several state enterprises in Victoria) reduces this growth rate a little, though it still remains strong. The growth has been concentrated in large lending facilities with fixed interest rates, and in industries such as mining and financial services, suggesting that businesses are borrowing to finance expansion rather than to fund inventories. With corporate balance sheets restored to health, it is not surprising that increasing debt should now be figuring more prominently in financing new investment. Even so, use of equity finance has continued apace, rising at an annualised rate of 13.5 per cent in the six months to January.
Public finance
Revised estimates of the Commonwealth Government's fiscal position now put the headline budget deficit for 1995/96 at $280 million, compared with the surplus of $718 million projected in May 1995, and a surplus of $115 million reported in the mid-year review last December. The underlying budget deficit (which excludes asset sales and state debt transactions) was estimated at $9.0 billion, $2.3 billion higher than that projected in the May 1995 Budget (Table 4).
| 1994/95 | 1995/96 | 1996/97 | 1997/98 | 1998/99 | |
|---|---|---|---|---|---|
| Budget estimate (May 1995) | |||||
| Headline balance | −12.2 | 0.7 | 3.4 | 4.5 | 7.4 |
| − % of GDP | (−2.7) | (0.1) | (0.6) | (0.8) | (1.2) |
| Less revisions since 1995/96 budget | |||||
| Policy decisions | 0.5 | 0.5 | 0.5 | 0.6 | |
| Parameter revisions | 2.1 | 6.3 | 8.8 | 9.8 | |
| Other | −1.6 | 1.5 | 0.0 | 0.9 | |
| Revised headline balance | −11.6 | −0.3 | −4.9 | −4.8 | −4.0 |
| − % of GDP | (−2.6) | (−0.1) | (−1.0) | (−0.9) | (−0.7) |
| Budget estimate (May 1995) | |||||
| Underlying balance(a) | −13.7 | −6.8 | −0.6 | 2.7 | 8.0 |
| − % of GDP | (−3.0) | (−1.4) | (−0.1) | (0.5) | (1.3) |
| Revised underlying balance(a) | −13.2 | −9.0 | −7.6 | −7.3 | −3.3 |
| − % of GDP | (−2.9) | (−1.9) | (−1.5) | (−1.3) | (−0.6) |
| (a) The underlying budget balance is the headline balance less net advances. Net advances consist primarily of asset sales and net repayments by the States of debt. | |||||
For 1996/97, an underlying deficit of $7.6 billion is now projected, which is significantly higher than earlier estimates. Forward estimates for 1997/98 and 1998/99 also show a deterioration from May 1995 budget-time estimates. This deterioration is attributable primarily to downward revisions to forecasts of growth and inflation. The Government has expressed its intention to return the budget to underlying balance in 1997/98, through measures aimed at reducing the projected budget deficits by $4 billion in each of the next two financial years.
The labour market
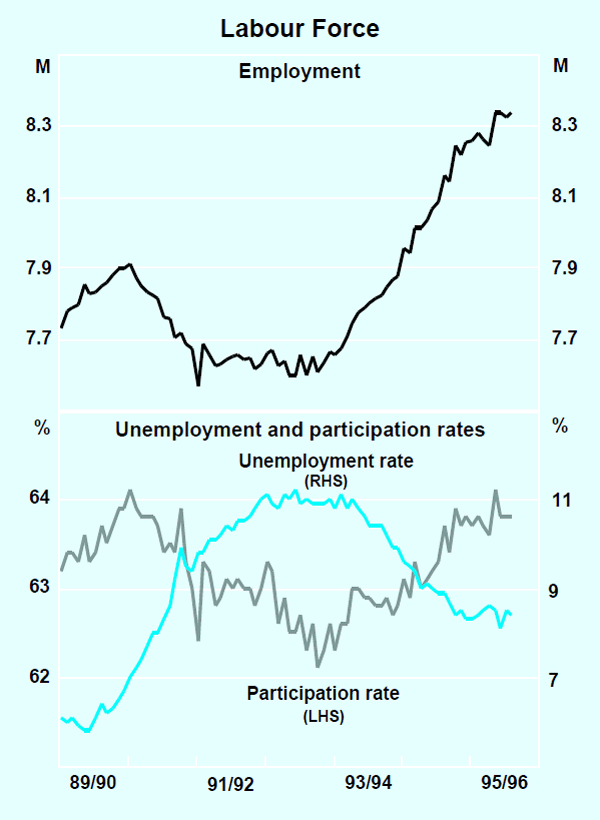
Consistent with the pattern of economic activity, employment growth has been running a little below its long-term trend, and not quite fast enough to reduce unemployment. The pace of employment growth changed around April 1995, from about 5 per cent to an annualised rate of about 1½ per cent since then. Readings from the ‘matched sample’ (which removes the volatility associated with rotation of respondents to the ABS survey) also suggest a slowing, although the pattern is less pronounced.
The labour force participation rate remains at a high level, as a consequence of the strong cyclical recovery evident over the past three years. Reflecting the slower employment growth, the unemployment rate in February was at the same level (8.4 per cent) as in April 1995 (Graph 14).
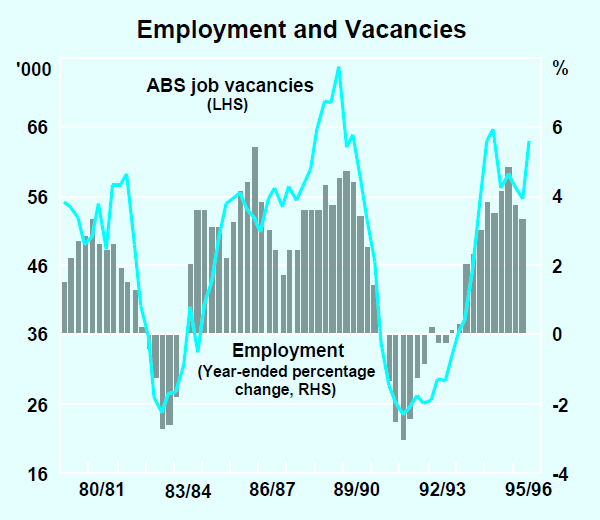
Forward indicators suggest greater strength in the labour market. The ABS series for private-sector job vacancies rose by almost 18 per cent in the March quarter (Graph 15); overtime worked also rose strongly, the first rise in over a year. After falling throughout 1995, the ANZ job vacancy series has recently stabilised, but is still at levels consistent with continuing moderate growth in employment. Hiring intentions reported in business surveys improved in the March quarter.
The external sector
Import growth has been moderate over the past year. After falling by a total of 1 per cent over the previous two quarters, the quantity of imports of goods and services rose by 1.4 per cent in the December quarter, to a level 3.3 per cent higher than a year ago (Graph 16). The trend picked up a little in the early months of the March quarter, when the underlying quantity of imported goods rose by about 4 per cent. A large part of this rise has been imports of capital goods. The average quantity of capital goods imports in January and February was about 13 per cent higher than in the December quarter, partly reflecting investment in the farm sector. Consumption imports have been fairly flat for several quarters.
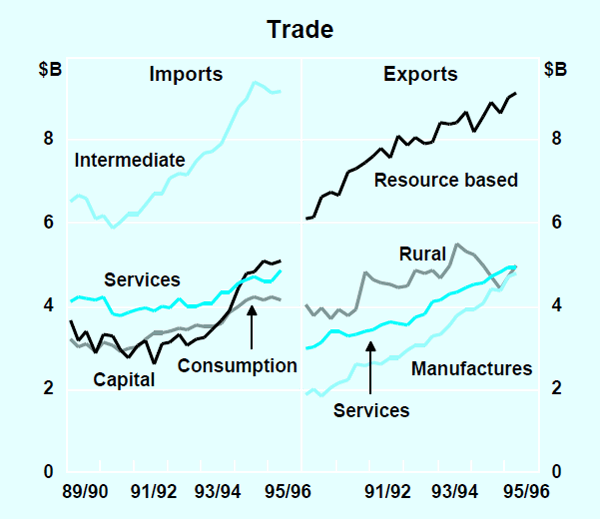
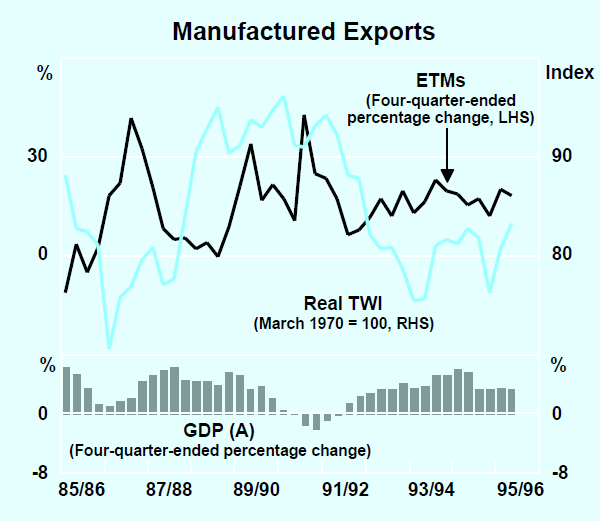
The quantity of exports of goods and services rose by 2 per cent in the December quarter, and by 7.6 per cent over the year. This strength reflected continuing strong external demand and large grain exports following the breaking of the drought. Manufactured exports continue to grow strongly, although growth in service exports has slowed (Graph 16). The combination of a slightly larger rise in exports than imports saw net external demand contribute modestly to GDP growth in the December quarter. The quantity of exports in January and February continued to grow at around the same pace as in the December quarter.
Exports of elaborately transformed manufactures (ETMs) have grown by more than 15 per cent per year since the mid 1980s, and this pace of growth was maintained over the past year (Graph 17). While enhanced international competitiveness created by the fall in the exchange rate in the mid 1980s was an important factor in promoting the subsequent export performance, the on-going growth does not seem particularly sensitive to cyclical changes in the exchange rate. In trade-weighted index terms, the exchange rate has averaged about 56.2 over the past decade; it is currently a little higher than that, at 57.5.
Despite continuing growth in global industrial production, the performance of Australian commodity prices to date has shown little bounce. The Bank's commodity price index, in SDR terms, rose by 2.4 per cent in the March quarter; this rise mainly reflected rising prices of oil, gold and some base metals. Wheat and sugar aside, prices of rural commodities have been falling. The terms of trade were largely unchanged in the December quarter, and have increased only by 7.6 per cent since their trough in the September quarter 1993. As with commodity prices, the terms of trade remain well below the levels reached at similar stages of previous cycles in world growth.
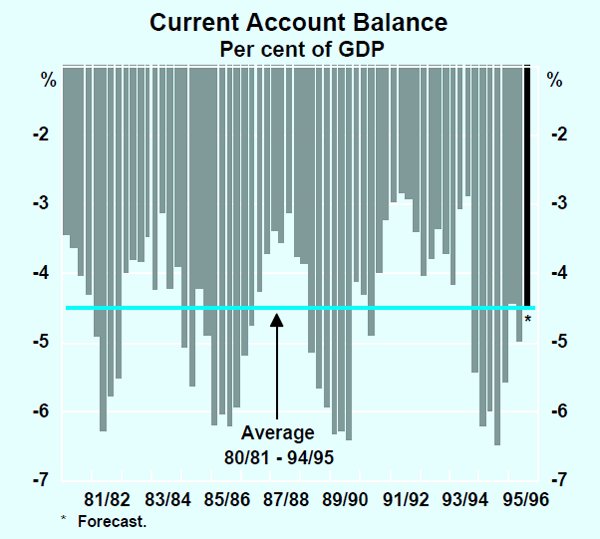
Relatively steady terms of trade combined with limited growth in quantities of net exports produced a small improvement in the balance of trade on goods and services in the December quarter. This was sustained in the first two months of the March quarter. A rise in the net income deficit, associated partly with several large one-off dividend payments, saw the current account deficit rise to 5 per cent of GDP in the December quarter; this highlights the variability of these numbers, with the deficit in the first two months of the March quarter returning to the lower level evident in the September quarter (Graph 18).
Australia's net foreign liabilities rose to around $275 billion (or 58.7 per cent of GDP) in the December quarter, a rise of $5.9 billion. Almost all of this increase reflected a rise in net foreign debt outstanding, to around $185 billion (or 39.4 per cent of GDP). Expressed as a proportion of exports of goods and services, net interest payments were 11.7 per cent and net income payable abroad on equity was 7.6 per cent; these ratios were little changed over the year.
Inflation trends and prospects
Trends in quarterly price movements suggest that inflationary pressures are benefiting from the stronger exchange rate and the effects of inventory adjustments, which are restraining firms' pricing power. Underlying inflation was 0.7 per cent in the December quarter, and 3.2 per cent over the year. The quarterly rate was less than in the previous two quarters, in part reflecting the absence of tax effects which had pushed up the figures for the June and September quarters (Graph 19).
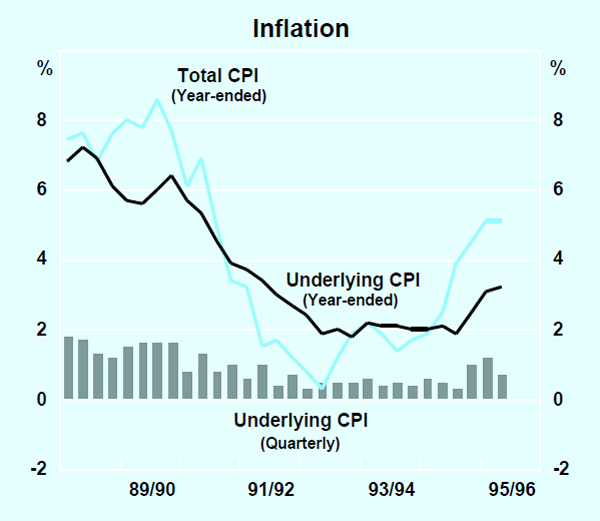
The headline CPI rose by 0.8 per cent in the December quarter, its lowest increase in four quarters, leaving the year-ended inflation rate unchanged at 5.1 per cent. This figure is still significantly distorted by the interest rate increases which occurred in the second half of 1994, but these will begin to drop out of the headline inflation rate in the March quarter, reducing the year-ended headline rate by around one percentage point.
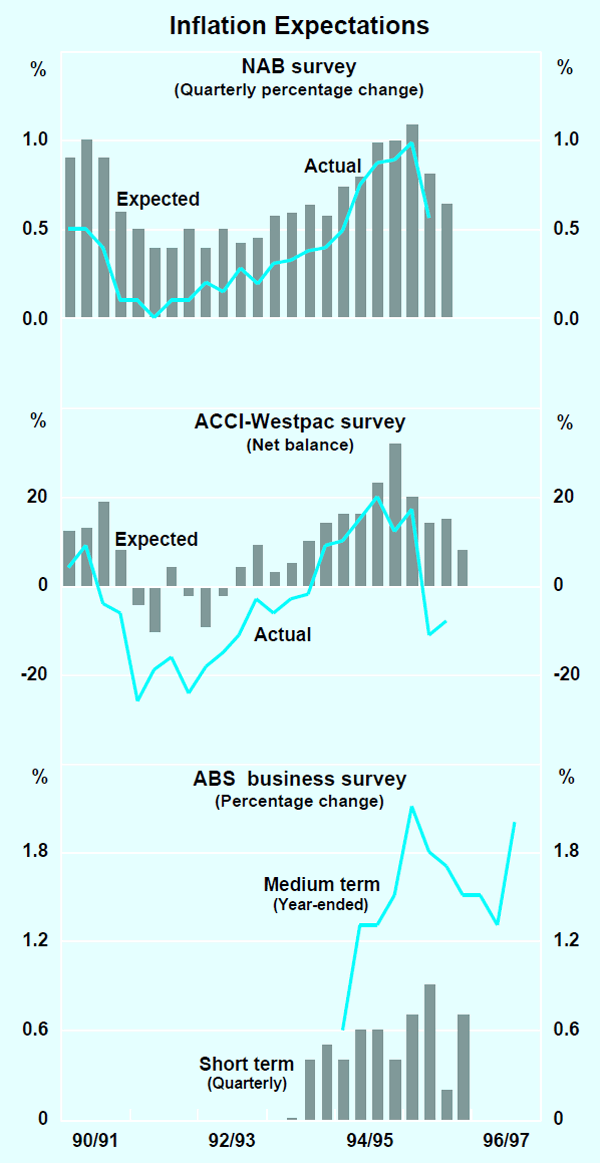
The slowdown in quarterly rates of underlying and headline inflation is consistent with recent survey evidence of smaller increases in actual and expected selling prices. The ACCI-Westpac survey recorded that a net proportion of 8 per cent of firms cut their selling prices in the March quarter (Graph 20), more than had been anticipated three months earlier; at that time a net 15 per cent had expected to raise their prices. Looking ahead, a net balance of 8 per cent of respondents expect price rises in the June quarter, down from 15 per cent in the March quarter. The Statistician's survey of business expectations shows an expectation that selling prices will rise by 0.7 per cent in the June quarter, higher than in the March quarter but, if realised, still consistent with an inflation rate below 3 per cent.
Wholesale prices and margins
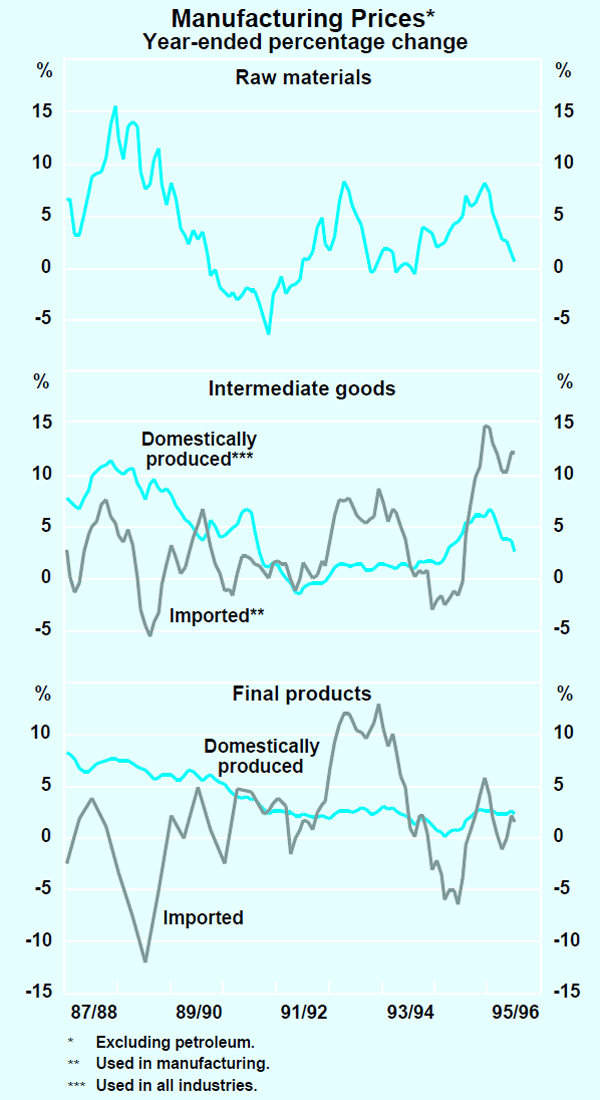
Growth in wholesale prices has been generally subdued at all stages of production. Prices of raw material and intermediate goods, which rose through much of 1995, have eased in recent months, helping to contain growth in final output prices. Final manufacturing prices – a measure of inflation at the end of the production chain – grew by 2.2 per cent over the year to January (Graph 21).
| Over year to period shown | Latest three-monthly period(a) |
|||
|---|---|---|---|---|
| Dec 1994 | Latest | |||
| Consumer prices | ||||
| Consumer Price Index | 2.5 | 5.1 | Dec 1995 | 0.8 |
| Treasury underlying measure | 2.1 | 3.2 | Dec 1995 | 0.7 |
| National accounts deflator | ||||
| GDP deflator | 1.4 | 2.9 | Dec 1995 | 0.3 |
| Private final demand deflator | 0.8 | 2.4 | Dec 1995 | 0.2 |
| Private consumption deflator | 1.3 | 2.8 | Dec 1995 | 0.2 |
| Manufacturing prices | ||||
| Raw material inputs | 4.4 | 0.6 | Jan 1996 | −1.0 |
| Domestically produced goods | ||||
| – Intermediate | 3.5 | 2.6 | Jan 1996 | −0.1 |
| – Final | 0.6 | 2.2 | Jan 1996 | 0.4 |
| Imported goods | ||||
| – Intermediate | −1.7 | 12.1 | Jan 1996 | −0.1 |
| – Final | −6.6 | 1.4 | Jan 1996 | −1.3 |
| Construction prices | ||||
| House building materials | 3.3 | 0.0 | Jan 1996 | −0.4 |
| Other building materials | 2.8 | 2.1 | Jan 1996 | 0.2 |
| Import prices | ||||
| Import price index | −5.6 | 4.3 | Jan 1996 | −0.5 |
| Imported items in the CPI | 2.2 | 0.6 | Dec 1995 | 0.2 |
| (a) Increase in the December quarter for Consumer Price Index, Treasury
underlying measure, deflators for GDP, private final demand and private
consumption and for imported items in the CPI. Otherwise, percentage change
between October and January. |
||||
World oil prices, which have risen sharply in the past two months (reflecting low levels of stocks and uncertainty about the partial lifting of oil embargos against Iraq), pose a potential threat to higher product prices. Oil aside, however, price pressures seem to be under control at the wholesale level. To the extent that keen competition is limiting the scope to raise prices, the impact of higher labour costs is presumably being absorbed in profit margins (see Graph 11). Such a situation is, however, not likely to be sustainable; on-going restraint in price setting, both at the consumer and wholesale level, will depend ultimately on an appropriate degree of wage restraint.
Labour costs
On that score, the latest readings on labour costs provide little evidence of any moderation in wages. The best interpretation of these data is that total labour costs, including employer-funded superannuation, are rising at a rate of around 5 per cent. While these data may suggest that wage pressures have plateaued, forward-looking data on enterprise bargains point to the possibility of some further slippage.
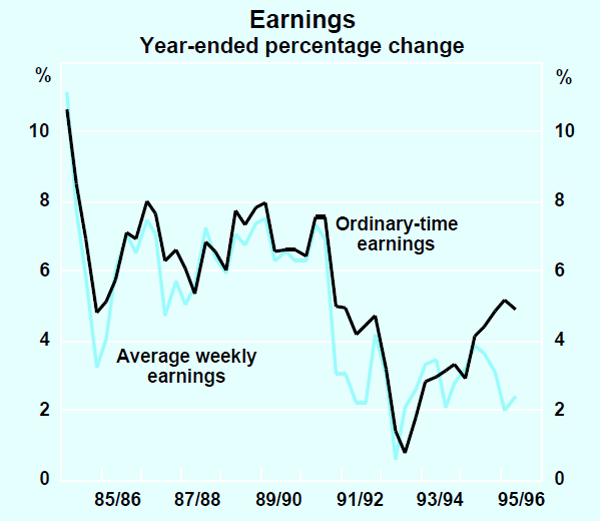
Average weekly ordinary-time adult earnings (AWOTE) rose by 4.9 per cent over the year to November 1995, compared with 4.1 per cent over the year to November 1994. This apparent acceleration is explained partly by the cashing out over the past year or so of various employment conditions under enterprise bargains – which suggests a figure slightly lower than 4.9 per cent. More significant, however, was the tightening of labour market conditions resulting from the fast growth in economic activity over 1994. In the private sector, ordinary-time earnings grew by 6.1 per cent over the year to November; recent changes to the sample of respondents in the earnings survey may have added slightly to this growth rate. In the public sector, AWOTE grew by 2.5 per cent in the year to November.
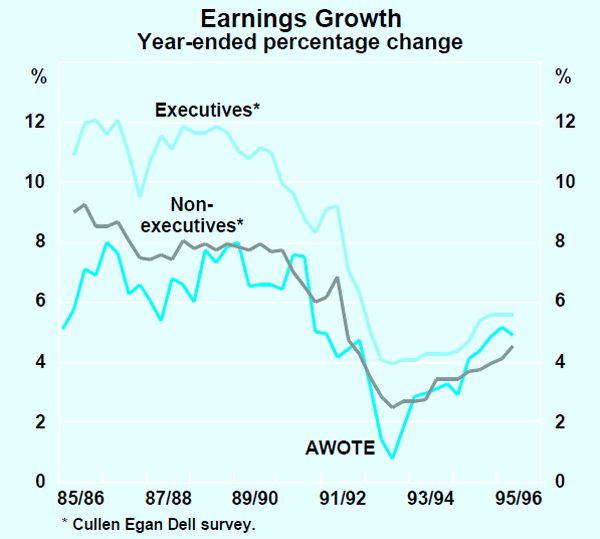
Average weekly earnings (AWE) provides a wider measure of wages which is more representative of the overall work force, but is more difficult to interpret because the sample group is, by its nature, very diverse. This series, which includes over time earnings and earnings of casual, part-time and junior staff, rose by 2.3 per cent over the year to November (Graph 22). Slower growth in AWE than in AWOTE reflects primarily compositional changes between full-time and part-time workers in the AWE series. Adjusting for this, average weekly earnings per hour rose by about 4½ per cent over the year to November. Taking the adjusted AWOTE and AWE figures together suggests a range for wage increases of 4½–4¾ per cent, rising to around 5 per cent or a little more when allowance is made for the cost of employer-funded superannuation. Executive salaries continue to grow more quickly than those in the workforce more generally; the Cullen Egan Dell survey of earnings of skilled workers reports a rise in executive remuneration of 5.6 per cent over the year to the December quarter 1995 (Graph 23).
The AWOTE/AWE figures are essentially backward looking, recording the state-of-play in the year to November 1995. Outcomes from enterprise bargaining provide a forward-looking measure of wages, although this needs to be reviewed cautiously, given that they are based necessarily on a restricted sample. According to the Department of Industrial Relations (DIR), the average annualised wage increase from Federal private-sector enterprise agreements was 4.9 per cent in the December quarter 1995; in the public sector it was 3.9 per cent and overall it was 4.4 per cent (Graph 24).
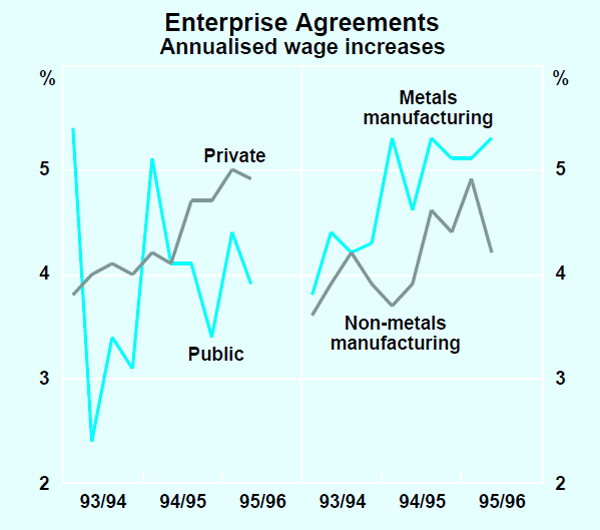
These figures do not yet include some recently completed wage negotiations, such as those in the banking industry, in which several major banks have agreed to annualised wage increases of around 6 per cent. Other claims now in the pipeline would, if granted, also be of concern. Genuine above-average increases in productivity can provide a basis for above-average wage increases; however, for the economy as a whole (where productivity growth is around 1½–2 per cent), the goal of 2–3 per cent inflation over the cycle can be achieved only if total labour costs rise by no more than 4½ per cent.
Inflation expectations
Inflation is driven, to some extent, by the community's expectations of where inflation is going: if price expectations rise, wage negotiations will tend to incorporate the higher figures, producers will be more inclined to raise their prices, and buyers will be more prepared to pay the higher prices. It follows that any slippage of price expectations would be unhelpful for price stability. Notwithstanding the pick-up in headline and underlying inflation in recent quarters, and the relatively high growth in wages, there is little evidence that price expectations have shifted upwards.
Forecasts for headline inflation reported in the Consensus survey have eased in recent months. Between January and March, the mean forecast for 1996 has fallen by 0.3 percentage points to 3.7 per cent; forecasts for 1997 have fallen slightly to 3.5 per cent. Over the past quarter, private-sector forecasters in the financial markets have lowered their median forecast for underlying inflation over the year to June 1996 by 0.2 percentage points, to 3.4 per cent. The median forecast for underlying inflation over the year to June 1997 was largely unchanged at 2.8 per cent. Consumers' inflation expectations, as measured by the Melbourne Institute survey, fell to 4.1 per cent in February, from 5 per cent in each of the previous three months. Consumers have reported inflation expectations in the 4–5 per cent range for more than four years; this series has traditionally over-stated actual inflation by a couple of percentage points. Most business surveys point to subdued price pressures in the near-term, although expectations of inflation in the medium-term appear to have deteriorated slightly.
On current forecasts, the 12-months-ended rate of underlying inflation is expected to peak in the March quarter 1996 at around 3½ per cent, before falling to a little less than 3 per cent in the second half of 1996. This profile partly reflects: the dropping out of the effects of higher indirect taxes which boosted underlying inflation in the June and September quarters of 1995; downward pressure on corporate margins as stocks continue to be run off for a time; and the recent higher levels of the exchange rate. By their nature, however, these influences are essentially temporary, and sustained low rates of inflation will require wages growth to slow.
Financial Market Developments
International bond and equity markets
The second half of 1995 was marked by positive sentiment in international financial markets, largely on the back of a belief that world economic activity was subdued, inflationary pressures were negligible, and monetary authorities were prepared to ease short-term interest rates. In these circumstances, markets marked down long-term bond yields and marked up share prices. (The effect of lower interest rates outweighed any concerns about the effect of slower growth on corporate profits.) At year's end, there was a strong expectation in markets that this process would continue through much of 1996. By mid January, yields on long-term bonds had fallen almost to their lows of late 1993, and share prices reached record highs in a number of countries.
These expectations were jolted abruptly in the March quarter of 1996, leading to a back-up in bond yields, and some instability in share markets.
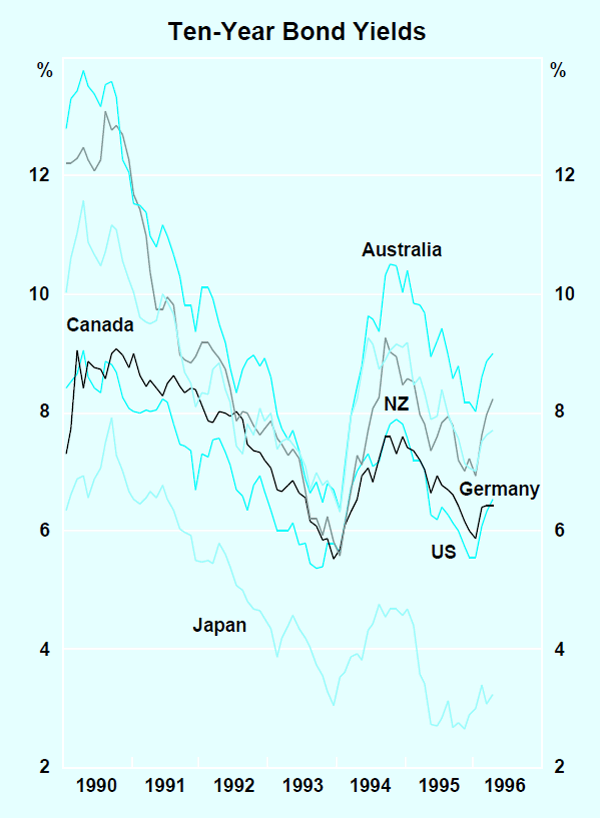
The change in market sentiment emerged first in Germany where, after a succession of monetary policy easings through the second half of 1995, the Bundesbank signalled in early February its intention to hold short-term interest rates stable for a while to evaluate the effect of the earlier moves. Although the Bundesbank did not rule out further reductions in interest rates, markets interpreted the pause to mean the end of the easings phase and, by the middle of February, German long-term yields had risen by 0.3 of a percentage point from their low point a month earlier. Long-term interest rates in several other European countries moved up as well.
Around this time, sentiment in the US market also started to change. The proximate cause for this was Fed Chairman Greenspan's testimony to Congress on 20 February, in which he restated the Fed's view that the US economy would not experience a deep slump, and that growth was likely to gather pace in 1996. Although not new, this restatement triggered some re-assessment by financial market participants of their own positions, which had been predicated on a weaker outlook for growth, and yields increased. It was in this rather nervous environment that some stronger-than-expected US economic data were released during March. With the weather and government shutdown affecting data for December and January, some rebound in activity indicators was expected in February and March. The size of the rebound, particularly in employment, surprised most observers, however, and was seen as further evidence that growth in the US was stronger than had been anticipated. Long-term interest rates rose quite sharply, and by early April, yields on 10-year bonds were at 6.5 per cent, around 100 basis points above their mid-January low.
| Level at 9 April 1996 |
Change from 18 January 1996 |
|
|---|---|---|
| US | 6.54 | 1.03 |
| Germany | 6.44 | 0.65 |
| Japan | 3.23 | 0.18 |
| UK | 8.10 | 0.85 |
| France | 6.58 | 0.28 |
| Switzerland | 4.05 | 0.10 |
| Italy | 10.55 | 0.41 |
| Sweden | 8.54 | 0.62 |
| Spain | 9.50 | 0.24 |
| Australia | 8.99 | 0.85 |
| New Zealand | 8.24 | 1.18 |
| Canada | 7.71 | 0.74 |
As is usually the case, bond yields in other countries were influenced by these developments in the US. This was particularly so in those English-speaking countries where the economic cycle tends to follow that in the US more closely than those in continental Europe or Japan. Taking the mid-January lows in the US as the starting point, yields in the United Kingdom, New Zealand and Australia have risen by a similar amount as US yields; yields in Canada have increased by somewhat less. The correlation of daily movements in bond yields in all these countries with those in the US has been even higher in this recent period than it was in the global bond sell-off in 1994.
| Feb 94 – Nov 94 | Feb 96 – Mar 96 | |
|---|---|---|
| Australia | 0.57 | 0.77 |
| Germany | 0.42 | 0.65 |
| UK | 0.32 | 0.61 |
| Canada | 0.79 | 0.85 |
| New Zealand | 0.60 | 0.69 |
| France | 0.21 | 0.24 |
| Italy | 0.01 | 0.10 |
| Japan | 0.07 | 0.07 |
German yields were also forced higher to some extent by the US sell-off, although it is notable that the premium in German yields relative to those in the US, which had existed throughout the preceding year, has been eliminated. In European countries other than Germany, the moves have been less uniform. Swiss yields, in particular, have risen only slightly, reflecting the ‘safe haven’ status of the Swiss franc and the history of low inflation in that country. The sell-off in France also has been less marked; the spread between German and French yields has narrowed to around 15 basis points, from around 100 points six months ago, apparently because of the heavy weight the market seems to have attached to recent French initiatives towards fiscal consolidation.
The Japanese bond market has been driven mainly by domestic rather than international events, and while yields have trended upwards over the past six months or so, these moves have been relatively contained. One important influence on the Japanese bond market has been the expectation that monetary policy will remain accommodative for some time to come. Confidence in this view was shaken briefly in early February because of Ministerial concerns over the difficulties faced by Japanese people earning very low interest income; yields on 10-year bonds moved sharply higher, to almost 3.5 per cent. This was short-lived, however, and 10-year yields by early April were only around 20 basis points higher than at the end of December.
Australian bond yields followed closely developments in the US market, consistent with the high correlation shown earlier. Yields fell over January and early February, continuing the downward trend evident over most of 1995. The yield on 10-year bonds reached a two-year low of just under 8 per cent in late January/early February, before rising sharply in mid February in response to the sell-off in the US bond market. While international influences were the dominant factor affecting Australian bond yields, some domestic factors – uncertainty about government spending, particularly around the time of the Federal election, and concerns about the wages outlook – were also operative. In early April, 10-year bond yields were just under 9 per cent.
Despite some volatility associated with the bond market sell-off, share prices have risen in most major markets over the past three months. As was the case in the bond market, movements in US share prices have had an impact on other markets. Through January, the Dow Jones index in the United States continued to post new highs and most other major markets followed suit, although to a lesser extent. The subsequent change in sentiment which affected bond markets was translated to equity markets and most markets fell quite sharply in early March. The extent of this correction was varied. In the US it was fairly short-lived and, despite some volatility, the Dow Jones remained close to record highs in early April. The German market also recovered well.
The Japanese share market, like the bond market, moved largely independently of international developments. After making strong gains in January, it moved lower on concerns about rising interest rates and problems in finalising the resolution of the problems of the Jusen (housing finance) institutions. The Nikkei index recovered strongly later in the month, however, as these fears abated and by early April it had reached a four-year high, some 10 per cent above its end-December level.
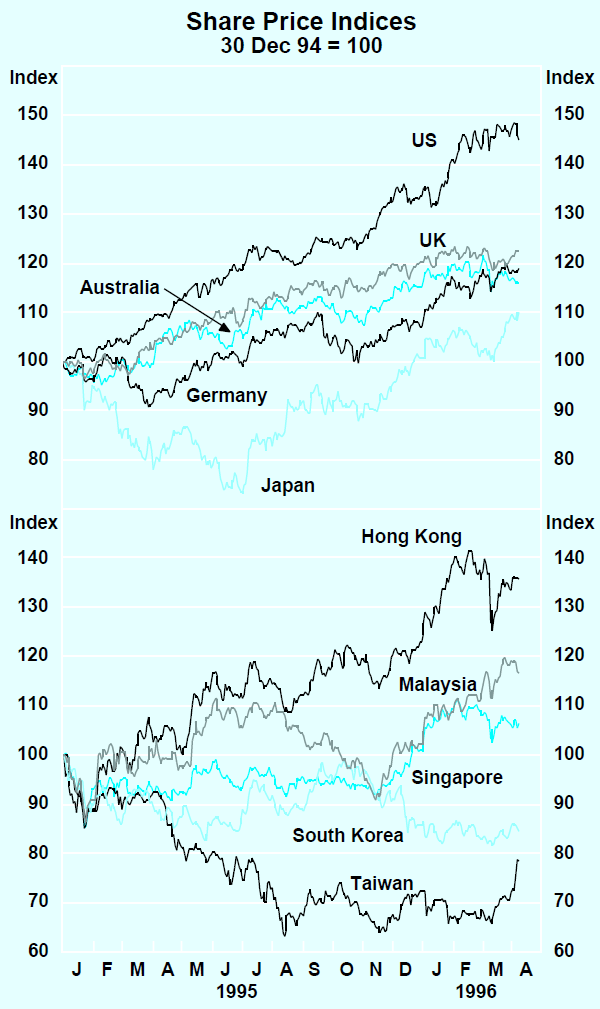
Share markets in Asian countries recorded mixed performances. Interest from overseas investors supported several Asian markets early in the year but, like other markets, they were affected by the volatility in US asset prices. Despite this, share prices in Hong Kong, Malaysia and Singapore all recorded good gains over the quarter. South Korean share prices, on the other hand, recorded a fall, while those in Taiwan recovered sharply after the easing of tensions with China.
Share prices in Australia continued to rise over the first half of the quarter but fell following the sell-off in world bond and share markets in mid-February. Prices recovered in the latter half of February but fell again in early March on the back of concerns about wages and disappointing company profit results. This set the stage for a sharp decline in the wake of the fall in US share prices on 8 March – the All Ordinaries index fell by 3.5 per cent on 11 March, the biggest one-day fall since 16 October 1989. While the US share market recovered subsequently to show a net rise of 9 per cent since end December, the All Ordinaries index showed a net rise of only 0.8 per cent over the same period.
| Change since end Dec 1995 |
Change since end Mar 1995 |
|
|---|---|---|
| US | 8.7 | 33.7 |
| Japan | 9.4 | 34.7 |
| Germany | 11.1 | 30.2 |
| Australia | 0.8 | 16.5 |
| UK | 1.9 | 19.8 |
| Hong Kong | 10.3 | 29.3 |
| Malaysia | 13.9 | 15.2 |
| Singapore | 5.1 | 13.8 |
| South Korea | −1.5 | −6.6 |
| Taiwan | 8.4 | −14.3 |
| Mexico | 10.6 | 52.3 |
| Argentina | −1.7 | 14.4 |
| Chile | −9.0 | −1.0 |
Monetary policy and short-term interest rates
The process of monetary policy easings underway in many countries during the second half of 1995 continued briefly into 1996. The US Federal Reserve eased monetary policy on 31 January, with the federal funds rate declining by 0.25 percentage points, to 5¼ per cent. This was the third reduction since mid 1995. There were reductions, totalling 1.2 per cent, in the key policy rate in Germany – the repurchase rate – over the same period, lowering the rate to 3.3 per cent. In a few instances, the easing process has continued. Citing domestic conditions, the central banks of Canada, Sweden and the United Kingdom, have all eased short-term rates on several occasions over recent months. Since their most recent peaks, cash rates in these three countries have fallen by 3.0, 1.75 and 0.75 percentage points respectively.
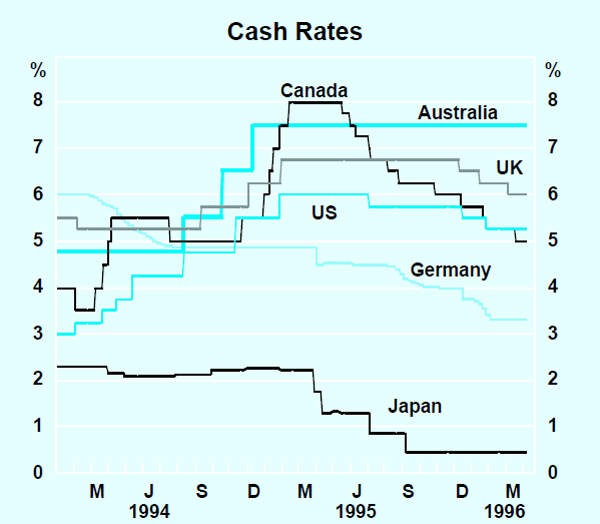
In the US and Germany the end-January adjustments were followed by a period of stability in monetary settings. Short-term Japanese interest rates also remained steady, notwithstanding occasional speculation about when these historically low rates (around ½ of one per cent) might rise.
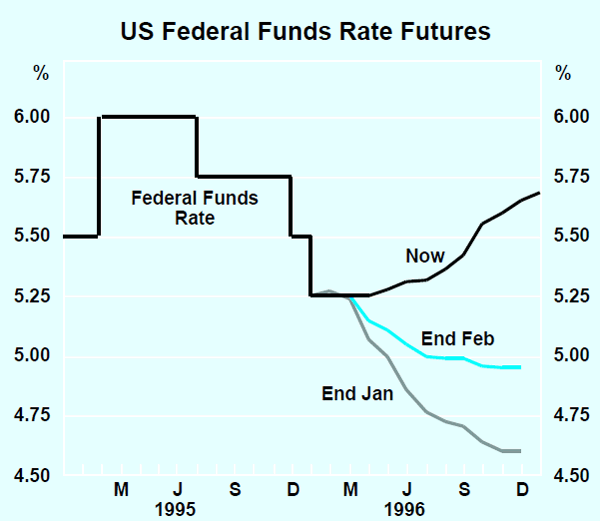
In the case of the US, this stability, associated with generally bullish economic news, led to some adjustment in market expectations about the future path of short-term rates. At the end of January, the markets had been pricing in a further reduction in cash rates of up to 75 basis points during 1996. By the end of February, such expectations had been eliminated from short-term yields; in early April, markets had moved to pricing in a tightening of about 50 basis points by the end of the year.
Changes in the same direction occurred in Germany, stimulated in part by an acceleration in the growth of monetary aggregates, which markets viewed as eliminating the scope for further rate reductions and possibly indicating a need to tighten monetary policy. This reaction was less well-based than in the US, however, given the weakness of the German economy and its low levels of inflation.
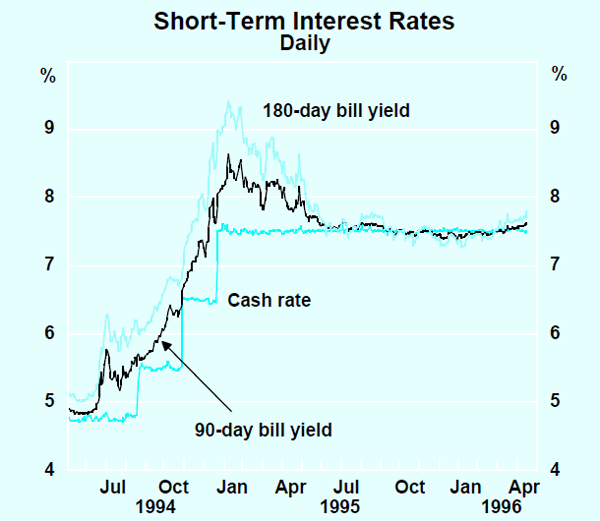
Australian short-term interest rates remained broadly unchanged over the quarter, with the 90-day bank bill yield fluctuating in a narrow band around the cash rate. There was, however, a shift in expectations of the likely course of cash rates over the second half of 1996 similar to that which occurred in the US, although on a lesser scale. Whereas the market was pricing in a late 1996 easing at the start of January, by early April it had moved to pricing in a tightening. This was reflected in yields in bill futures contracts for late 1996 which increased from 7 per cent to 8 per cent.
Domestic financial intermediation
In the housing loan market, the banks' predominant variable interest rate remains unchanged at 10.5 per cent. The average mortgage rate paid by customers, however, remains below this predominant variable rate as new borrowers take advantage of more competitively-priced products offered by new entrants into the housing finance market and existing borrowers renegotiate better deals. The traditional lenders have sought to segment the housing finance market by emphasising the benefits of their ‘full service’ package-deal mortgages, on which their lending margins are larger. Continued competition from the mortgage managers, however, has seen several banks introduce ‘no frills’ home loans (as marketed by the mortgage managers) during recent months. In addition, some mortgage managers have introduced more flexible products that have traditionally been available only from banks.
The indicator interest rate for small business loans increased slightly from 11.2 per cent to 11.3 per cent over the quarter. Interest rates on fixed-rate loans were reduced early in the quarter, but increased slightly in March, reflecting the upward movement in bond yields.
In response to recommendations from the Prices Surveillance Authority's inquiry into retail account fees and charges, banks have introduced new basic banking accounts. While the structure of these accounts differs among institutions, the basic features of the accounts are that there is no minimum monthly balance requirement, no account-keeping fees, no cheque access and a limited number of transactions before charges are incurred. Banks also revamped other transaction accounts, and in most cases have cut the interest rates on low-balance deposits in these accounts.
The growth of credit, which has edged up almost continuously over recent years, rose again over the past six months. In the 12 months to February credit rose by 12.2 per cent, compared with growth of 9.7 per cent in the 12 months to June 1995. The large increase in lending for business more than offset the slowing in lending for housing; over the past 12 months all categories of credit have grown at a similar rate.
The monetary aggregates are growing more slowly than credit, largely because some of banks' lending is being financed by foreign currency deposits and, to a lesser extent, capital. Broad money grew by 9.5 per cent in the 12 months to February, compared with 7.1 per cent in the 12 months to June 1995. All measures are growing at a similar rate, except for the narrowest measure – currency – which is now growing more slowly than the broader measures.
| Currency | 4.2 |
|---|---|
| M1 | 8.8 |
| M3 | 9.2 |
| Broad money | 9.5 |
| Credit | 12.2 |
| of which: | |
| Business | 12.7 |
| Housing | 12.0 |
| Personal | 10.7 |
Foreign exchange markets
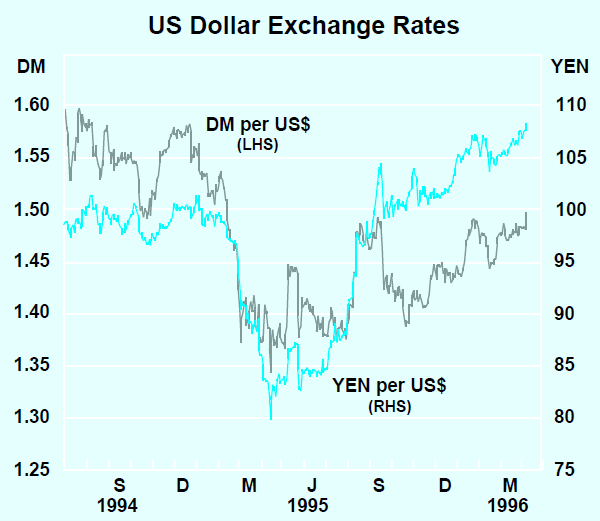
The US dollar has tended to move higher over recent months, continuing its recovery from the all-time lows against other key currencies which were reached during the middle of 1995. Against the mark, the dollar reached a high of 1.49 marks at the end of January, compared with 1.44 at the end of December. The rise against the yen was even stronger, from 102 to 107. The dollar subsequently gave up most of those gains in February, before firming again in March. In early April, the dollar was around 1.49 marks, and 108 yen. In trade-weighted terms, the dollar has risen by about 2½ per cent since the end of December.
In the case of the dollar/yen rate, recent movements take the dollar to its highest level for over two years, and more than 30 per cent higher than the low point reached less than a year earlier. One factor behind this rise is the publicly expressed wish of the Japanese authorities, along with their G7 colleagues, for a higher dollar/lower yen. This has been backed up on occasion by intervention, particularly by the Bank of Japan which has been reported to have been intervening heavily over recent months, at a time when there were widespread expectations that end-financial year repatriation of funds by Japanese firms would push the yen up. More recently, the Taiwan/China tensions have seen some ‘safe-haven’ buying of US dollars.
The Australian dollar has moved up strongly over the past few months to reach around 57.5 on a trade-weighted basis, a rise of 7 per cent since December. Against the US dollar, the $A rate reached US78.5 cents by early April, compared with US74 cents in December.
The currency was supported initially by a growing realisation that an easing in Australian monetary policy was not imminent, even though other countries lowered their short-term rates. Of more importance over recent months, however, has been the realisation that prospects for world growth have improved with the upward reassessment of the US and Japanese economies. Commodity prices generally have firmed during this period, and while they have not risen as much as in earlier upswings, confidence in future rises has grown and the appetite for $A exposure amongst international fund managers increased. Long-term interest differentials are also supportive of the $A, and continuing demand for Australian dollar investments has come from Japanese retail investors.
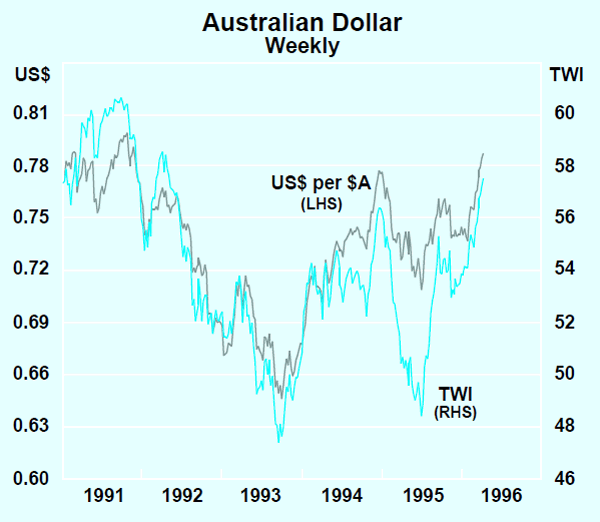
The recent rise in the $A, although relatively rapid, has been from the relatively low levels reached around the middle of 1995. In trade-weighted index terms, the $A is only slightly above its average level of 56.2 recorded over the past decade. Until recently, if anything, the Australian dollar was a little low relative to post-float experience.